 KBW 2012 Southeast Bank Mini Conference November 30, 2012, Presented by John Corbett and Jim Antal Exhibit 99.1 |
 Forward Looking Statement 2 2 This presentation contains forward-looking statements, as defined by Federal Securities Laws, relating to present or future trends or factors affecting the operations, markets and products of CenterState Banks, Inc. (CSFL). These statements are provided to assist in the understanding of future financial performance. Any such statements are based on current expectations and involve a number of risks and uncertainties. For a discussion of factors that may cause such forward-looking statements to differ materially from actual results, please refer to CSFL’s most recent Form 10-Q and Form 10-K filed with the Securities Exchange Commission. CSFL undertakes no obligation to release revisions to these forward-looking statements or reflect events or circumstances after the date of this presentation. |
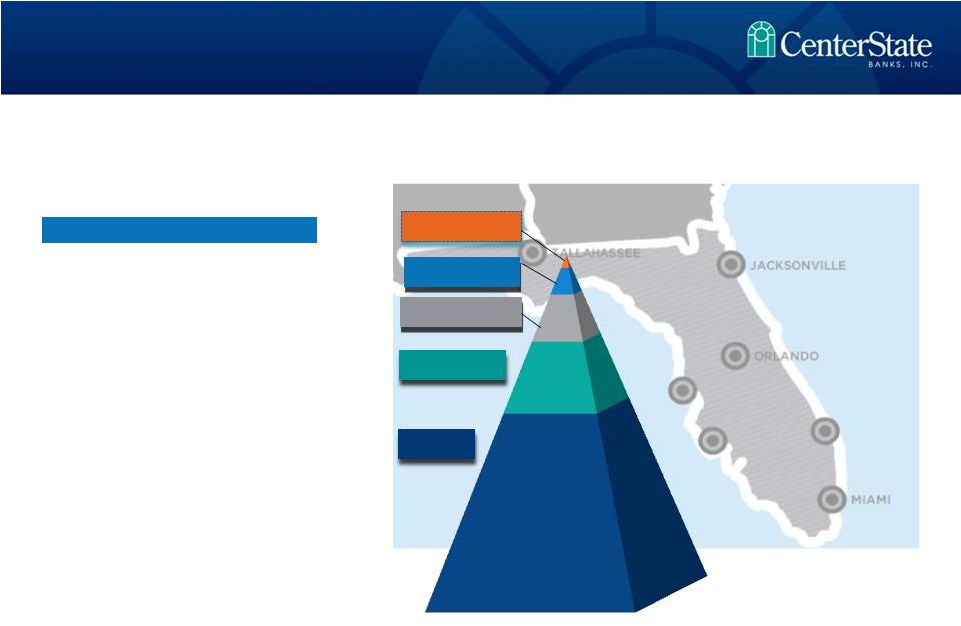
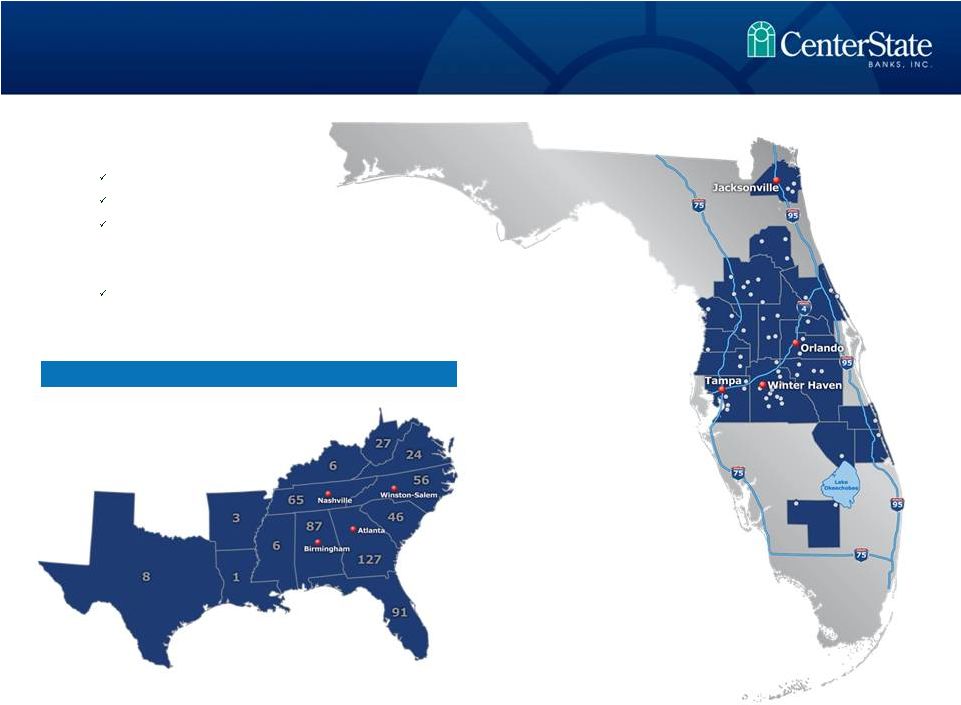 Correspondent Banking Market • Headquartered in Davenport, FL $2.4 billion in assets $1.4 billion in loans $2.0 billion in deposits • Company formed: June 2000 1 Subsidiary Bank Corporate Overview 3 Data as of 9/30/12 |
 • CAPITAL - Total Risk-Based Capital Ratio – 17.6% • LIQUIDITY - Loans / Assets - 61% • LOANS WITH THIRD PARTY PROTECTION – 26% 21% of loans are covered by loss sharing agreements with the FDIC 5% are subject to “Put Back” agreement with TD Bank 10% were subject to “Put Back” agreement with Hartford Ins Co ending Nov 1, 2012 • ASSETS WITH THIRD PARTY PROTECTION – 41% * 36% - Backed by the United States 5% - Backed by TD Bank • LOW CONCENTRATION LEVELS ** CRE at 103% of capital vs. 300% guidance CD&L at 16% of capital vs. 100% guidance * Includes cash and cash equivalents, AFS securities issued by U.S. Government Sponsored Entities, FDIC covered assets, and FHLB and FRB stock. **Excludes FDIC covered loans Conservative Balance Sheet 4 TCE Ratio – 9.4% |
 5 Ocala National Bank Olde Cypress Community Bank Independent National Bank of Ocala Community National Bank of Bartow Central Florida State Bank First Guaranty Bank & Trust Co. TD Bank divesture in Putnam Federal Trust Acquisition from The Hartford Insurance Company Opportunistic through the Crisis 5 Correspondent Banking Division Prepaid Card Division Wealth Management Division Trust Department Vero Beach Okeechobee Jacksonville FDIC Acquisitions Non – FDIC Acquisitions Strategic Expansion & Management Lift-Outs New Fee-Based Business Lines |
 Source: Florida Realtors, Monthly Indicators September 2012 report Single Family Inventory 16 Months Supply of Inventory • Median single family home prices are up 7% from last year • Pending home sales are up 40% from last year • Average days on the market are down 18% from last year Florida Housing on the Road to Recovery 6 188,213 145,314 99,534 2010 2011 2012 2010 2011 2012 12.0 8.7 5.2 |
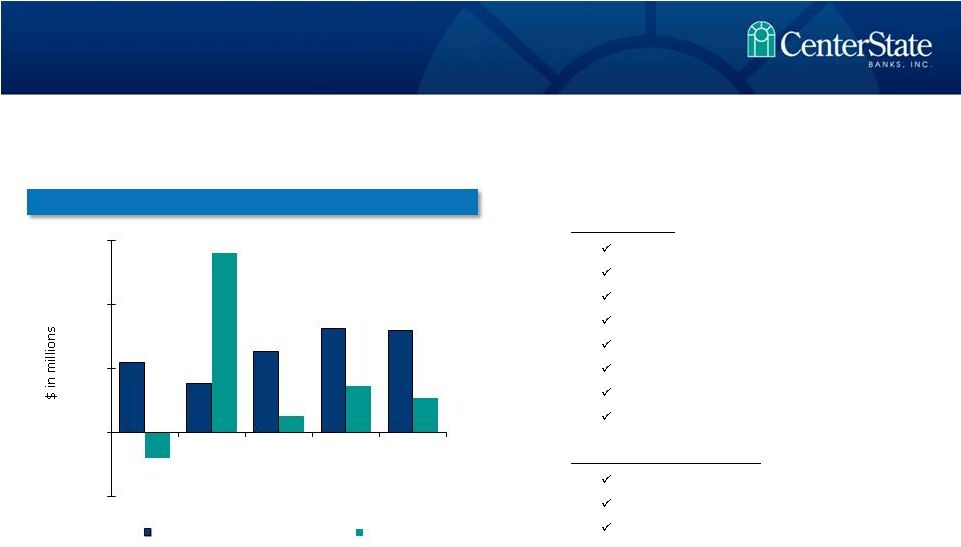
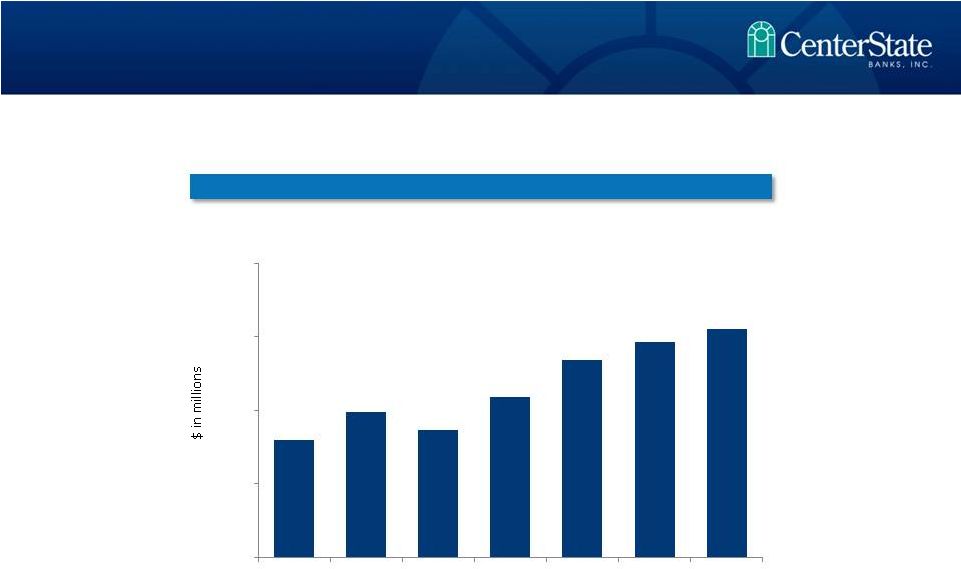 New Loan Production 19 Loan Trends as of September 30, 2012 7 Excluding FDIC covered assets $32 $40 $35 $44 $54 $59 $62 $ $20 $40 $60 $80 1Q11 2Q11 3Q11 4Q11 1Q12 2Q12 3Q12 |
 17 38% Source: SNL Financial Data as of 9/30/12 or MRQ Banks with Texas Ratio over 200% 8 |
 18 CSFL Advantages • CSFL is one of only seven major exchange traded banks headquartered in FL with assets between $1 billion and $10 billion • Proven experience through 8 successful acquisitions in the past 3 years • Disproportionate number of sellers versus very few buyers • The number of small, distressed Florida institutions remains high CSFL – Best Positioned Florida Consolidator Source: SNL Financial Data as of MRQ available 9 < $250 mm 105 Banks > $1.0 bn & Public 7 Banks $1.0 bn & Private 14 Banks $500 mm - $1.0 bn 25 Banks $250 - $500 mm 38 Banks |
 • 3Q12 Results: $0.09/sh on $2.7M net income Margin expansion to 4.34% (4.23%) Improved credit metrics Increase in loan loss provision expense Decrease in bond sales revenue Modest organic loan growth Branch consolidation & efficiency results Slight decrease in PTPP • Profitability Components: Credit Cost Net Interest Margin Operating Efficiencies Profitability Metrics 10 $5.5 $3.8 $6.3 $8.1 $8.0 ($2.0) $14.1 $1.3 $3.7 $2.7 ($5) $0 $5 $10 $15 3Q11 4Q11 1Q12 2Q12 3Q12 Pre-Tax, Pre-Provision Income Net Income PTPP & Net Income 1 1. Pre-tax pre-provision income (“PTPP”) is a non-GAAP measure that if defined as income (loss) before income tax excluding provision for loan losses, gain on sale of available for sale securities, other credit related costs including losses on repossessed real estate and other assets, other foreclosure related expenses., and non-recurring items. |
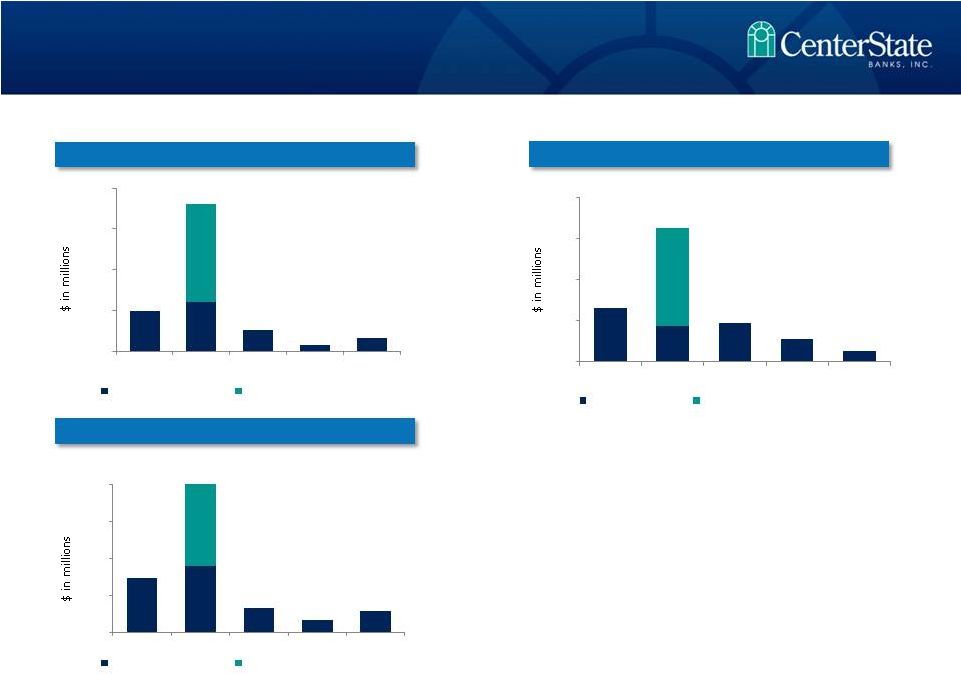 $21.0 $18.0 Excludes FDIC covered loans • Provision expense trending downward • Net charge-offs trending downward • Total credit cost trending downward Credit Cost 11 $6.5 $4.3 $4.7 $2.7 $1.3 $12.0 $ - $5 $10 $15 $20 3Q11 4Q11 1Q12 2Q12 3Q12 Net Charge-offs NCOs related to loan sales $5.0 $6.0 $2.7 $0.8 $1.7 $12.0 $5 $10 $15 $20 3Q11 4Q11 1Q12 2Q12 3Q12 Loan Loss Provision LLP related to loan sales $ - $16.3 $7.3 $9.0 $3.3 $1.8 $2.9 $12.0 $ - $5 $10 $15 $20 3Q11 4Q11 1Q12 2Q12 3Q12 All other credit cost LLP related to loan sales Loan Loss Provision (LLP) Net Charge-Offs (NCOs) Total Credit Costs |
 NPA Inflows – Slowing Down 12 Excluding FDIC covered assets $- $5 $10 $15 $20 $25 $30 $35 4Q09 1Q10 2Q10 3Q10 4Q10 1Q11 2Q11 3Q11 4Q11 1Q12 2Q12 3Q12 |
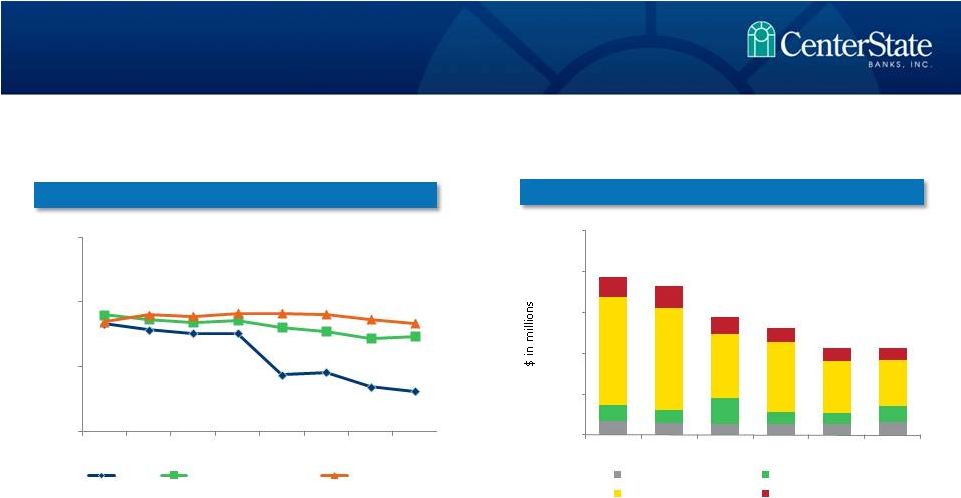
 5.42% 5.21% 5.23% 5.20% 5.08% 5.00% 5.10% 5.20% 5.30% 5.40% 5.50% 3Q11 4Q11 1Q12 2Q12^ 3Q12^^ 6.21% 6.80% 6.74% 6.91% 7.17% 5.75% 6.75% 7.75% 3Q11 4Q11 1Q12 2Q12* 3Q12** $176 $168 $309 $337 $318 $231 $218 $429 $488 $464 $- $100 $200 $300 $400 $500 $600 3Q11 4Q11 1Q12 2Q12 3Q12 Carrying Balance Unpaid Principal Balance $991 $1,100 $1,117 $1,122 $1,130 $950 $1,000 $1,050 $1,100 $1,150 3Q11 4Q11 1Q12 2Q12 3Q12 Covered Loans - Average Yields Covered Loans – Average Balances Non-Covered Loans – Average Balance Loans – Yields and Averages Non-Covered Loans – Average Yields * Adjusted for excess cash flows relating to one loan pool. ** Adjusted for excess cash flows relating to two loan pools. ^ Adjusted for non-accrual loan upgrades ^^ Adjusted for excess cash flows relating to one noncovered loan pool and a put back loan adjustment 13 |
 14 IA – negative accretion ($ in thousands) 3Q11 4Q11 1Q12 2Q12 3Q12 Average FDIC covered loans $176,275 $167,512 $309,435 $337,258 $317,914 Interest accretion $2,759 $2,873 $5,189 $6,372 $5,908 Yield 6.21% 6.80% 6.74% 7.60% 7.39% IA accretion (amortization) included in non interest income ($225) ($699) ($496) ($290) ($705) Interest accretion less IA amortization $2,534 $2,174 $4,693 $6,082 $5,203 Yield, including IA amortization 5.70% 5.15% 6.17% 7.25% 6.51% Average IA balance $56,182 $52,231 $102,935 $131,463 $128,255 Yield, including IA balances 4.32% 3.93% 4.63% 5.22% 4.64% Indemnification Asset (“IA”) amortization and its effect on FDIC covered loan interest accretion 14 |
 8 Costs of Deposits Yield on Interest Earning Assets Net Interest Margin (excluding Correspondent Division) Net Interest Margin 15 4.30% 4.33% 4.50% 4.78% 4.72% 3.00% 4.00% 5.00% $0.0 $1.5 $2.0 $2.5 3Q11 4Q11 1Q12 2Q12 3Q12 Non FDIC Covered Loans FDIC Covered Loans AFS Securities All other Yield on Earning Assets 0.62% 0.55% 0.43% 0.38% 0.34% 3Q11 4Q11 1Q12 2Q12 3Q12 Time Deposits Non Time Deposits Demand Deposits Cost of Deposits 3.83% 3.93% 4.20% 4.48% 4.51% 3.40% 3.75% 4.10% 4.45% 4.80% 3Q11 4Q11 1Q12 2Q12 3Q12 $0.5 $1.0 0.20% 0.40% 0.60% 0.80% $0.0 $0.5 $1.0 $1.5 $2.0 $2.5 |
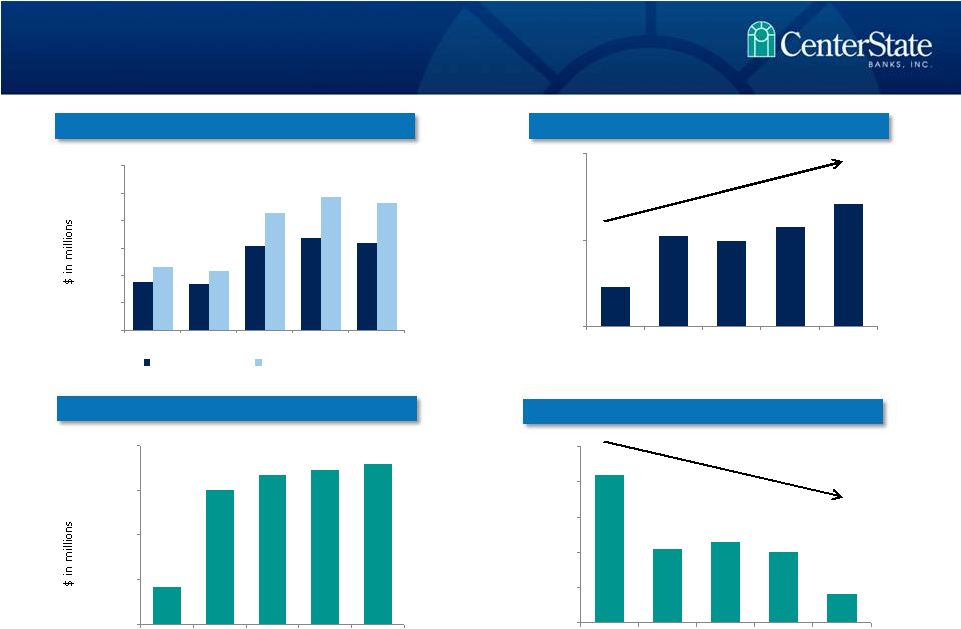
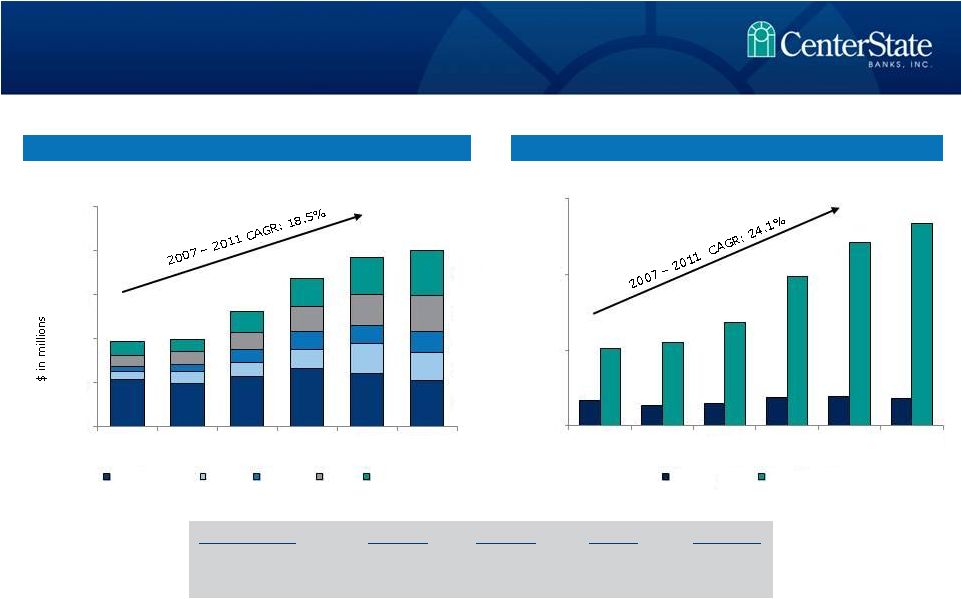 25% 21% 26% 12% 16% • Value of core deposits not fully realized in this low rate environment. • Approximately 121,601 total accounts - $16,430 average balance per account Core deposits defined as non-time deposits. 9 DDA and NOW 9/30/11 9/30/12 Change % Change Balance $713MM $915MM $202MM 28% No. of Accounts 60,354 84,997 24,643 41% Building Franchise Value with Core Deposits 16 528 314 240 411 505 0 500 1,000 1,500 2,000 2,500 2007 2008 2009 2010 2011 9/30/12 Time Deposits MMDA Savings NOW DDA 13,191 11,001 12,025 14,998 15,277 14,705 40,822 43,974 54,561 78,874 96,699 106,896 0 40,000 80,000 120,000 2007 2008 2009 2010 2011 9/30/2012 Time Deposits Core Deposits Total Deposits Number of Deposit Accounts |
 11 Branch Consolidation – 15 ( 11 FDIC / 4 Legacy) Reduction in Force - 85 Data Processing Conversions – Complete July 2012 Merger of Subsidiaries – Complete June 2012 Events since 1-1-12 Focus on Efficiency and Core Earnings - 2012 17 |
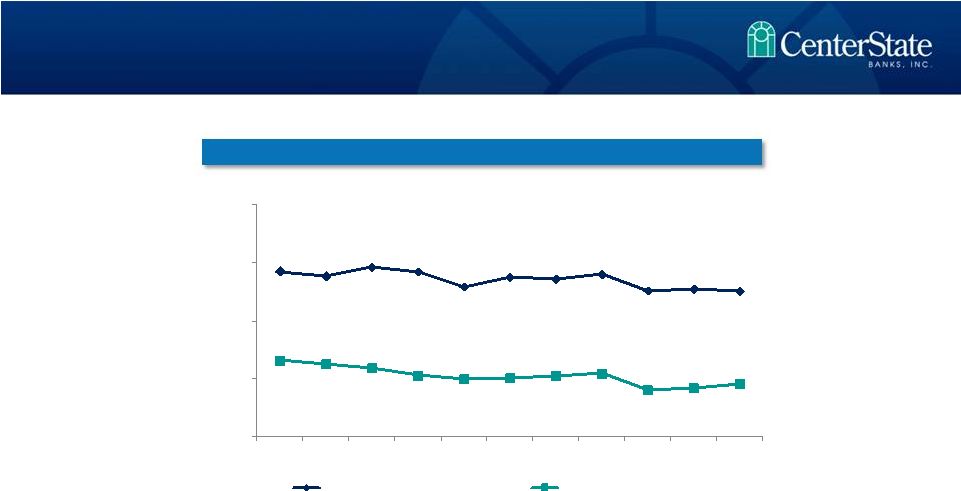
 Operating Efficiencies 18 * Efficiency Ratio is defined as follows: [non-interest expense – merger related expenses – other nonrecurring expense] / [net interest income + non-interest income – gain on sale of AFS securities – nonrecurring income] **Efficiency Ratio, excluding credit costs is defined as follows: [non-interest expense – merger related expenses – credit costs – CDI amortization - other nonrecurring expense] / [net interest income (fully tax equivalent) + non-interest income – gain on sale of AFS securities – nonrecurring income] 90% 101% 84% 81% 84% 79% 88% 78% 74% 72% 60% 70% 80% 90% 100% 110% 3Q11 4Q11 1Q12 2Q12 3Q12 Efficiency Ratio* Efficiency ratio, excluding credit costs** Efficiency Ratio |
 20 • Florida economy improving • CSFL metrics improving with better performance anticipated • Vision still includes bank consolidations • Expect better efficiencies in the near term • Lifetime local bankers with common lineage Summary 19 |
 Appendix |
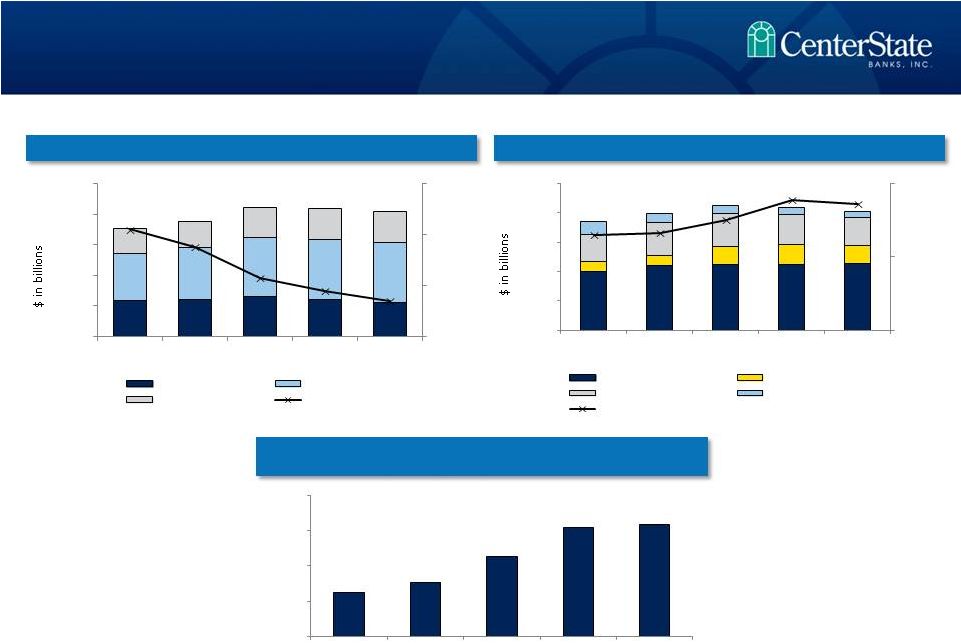
 NPAs / Loans & OREO (%) Problem Loan Trends Source: SNL Financial and Company filings. Peer information updated quarterly Nonperforming assets include 90 days or more past due. Southeastern peers include ABCB, BTFG, PNFP, RNST, SCBT, UBSH and UCBI. Florida peers include all banks headquartered in Florida , opened no later than 12/31/2005 and total assets between $500 million and $5 billion. 14 Credit Quality Trends - Improving 20 3.12 7.35 8.35 0.00 5.00 10.00 15.00 4Q10 1Q11 2Q11 3Q11 4Q11 1Q12 2Q12 3Q12 CSFL Southeastern Peers Florida Peers $8.5 $7.1 $6.6 $6.7 $6.8 $7.7 $10.1 $8.2 $16.3 $7.5 $6.9 $9.9 $66.0 $62.2 $39.0 $42.7 $31.9 $28.7 $12.1 $13.8 $10.3 $8.6 $7.5 $6.9 $0 $25 $50 $75 $100 $125 2Q11 3Q11 4Q11 1Q12 2Q12 3Q12 TDRs accruing only 30 - 89 days past due 90 days and nonaccrual OREO/ORA |
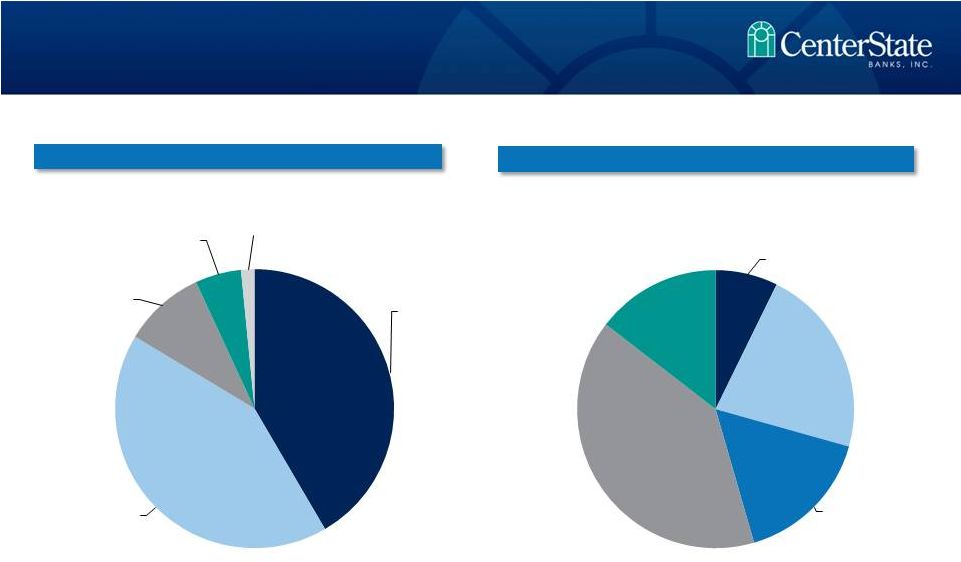 Non-Performing Loans ($M) • $6,854M • OREO & Repos are carried at 41% of Unpaid Principal Balance 15 Data as of 6/30/12 OREO & Repo ($M) • $28,779M (2.54% of Gross Loans) • NPLs are carried at 74% of Unpaid Principal Balance • Current NPLs at 33% 42% 42% 9% 5% (26) (33) 2% (29) (96) (39) (8) 7% 22% 40% 15% 16% (22) (12) (33) (8) NPA Breakout as of September 30, 2012 21 Excluding FDIC covered assets Residential, $11,964 Comm RE, $12,103 Constr, Dev, Land, $2,726 Commercial, $1,536 Consumer, $450 1-4 Family, $497 Comm Buildings, $1,515 Resi Lots, $1,109 Vacant Land, $2,737 Other Repo, $996 |
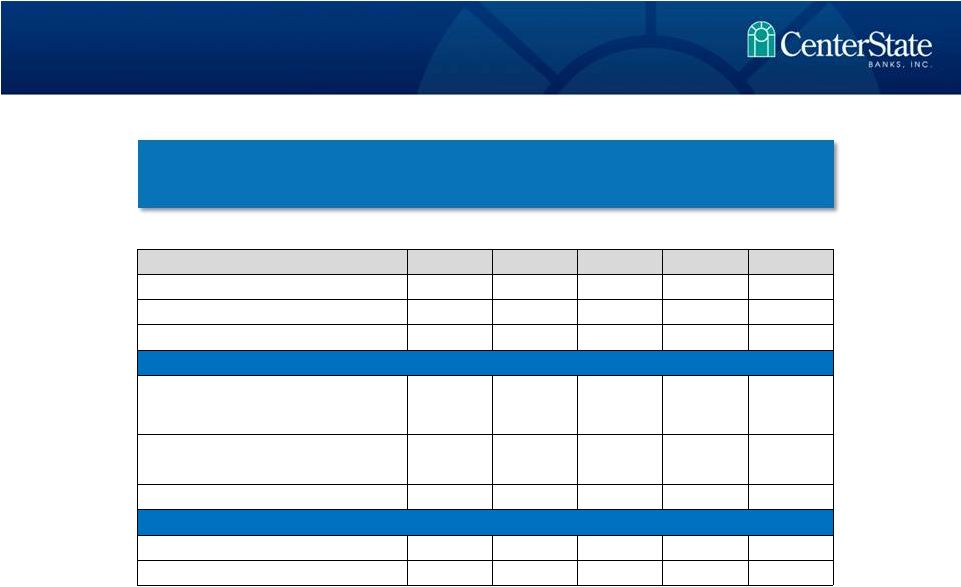
 Total Loans by Type Total Loans Detail 24 Loan Type No. of Loans Balance Avg Loan Balance Residential Real Estate 3,960 $ 428 MM $108,100 CRE-Owner Occupied 718 $ 265 MM $369,100 CRE-Non Owner Occupied 461 $ 203 MM $440,300 Construction, A&D, & Land 460 $ 57 MM $123,900 Commercial & Industrial 1,201 $ 131 MM $109,100 Consumer & All Other 2,652 $ 50 MM $18,900 Total 9,452 $ 1,134 MM $120,000 Total Loan Portfolio as of September 30, 2012 22 Excluding FDIC covered assets Residential Real Estate 38% Comm RE - Owner Occupied 23% Comm RE - Non Owner Occupied 18% Construction, A&D, & Land 5% Commercial & Industrial 12% Consumer / Other 4% |
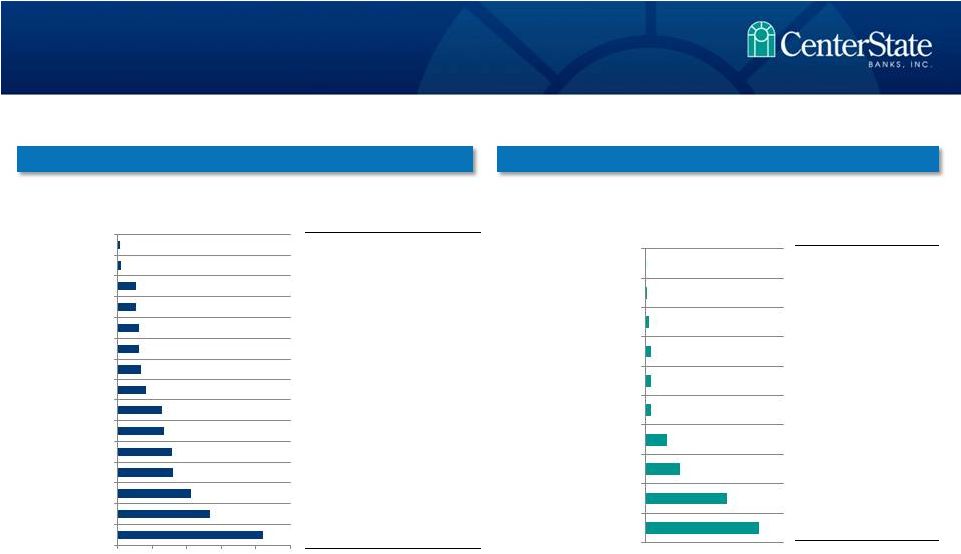 Commercial Real Estate by Type ($MM) Construction Loans by Type ($MM) 25 C&D concentration – 16% vs. 100% • 57% Owner Occupied CRE concentration – 103% vs. 300% % of CRE Loans Avg. Loan Amount ($000) 0.3% $449 0.6% $887 2.8% $553 2.9% $792 3.3% $228 3.3% $433 3.6% $262 4.4% $498 6.8% $517 7.1% $471 8.3% $549 8.6% $581 11.3% $512 14.3% $345 22.4% $298 100.0% $397 % of CDL Loans Avg. Loan Amt ($000) 0.1% $42 0.7% $207 1.4% $403 2.2% $1,237 2.3% $128 2.3% $326 7.8% $403 12.6% $310 29.4% $51 41.1% $297 100.0% $123 CRE Concentrations as of September 30, 2012 23 Excluding FDIC covered assets $0 $25 $50 $75 $100 $125 $105.08 $66.85 $52.78 $40.09 $38.96 $33.46 $32.05 $20.43 $17.02 $15.57 $15.24 $13.46 $13.27 $2.66 $1.35 Office Retail Church/Education Industrial Medical Other CRE Warehouse Strip Center Agriculture Restaurant Res Multi Family Mini Warehouse Mobile Home Park Hotel/Lodging Aviation $23.19 $16.61 $7.14 $4.43 $1.30 $1.28 $1.24 $0.81 $0.41 $0.04 $0 $7 $14 $21 $28 Raw Land - Future Comm Individual Resi Lot Raw Land-Future Resi Developed Land Constr - Other Constr - Single Fam Constr - Church/Edu Constr - Retail Constr - Spec Home Constr - Warehouse |
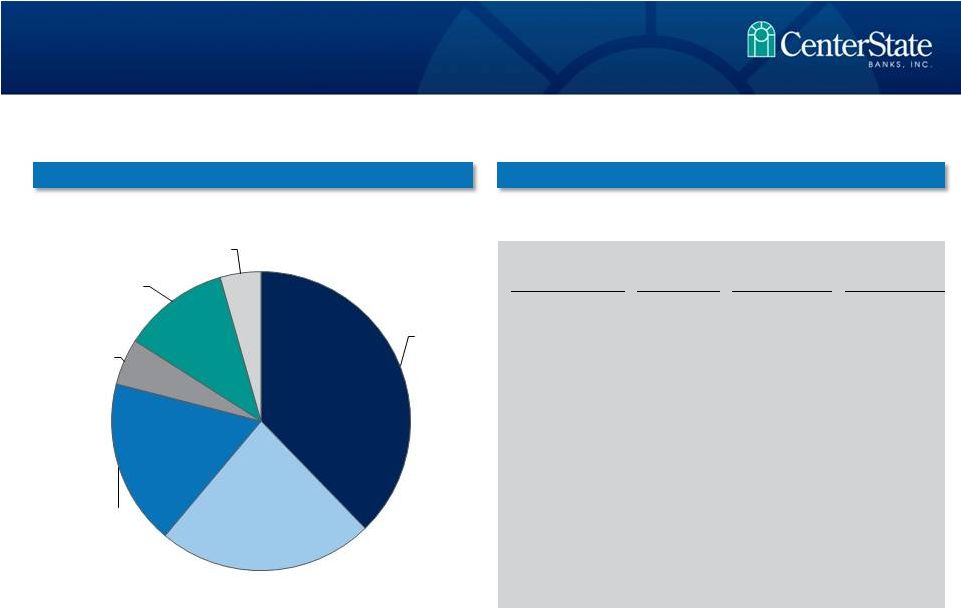
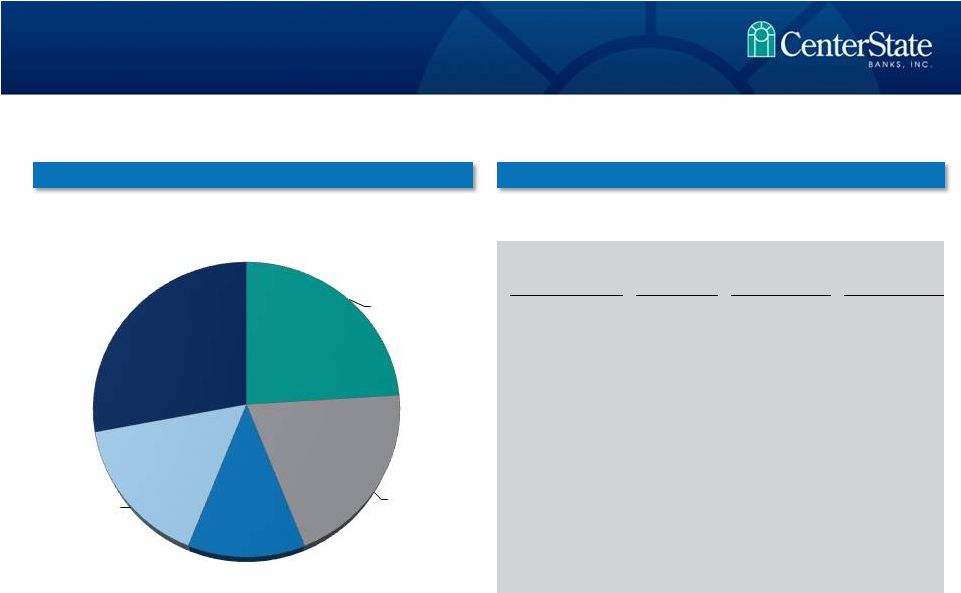 Total Deposits by Type Total Deposits Detail 23 Total Deposit Portfolio 24 Deposit Type No. of Deposits Balance Avg Deposit Balance Demand Deposits 40,915 $ 505 MM $12,300 Now Accounts 44,082 $ 411 MM $9,300 Savings Deposits 18,507 $ 240 MM $13,000 Money Market 3,392 $ 314 MM $92,700 Certificates of Deposits 14,705 $ 528 MM $35,900 Total 121,601 $ 1,998 MM $16,400 Demand Deposits 25% NOW Accounts 21% Savings Accounts 12% Money Market 16% Certificates of Deposits 26% as of September 30, 2012 |
 Total Risk-Based & Tier 1 Leverage 22 • Two successful capital raises in 2009 and 2010 totaling $114 million • First publicly traded bank in Florida to successfully complete a capital raise during financial crisis in 2009 • Over 50 “Blue Chip” active institutional investors – Average daily volume (3m) approximates 45,000 shares • Institutions committed to capitalize additional FDIC accretive transactions Capital 25 19.3 18.9 19.7 19.3 18.0 18.8 18.7 19.1 17.6 17.8 17.6 11.6 11.3 10.9 10.3 10.0 10.1 10.3 10.5 9.0 9.2 9.6 5.00 10.00 15.00 20.00 25.00 1Q10 2Q10 3Q10 4Q10 1Q11 2Q11 3Q11 4Q11 1Q12 2Q12 3Q12 Total Risk-Based Capital Ratio Tier 1 Leverage Ratio |
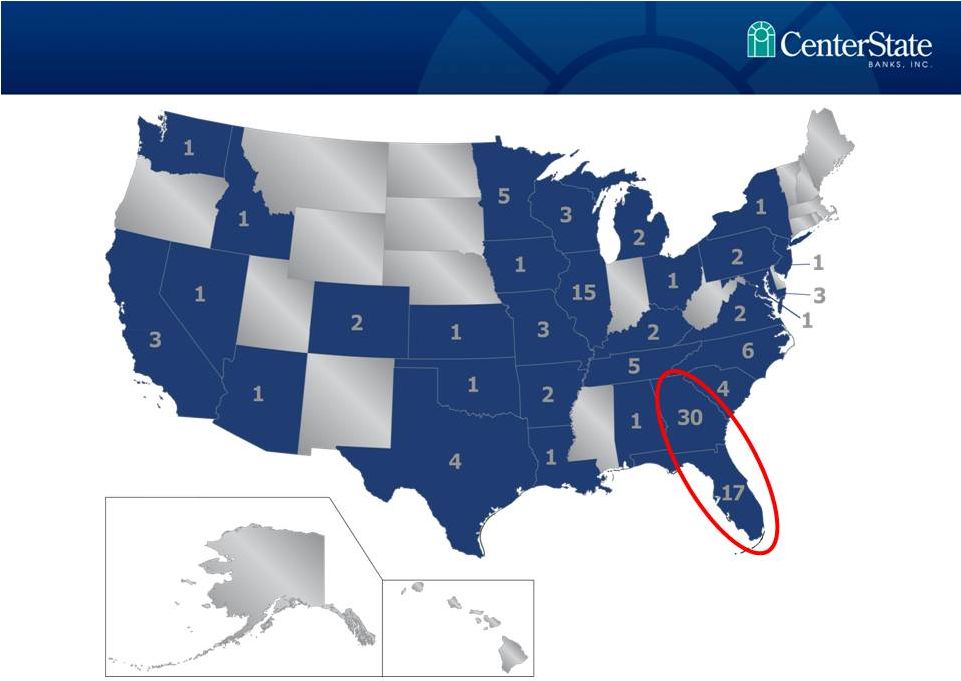
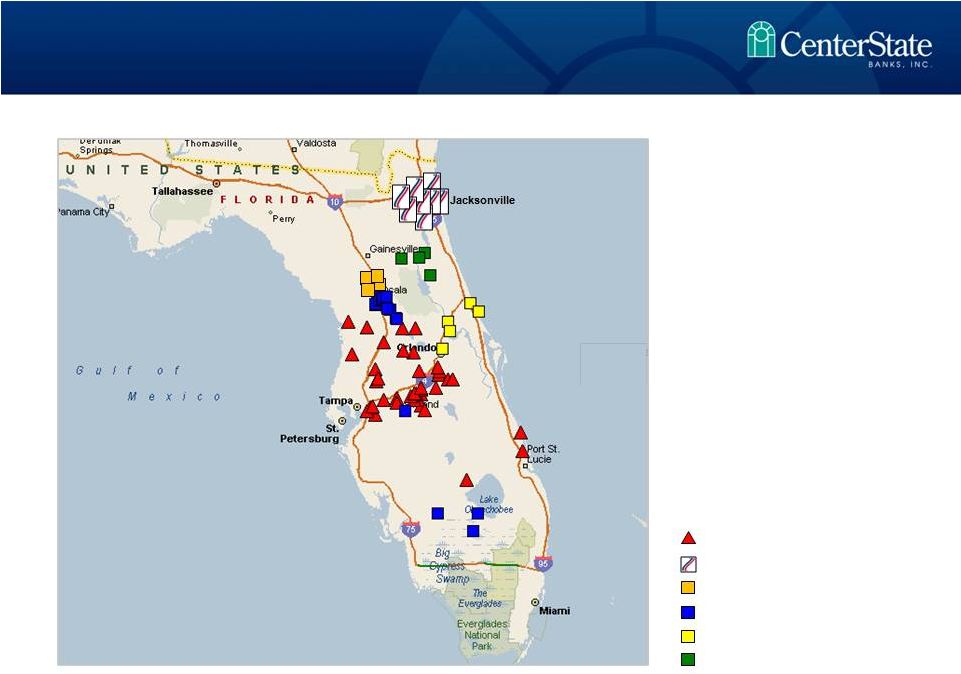 Source: SNL Financial 21 Legacy CSFL Branch First Guaranty Bank (FDIC) Central FL State Bank (FDIC) Three FDIC Acquisitions (3Q 2010) Federal Trust Acquisition (Nov 2011) TD Branch Acquisition (Jan 2011) Recent M&A Transactions 26 |