 The Burton Partnership Annual Meeting March 27, 2013 Ernie Pinner Chairman & CEO CenterState Banks, Inc. Holding Company John Corbett President & CEO CenterState Bank of Florida, N.A. Exhibit 99.1 |
 This presentation contains forward-looking statements, as defined by Federal Securities Laws, relating to present or future trends or factors affecting the operations, markets and products of CenterState Banks, Inc. (CSFL). These statements are provided to assist in the understanding of future financial performance. Any such statements are based on current expectations and involve a number of risks and uncertainties. For a discussion of factors that may cause such forward-looking statements to differ materially from actual results, please refer to CSFL’s most recent Form 10-Q and Form 10-K filed with the Securities Exchange Commission. CSFL undertakes no obligation to release revisions to these forward-looking statements or reflect events or circumstances after the date of this presentation. Forward Looking Statement 2 2 |
 Company Overview |
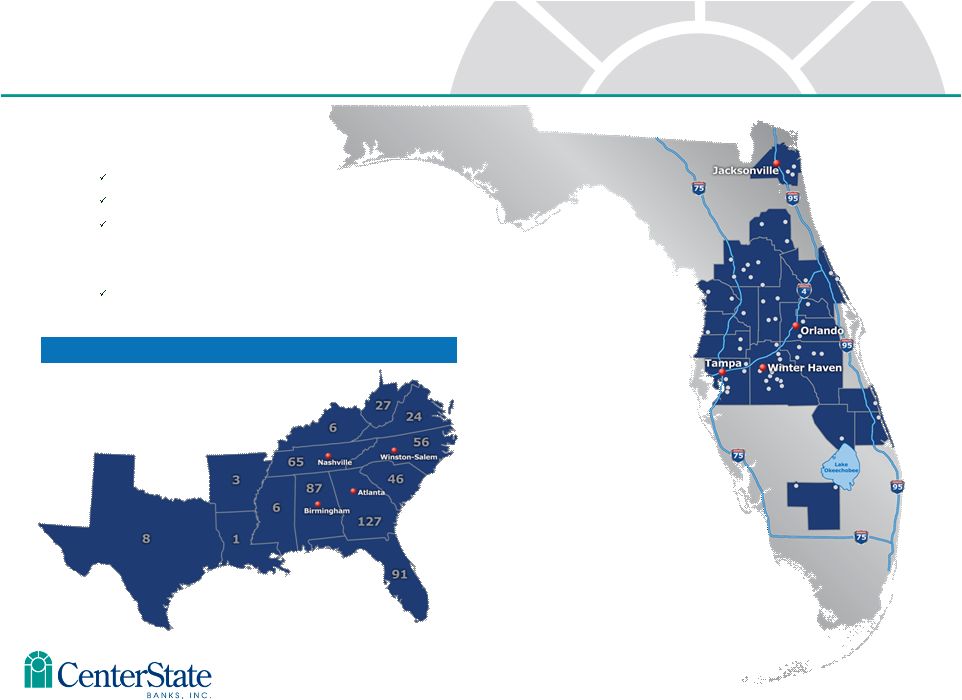 Correspondent Banking Market Data as of 12/31/12 • Headquartered in Davenport, FL $2.4 billion in assets $1.4 billion in loans $2.0 billion in deposits • Company formed: June 2000 1 Subsidiary Bank Corporate Overview 4 |
 • CAPITAL - Total Risk-Based Capital Ratio – 17.9% • LIQUIDITY - Loans / Assets - 61% • LOANS WITH THIRD PARTY PROTECTION – 25% 21% of loans are covered by loss sharing agreements with the FDIC 4% subject to “Put Back” agreement with TD Bank ending January 20, 2013 • ASSETS WITH THIRD PARTY PROTECTION – 36% * 36% - Backed by the United States 2% - subject to “Put Back” agreement with TD Bank ending January 20, 2013 • LOW CONCENTRATION LEVELS ** CRE at 107% of capital vs. 300% guidance CD&L at 14% of capital vs. 100% guidance * Includes cash and cash equivalents, AFS securities issued by U.S. Government Sponsored Entities, FDIC covered assets, and FHLB and FRB stock. **Excludes FDIC covered loans Conservative Balance Sheet as of December 31, 2012 5 TCE Ratio – 9.6% |
 Ocala National Bank Olde Cypress Community Bank Independent National Bank of Ocala Community National Bank of Bartow Central Florida State Bank First Guaranty Bank & Trust Co. TD Bank divesture in Putnam Federal Trust Acquisition from The Hartford Insurance Company Opportunistic through the Crisis Non – FDIC Acquisitions FDIC Acquisitions New Fee-Based Business Lines Strategic Expansion & Management Lift-Outs Correspondent Banking Division Prepaid Card Division Wealth Management Division Trust Department Vero Beach Okeechobee Jacksonville 6 |
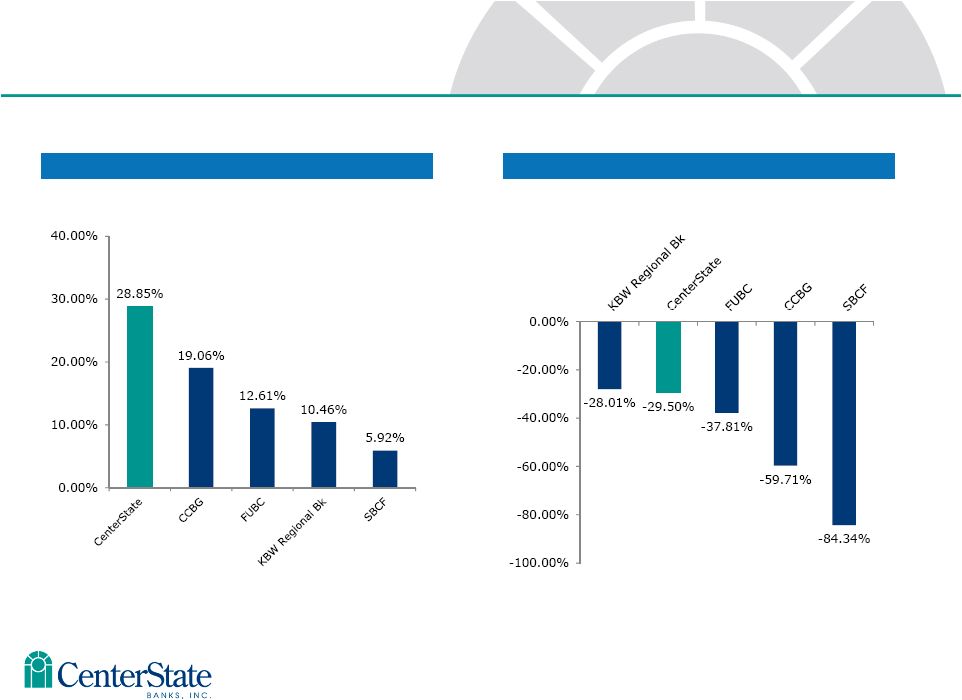 7 One Year - 2012 Five Year - 2007 to 1012 Price Change % |
 Florida is on the Mend |
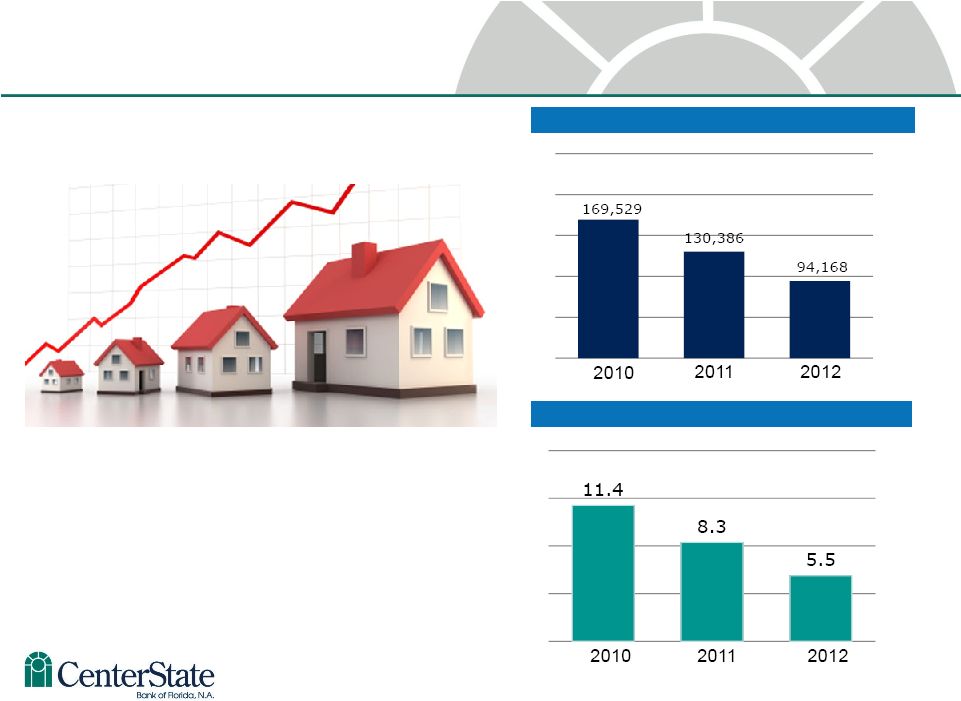 Housing is now a Tailwind 9 Single Family Inventory Months Supply of Inventory • Median single family home prices are up 14% from last year • Pending home sales are up 31% from last year • Median days on the market are down 17% from last year Source: Florida Realtors Yearly and Monthly Market Detail – December 2012 Single Family Homes |
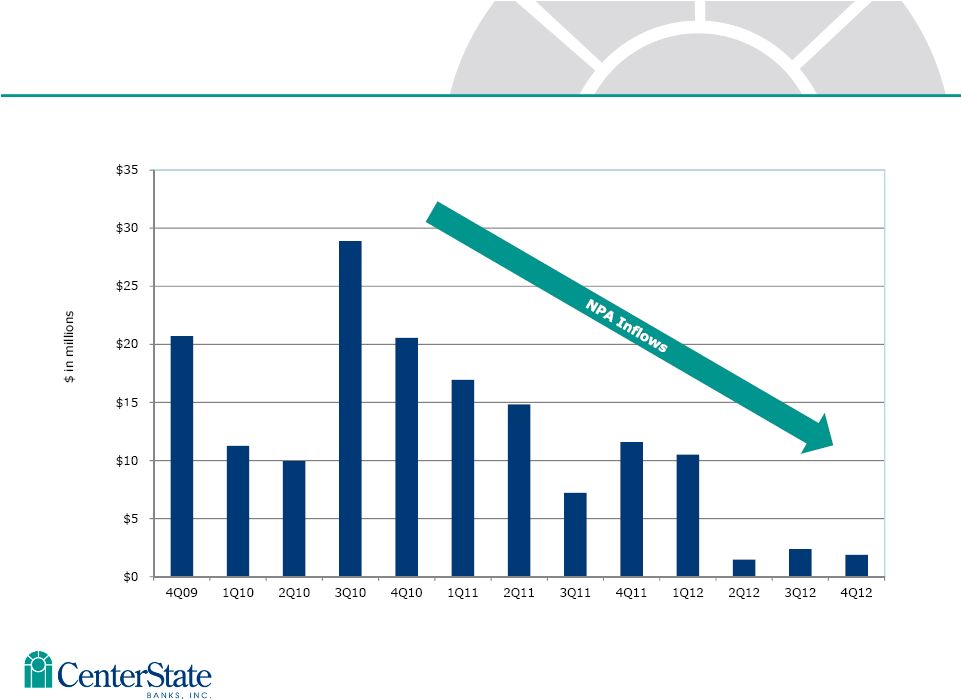 NPA Inflows – Slowing Down 10 Excluding FDIC covered assets |
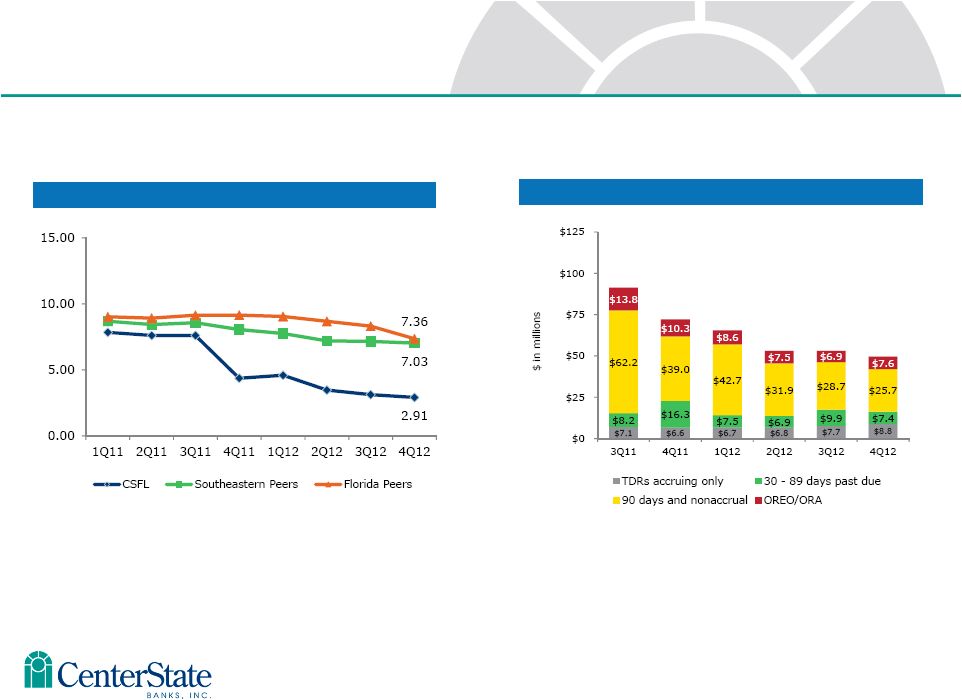 NPAs / Loans & OREO (%) Problem Loan Trends Source: SNL Financial and Company filings. Peer information updated quarterly Nonperforming assets include 90 days or more past due. Southeastern peers include ABCB, BTFG, PNFP, RNST, SCBT, UBSH and UCBI. Florida peers include all banks headquartered in Florida , opened no later than 12/31/2005 and total assets between $500 million and $5 billion. 14 Credit Quality Trends - Improving 11 |
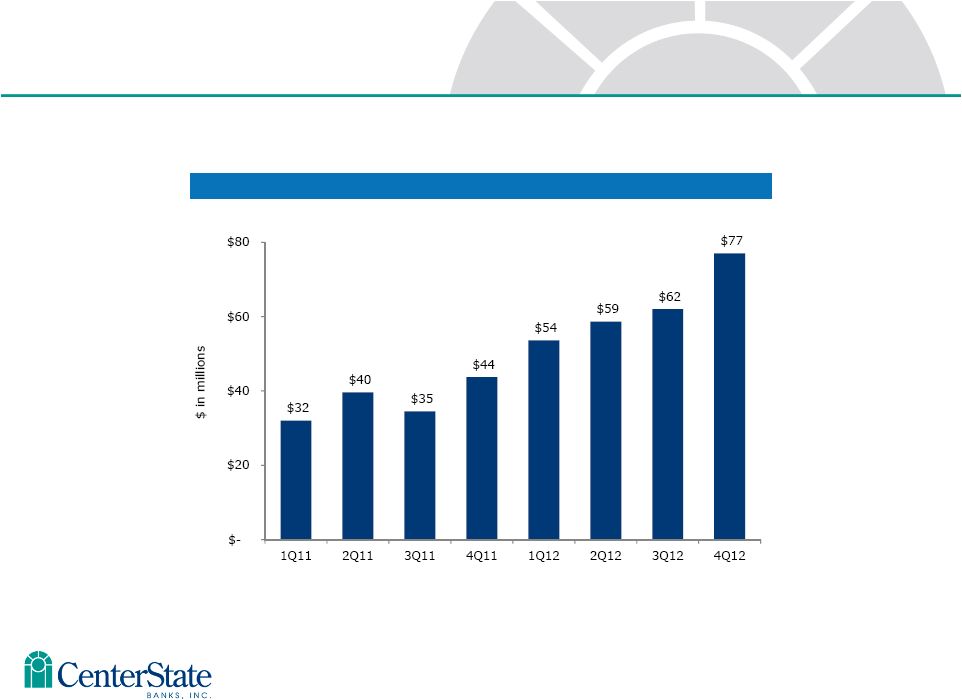 New Loan Production Loan Trends as of December 31, 2012 12 Excluding FDIC covered assets |
 Core Earnings on the Rise |
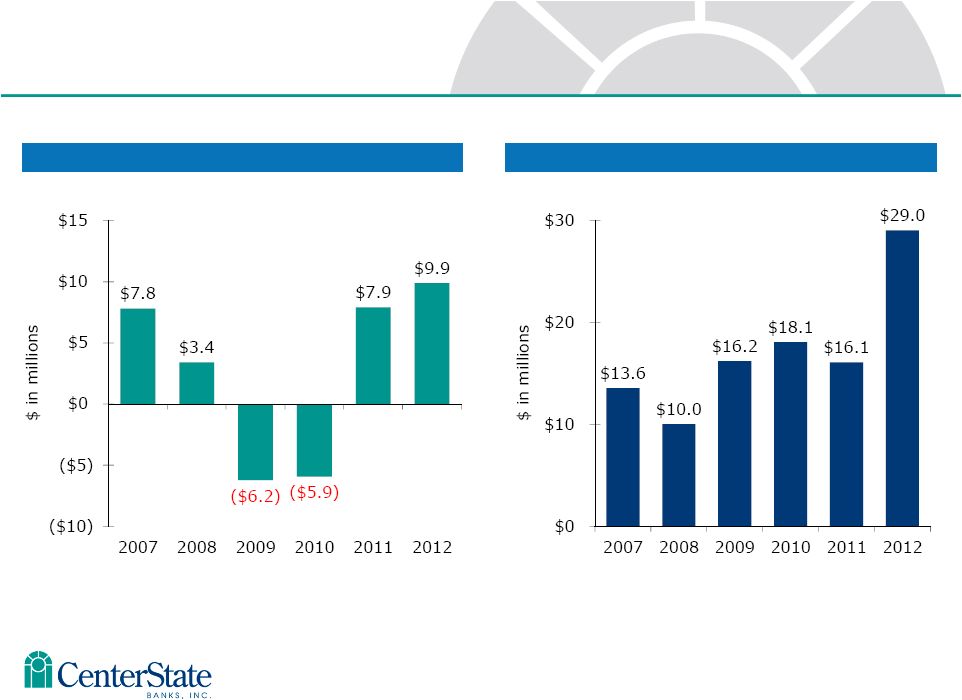 Net Income 1. Pre-tax pre-provision income (“PTPP”) is a non-GAAP measure that if defined as income (loss) before income tax excluding provision for loan losses, gain on sale of available for sale securities, income from FDIC loan pool impairment, OREO indemnification income from FDIC, other credit related costs including losses on repossessed real estate and other assets, other foreclosure related expenses., and non-recurring items. Profitability Metrics 14 Pre-Tax Pre-Provision Income¹ |
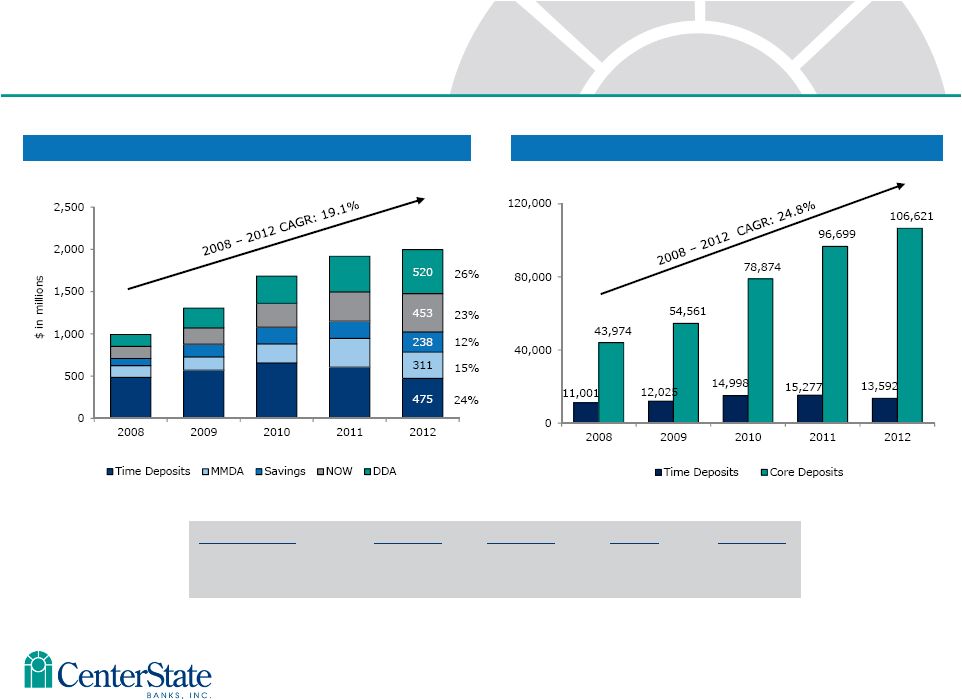 • Value of core deposits not fully realized in this low rate environment. • Approximately 120,213 total accounts - $16,614 average balance per account Core deposits defined as non-time deposits. Total Deposits Number of Deposit Accounts 9 DDA and NOW 12/31/11 12/31/12 Change % Change Balance $767MM $972MM $205MM 27% No. of Accounts 74,528 85,070 10,542 14% Building Franchise Value with Core Deposits 15 |
 11 Branch Consolidation – 15 ( 11 FDIC / 4 Legacy) Reduction in Force - 85 Data Processing Conversions – Complete July 2012 Merger of Subsidiaries – Complete June 2012 Focus on Efficiency and Core Earnings - 2012 16 |
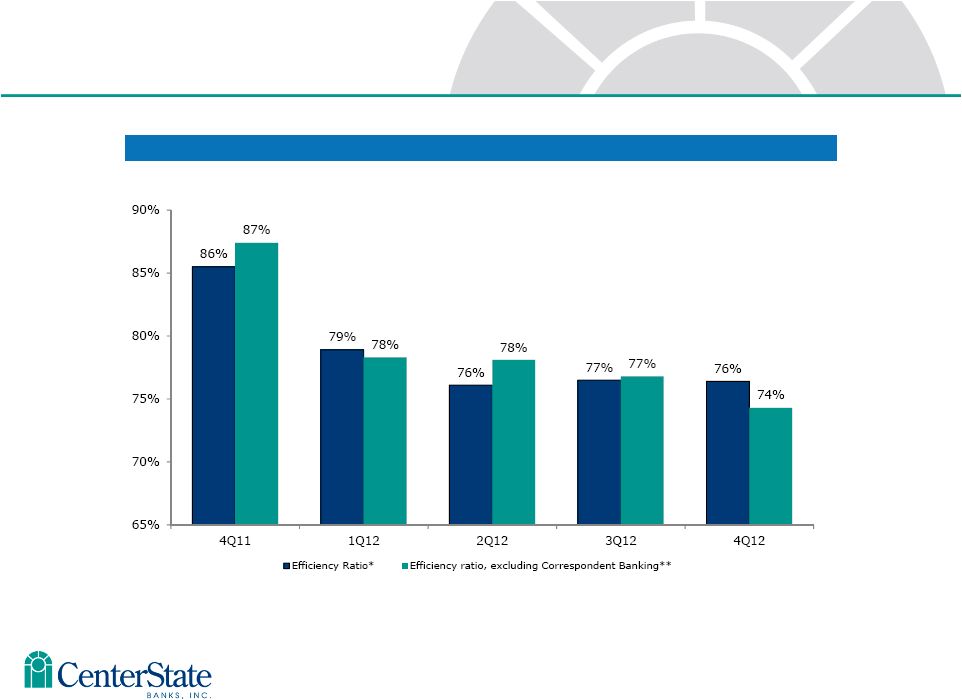 10 Efficiency Ratio Operating Efficiencies * Efficiency Ratio is defined as follows: [non-interest expense – intangible amortization – credit related expenses – merger related expenses – other nonrecurring expense] / [net interest income (fully tax equivalent) + non-interest income – gain on sale of AFS securities – FDIC indemnification revenue – nonrecurring income] **Efficiency Ratio, excluding Correspondent Banking is defined as follows: [non-interest expense – Correspondent Banking non- interest expense – intangible amortization – credit related expenses – merger related expenses – other nonrecurring expense] / [net interest income (fully tax equivalent) – Correspondent Banking net interest income + non-interest income – Correspondent Banking non-interest income – gain on sale of AFS securities – FDIC indemnification revenue – nonrecurring income] 17 |
 Banking Consolidation |
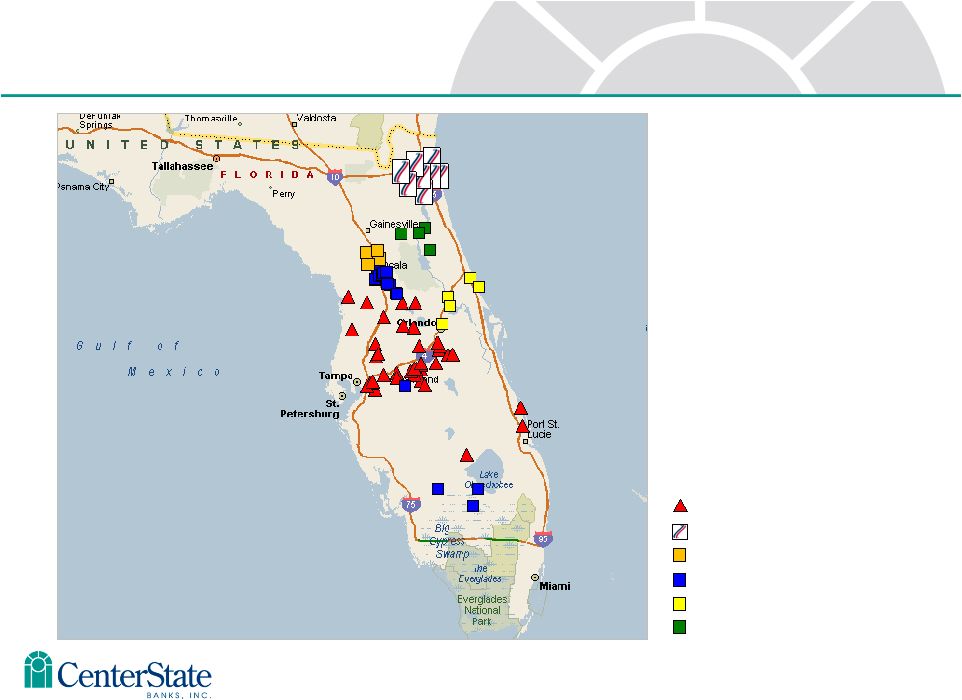 Source: SNL Financial Legacy CSFL Branch First Guaranty Bank (FDIC) Central FL State Bank (FDIC) Three FDIC Acquisitions (3Q 2010) Federal Trust Acquisition (Nov 2011) TD Branch Acquisition (Jan 2011) Jacksonville Recent M&A Transactions 19 |
 17 42% Source: SNL Financial Data as of 12/31/12 or MRQ Banks with Texas Ratio over 200% 20 |
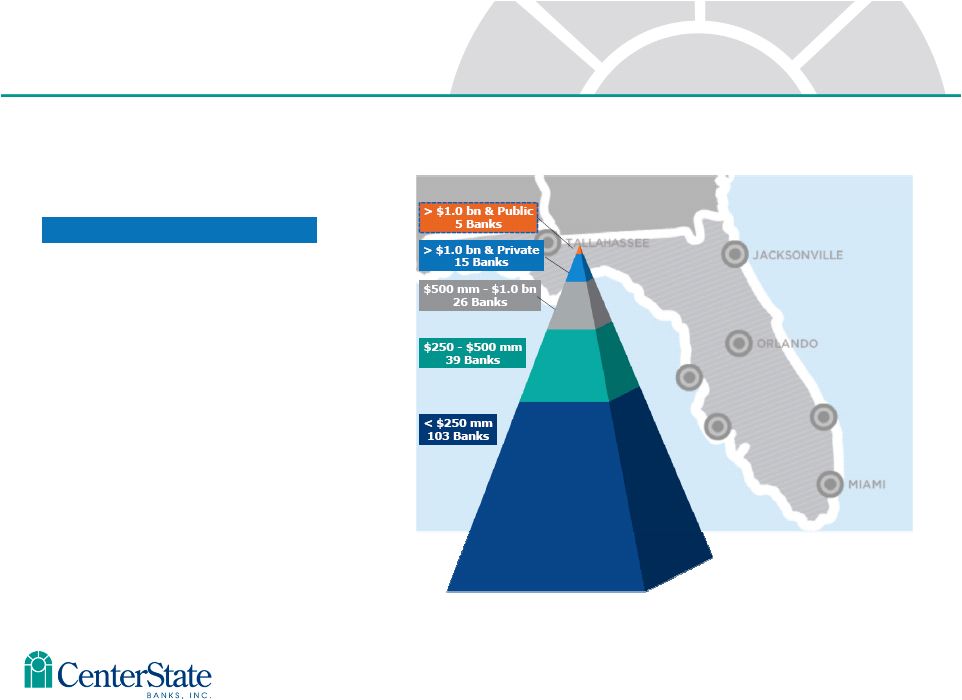 18 CSFL Advantages • CSFL is one of only five major exchange traded banks headquartered in FL with assets between $1 billion and $10 billion • Proven experience through 8 successful acquisitions in the past 3 years • Disproportionate number of sellers versus very few buyers • The number of small, distressed Florida institutions remains high CSFL – Best Positioned Florida Consolidator Source: SNL Financial Data as of MRQ available 21 |
 • Lifetime local bankers with common lineage • Florida economy improving • CSFL metrics improving with better performance anticipated • Best positioned consolidator in the state Summary 22 |
 Appendix |
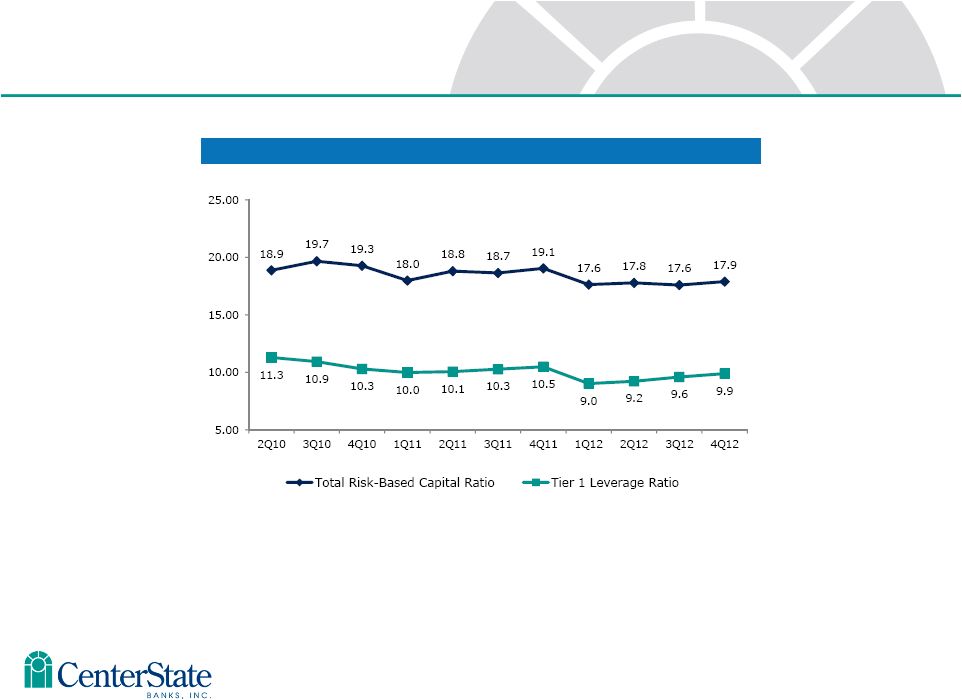 Total Risk-Based & Tier 1 Leverage 22 • Two successful capital raises in 2009 and 2010 totaling $114 million • First publicly traded bank in Florida to successfully complete a capital raise during financial crisis in 2009 • Over 50 “Blue Chip” active institutional investors – Average daily volume (3m) approximates 46,000 shares • Institutions committed to capitalize additional FDIC accretive transactions Capital 24 |
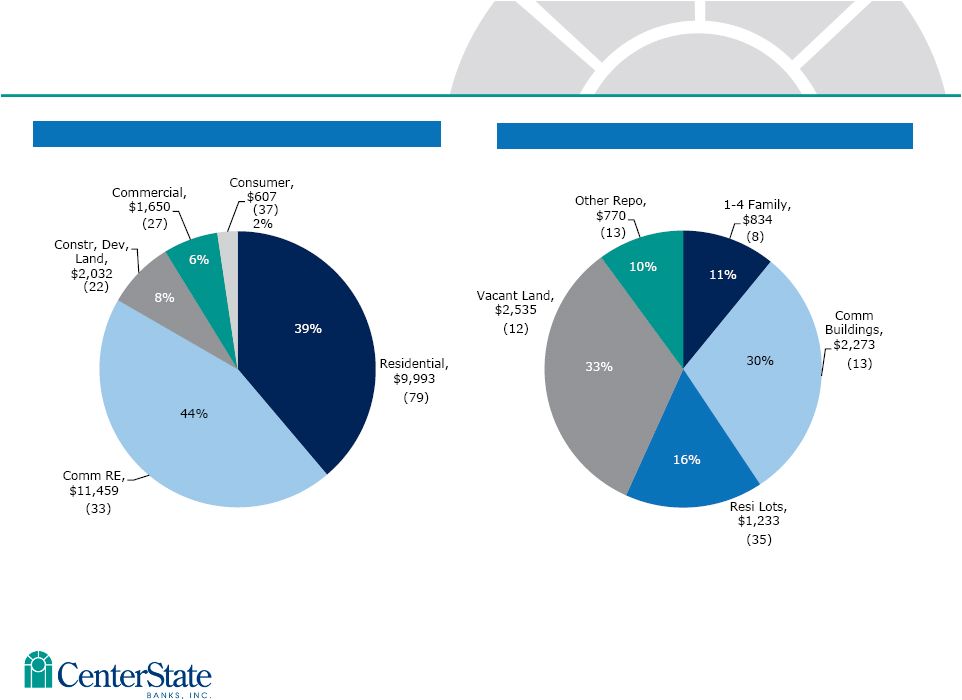
 Total Loans by Type Total Loans Detail Loan Type No. of Loans Balance Avg Loan Balance Residential Real Estate 4,021 $ 429 MM $106,700 CRE-Owner Occupied 721 $ 264 MM $366,200 CRE-Non Owner Occupied 477 $ 216 MM $452,800 Construction, A&D, & Land 434 $ 56 MM $129,000 Commercial & Industrial 1,205 $ 124 MM $102,900 Consumer & All Other 2,774 $ 51 MM $18,400 Total 9,632 $ 1,140 MM $118,400 Total Loan Portfolio as of December 31, 2012 25 Excluding FDIC covered assets |
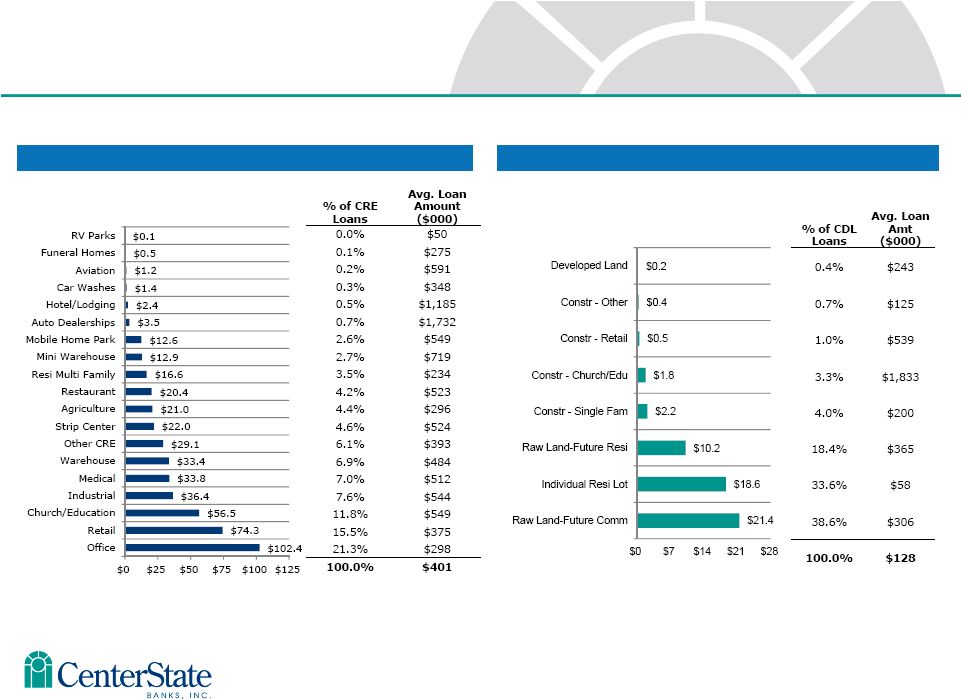 Commercial Real Estate by Type ($MM) Construction Loans by Type ($MM) 25 C&D concentration – 14% vs. 100% • 55% Owner Occupied CRE concentration – 107% vs. 300% CRE Concentrations as of December 31, 2012 Excluding FDIC covered assets 26 |
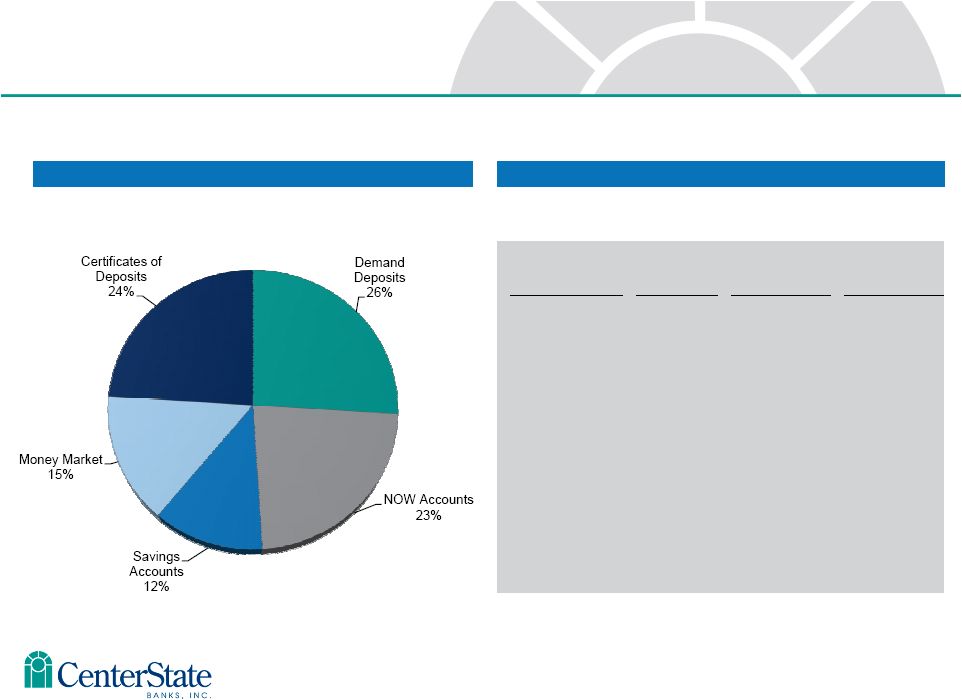 Total Deposits by Type Total Deposits Detail 23 Total Deposit Portfolio as of December 31, 2012 Deposit Type No. of Deposits Balance Avg Deposit Balance Demand Deposits 37,741 $ 520 MM $13,800 Now Accounts 47,329 $ 453 MM $9,600 Savings Deposits 18,217 $ 238 MM $13,000 Money Market 3,334 $ 311 MM $93,400 Certificates of Deposits 13,592 $ 475 MM $35,000 Total 120,213 $ 1,997 MM $16,600 27 |
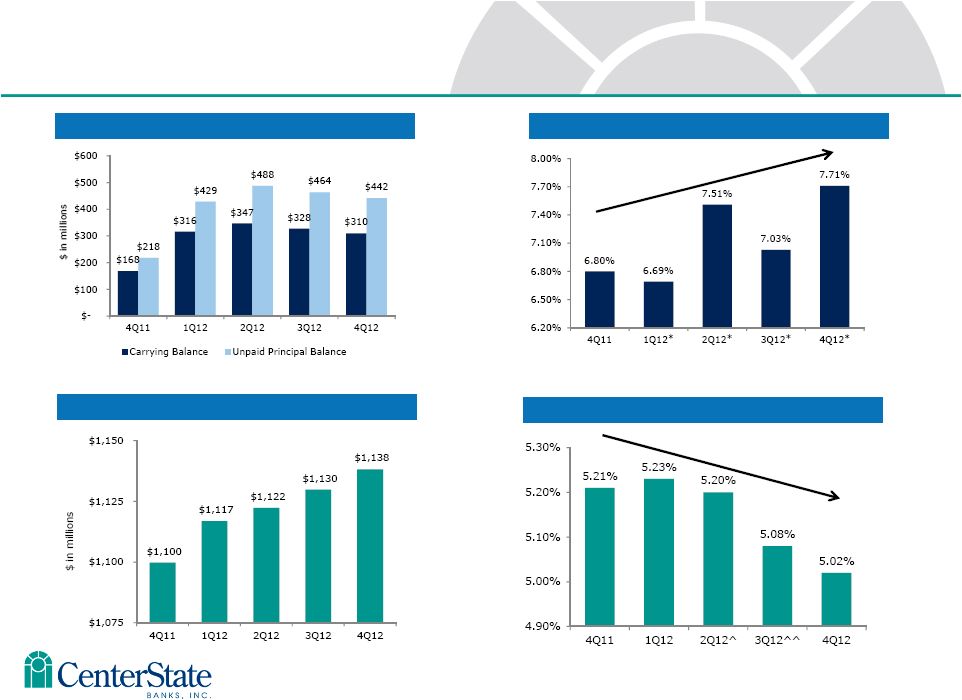 Covered Loans - Average Yields Covered Loans – Average Balances Non-Covered Loans – Average Balance Loans – Yields and Averages Non-Covered Loans – Average Yields * Adjusted for measurement period adjustment. ^ Adjusted for non-accrual loan upgrades ^^ Adjusted for excess cash flows relating to one noncovered loan pool and a put back loan adjustment 28 |
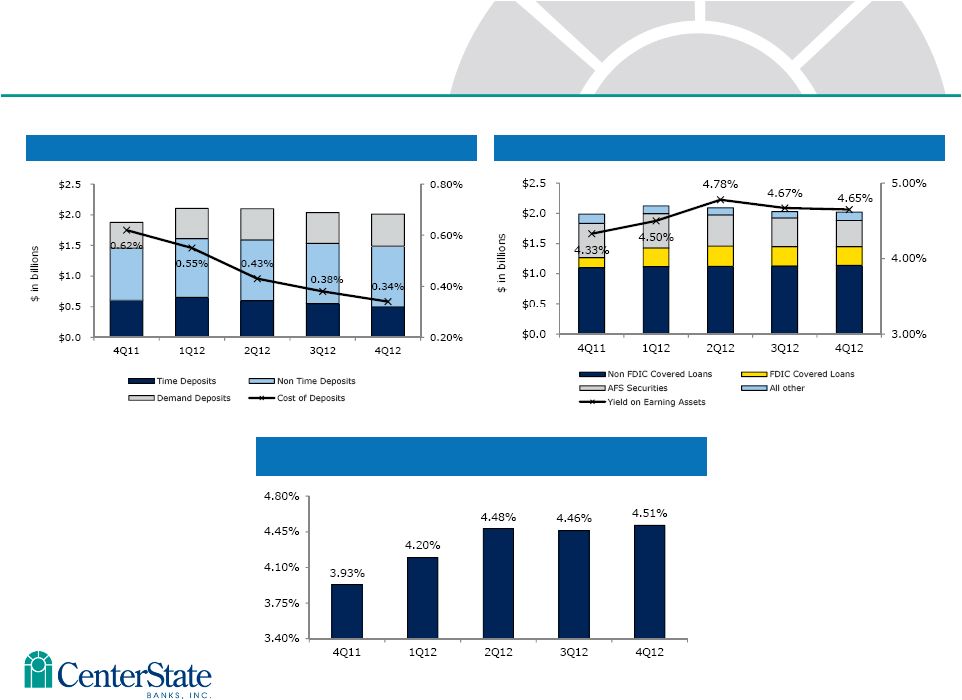 8 Costs of Deposits Yield on Interest Earning Assets Net Interest Margin (excluding Correspondent Division) Net Interest Margin 29 |
 30 ($ in thousands) 4Q11 1Q12 2Q12 3Q12 4Q12 Average FDIC covered loans $167,512 $316,421 $347,191 $327,847 $309,502 Interest accretion $2,873 $5,265 $6,480 $5,796 $6,001 Yield 6.80% 6.69% 7.51% 7.03% 7.71% IA accretion (amortization) included in non interest income ($699) ($537) ($348) ($671) ($1,540) Interest accretion less IA amortization $2,174 $4,728 $6,132 $5,125 $4,461 Yield, including IA amortization 5.15% 6.01% 7.10% 6.22% 5.73% Average IA balance $52,231 $92,384 $133,503 $127,376 $120,580 Yield, including IA balances 3.93% 4.65% 5.13% 4.48% 4.13% Indemnification Asset (“IA”) amortization and its effect on FDIC covered loan interest accretion IA – negative accretion 30 |
 Non-Performing Loans ($M) • $7,645M • OREO & Repos are carried at 42% of Unpaid Principal Balance Data as of 6/30/12 OREO & Repo ($M) • $25,741M (2.26% of Gross Loans) • NPLs are carried at 77% of Unpaid Principal Balance • Current NPLs at 36% NPA Breakout as of December 31, 2012 31 Excluding FDIC covered assets |
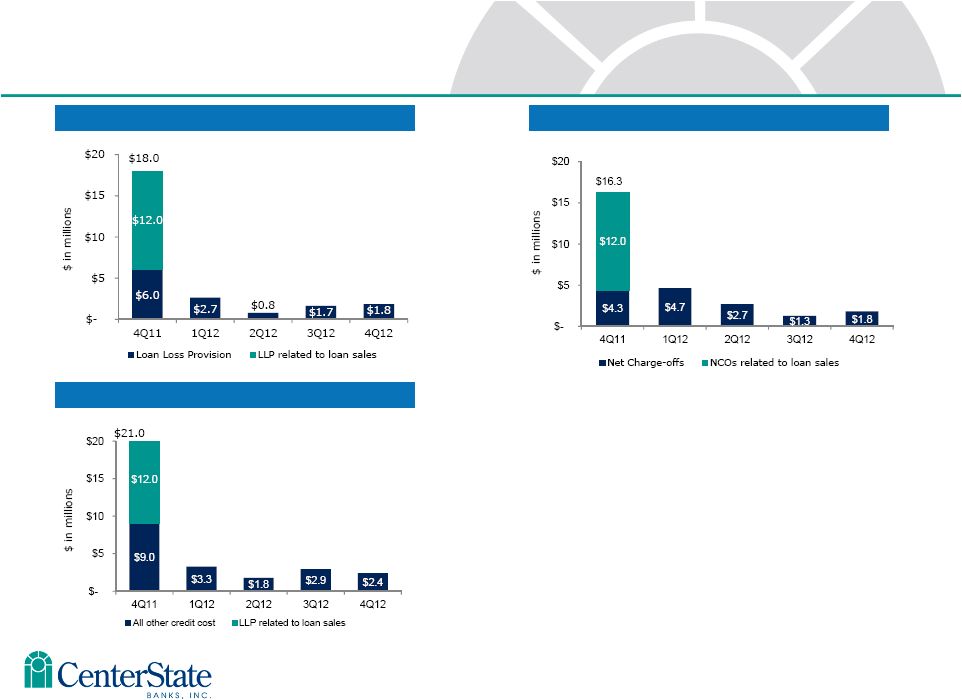 Net Charge-Offs (NCOs) Loan Loss Provision (LLP) Excludes FDIC covered loans Total Credit Costs • Provision expense trending downward • Net charge-offs trending downward • Total credit cost trending downward Credit Cost 32 |