 KBW Southeast Bank Conference December 6, 2013 Exhibit 99.1 |
 This presentation contains forward-looking statements, as defined by Federal Securities Laws, relating to present or future trends or factors affecting the operations, markets and products of CenterState Banks, Inc. (CSFL). These statements are provided to assist in the understanding of future financial performance. Any such statements are based on current expectations and involve a number of risks and uncertainties. For a discussion of factors that may cause such forward-looking statements to differ materially from actual results, please refer to CSFL’s most recent Form 10-Q and Form 10-K filed with the Securities Exchange Commission. CSFL undertakes no obligation to release revisions to these forward-looking statements or reflect events or circumstances after the date of this presentation. Forward Looking Statement 2 2 |
 Company Overview |
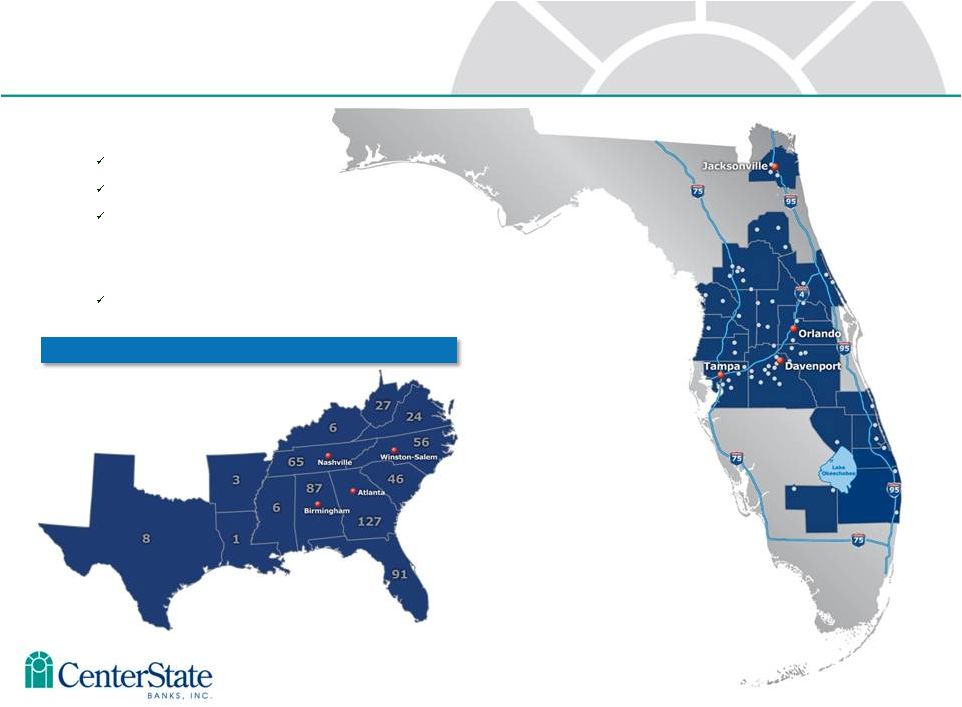 Correspondent Banking Market • Headquartered in Davenport, FL $2.3 billion in assets $1.5 billion in loans $2.0 billion in deposits • Company formed: June 2000 1 Subsidiary Bank Corporate Overview 4 Data as of 9/30/13 |
 Ocala National Bank Olde Cypress Community Bank Independent National Bank of Ocala Community National Bank of Bartow Central Florida State Bank First Guaranty Bank & Trust Co. Federal Trust Acquisition from The Hartford Insurance Company TD Bank divesture in Putnam Gulfstream Business Bank in Stuart Opportunistic through the Crisis Non – FDIC Acquisitions FDIC Acquisitions New Fee-Based Business Lines Strategic Expansion & Management Lift-Outs Correspondent Banking Division Prepaid Card Division Wealth Management Division Trust Department Vero Beach Okeechobee Jacksonville 5 |
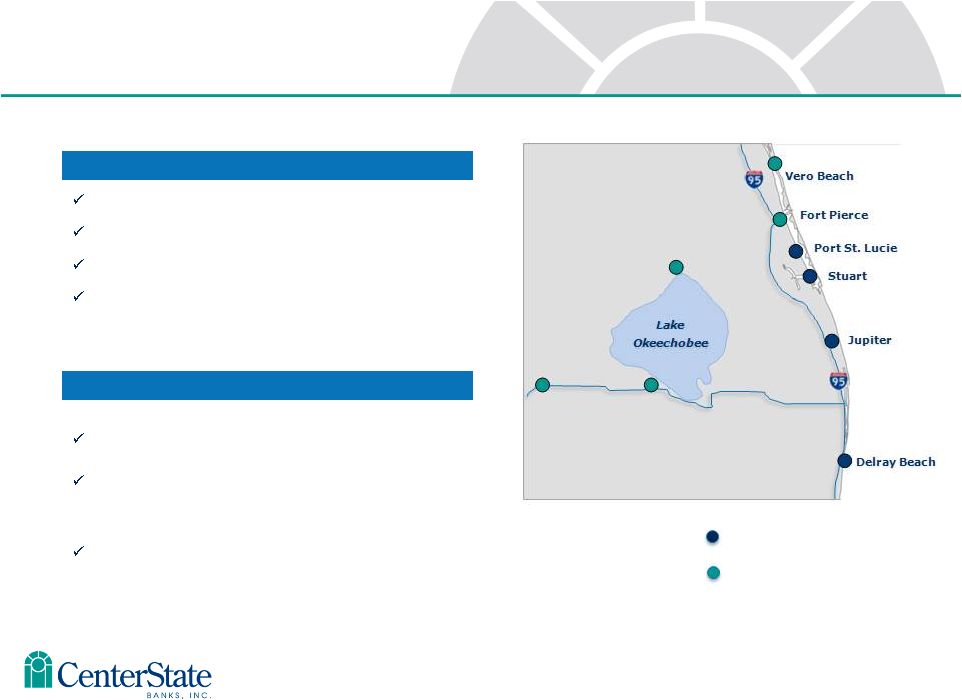 Logical Extension of Existing Treasure Coast Presence Offices: 59 Assets: $2.9 billion Deposits: $2.5 billion Loans: $1.8 billion (1) Financial data as of 6-30-13 6 Update on Transaction Transaction announced on July 30, 2013 Merger received approval from both Boards, FRB, and OCC Anticipate closing and conversion in first quarter 2014 CSFL (55 branches) Gulfstream (4 branches) Pro Forma Highlights(1) |
 Gulfstream Bank Highlights Founded – 1999 Total Assets – $572 million Gross Loans – $368 million Total Deposits – $486 million Earnings Predictable core earnings 12 year average efficiency ratio of 52% ROAA of 0.73% in 2012 Branches – 4 Headquarters in Stuart, FL Branches in Port St. Lucie, Jupiter & Delray Beach Employees – 81 Stable leadership that has worked together locally beginning at Barnett Banks Top 5 market leaders have 20 to 36 years each of in-market banking experience Top 5 market leaders have signed non-compete agreements Niche Business Banking Focus Professional Practices Operating Companies Home Owners Associations Affluent Investors Data as of June 30, 2013 Source: Management and SNL 7 |
 Financial Impact (1)(2)(3) COST SAVINGS OF 22%, $2.6 MILLION 75% realized in 2014 100% realized in 2015 ONE-TIME MERGER RELATED EXPENSES $5.3 million (After-tax) NO REVENUE SYNERGIES MODELED CDI - 1.00%, amortized over 10 years 150% DDB GROSS CREDIT MARK 5%, $18.6 MILLION STRONG DOUBLE-DIGIT EPS ACCRETION 2014 Core EPS accretion % - High teens 2015 and thereafter EPS accretion % - Low teens TBV DILUTION % - mid-single digits at close TBV EARNBACK - 3.5 to 4 years IRR >20% Modeling Assumptions Pro Forma Capital Ratios at Close TCE ratio - 8.7% Leverage ratio - 9.5% Total risk-based ratio - 16.4% Valuation Multiples Price to 2013 Estimated Earnings - 16x Price to TBV Per Share - 143% 8 (1) Based on CSFL 20 day closing VWAP of $9.38 ended July 26, 2013 (2) Based on 1.722 million Gulfstream common shares outstanding (3) Includes economic value of option roll of $3.0 million SBLF REDEEMED AT PAR AT CLOSING |
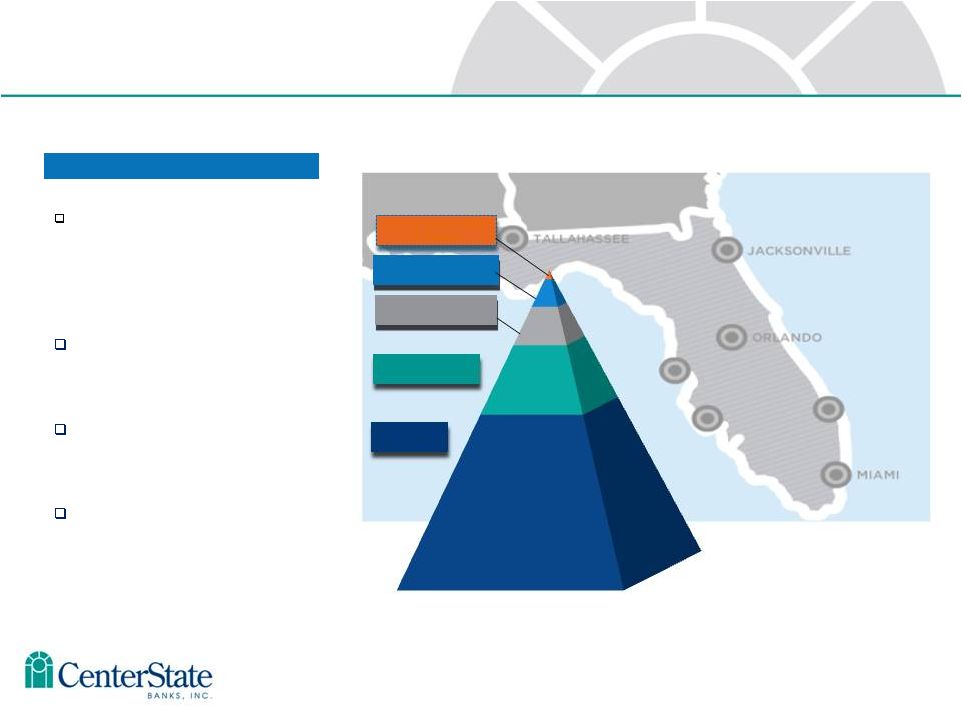 18 CSFL Advantages CSFL is one of only five major exchange traded banks headquartered in FL with assets between $1 billion and $10 billion Proven experience through 8 successful acquisitions in the past 3 years Disproportionate number of sellers versus very few buyers The number of small, distressed Florida institutions remains high CSFL – Best Positioned Florida Consolidator Source: SNL Financial Data as of MRQ available 9 < $250 mm 96 Banks $250 - 38 Banks $500 mm - 21 Banks > $1.0 bn & Private 15 Banks > $1.0 bn & Public 5 Banks $500 mm $1.0 bn |
 3 rd Quarter Financial Summary |
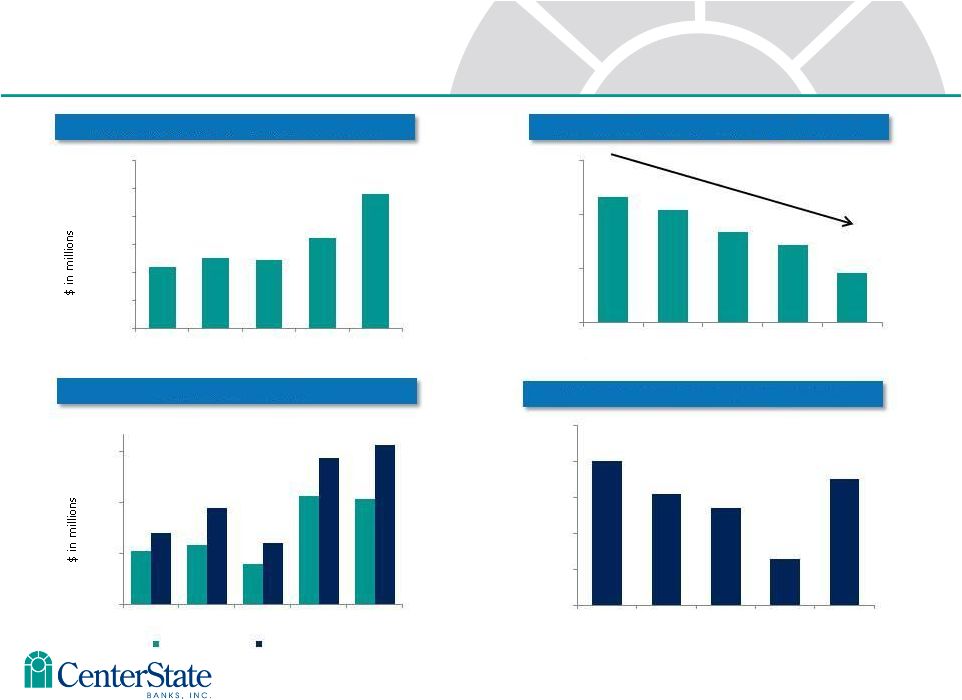
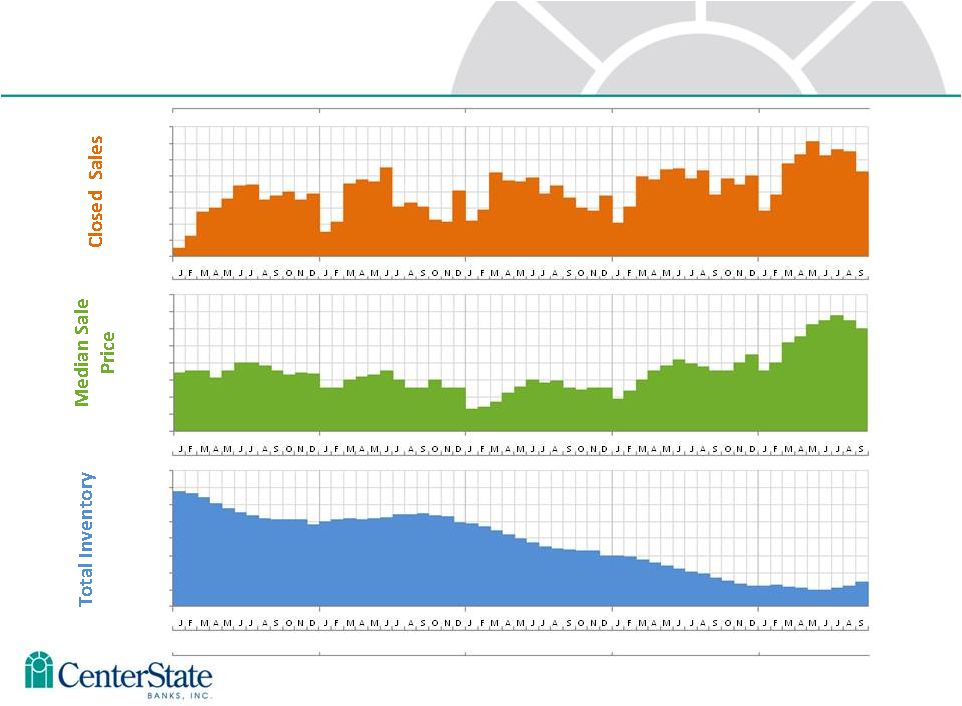 11 Source: Florida Realtors Monthly Market Detail (September 2013) – Single Family Homes Florida Real Estate – Single Family Homes 11 24,000 22,000 20,000 18,000 16,000 14,000 12,000 10,000 8,000 $190K $180K $170K $160K $150K $140K $130K $120K $110K 230,000 210,000 190,000 170,000 150,000 130,000 110,000 900,000 70,000 2009 2010 2011 2012 2013 2009 2010 2011 2012 2013 |
 12 Non-Covered Loan Growth Loan Production by Quarter • Current Qtr annualized growth 12.5% • YTD annualized growth 8.9% • Avg yld funded loans 4.35% • 41% CRE • 27% Resi • 24% C&I • 8% all other • Loan pipeline: Current: $124M End of 2Q13: $150M End of 1Q13: $175M End of 4Q12: $110M Current Quarter Loan Production $52 $55 $44 $84 $82 $62 $77 $56 $106 $114 $20 $50 $80 $110 3Q12 4Q12 1Q13 2Q13 3Q13 Funded Loans Total Loan Production |
 13 3 rd Quarter Summary of Financial Results 3Q 2013 2Q 2013 EPS $0.10 $0.09 • Lower loan loss provision ($1,273) vs. $1,374 • Higher IA amortization • Lower bond sales • Loan growth • Resilient NIM • 4.96% vs. 4.59% (4.82%) vs. (4.38%) • Covered loan performance • Potential future ALLL release • Valuable core deposit franchise • Credit metrics continue to improve Current Qtr take-aways |
 Earnings |
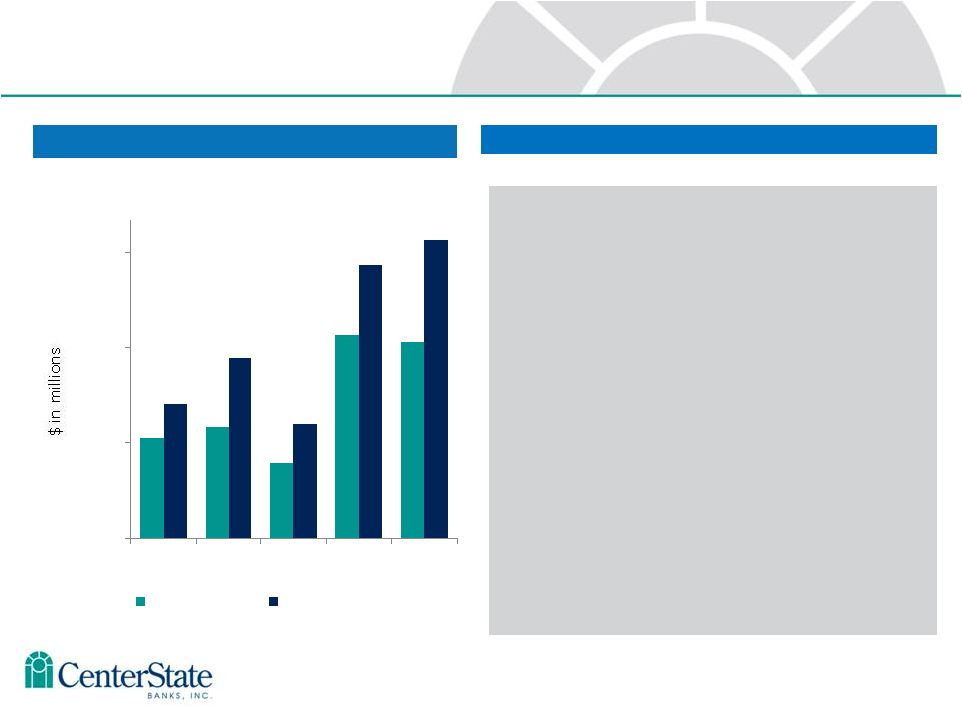
 Net Income 1. Pre-tax pre-provision income (“PTPP”) is a non-GAAP measure that is defined as income (loss) before income tax excluding provision for loan losses, gain on sale of available for sale securities, income from FDIC loan pool impairment, OREO indemnification income from FDIC, other credit related costs including losses on repossessed real estate and other assets, other foreclosure related expenses., and non-recurring items. Profitability Metrics – 6 Years 15 Pre-Tax Pre-Provision Income 1 |
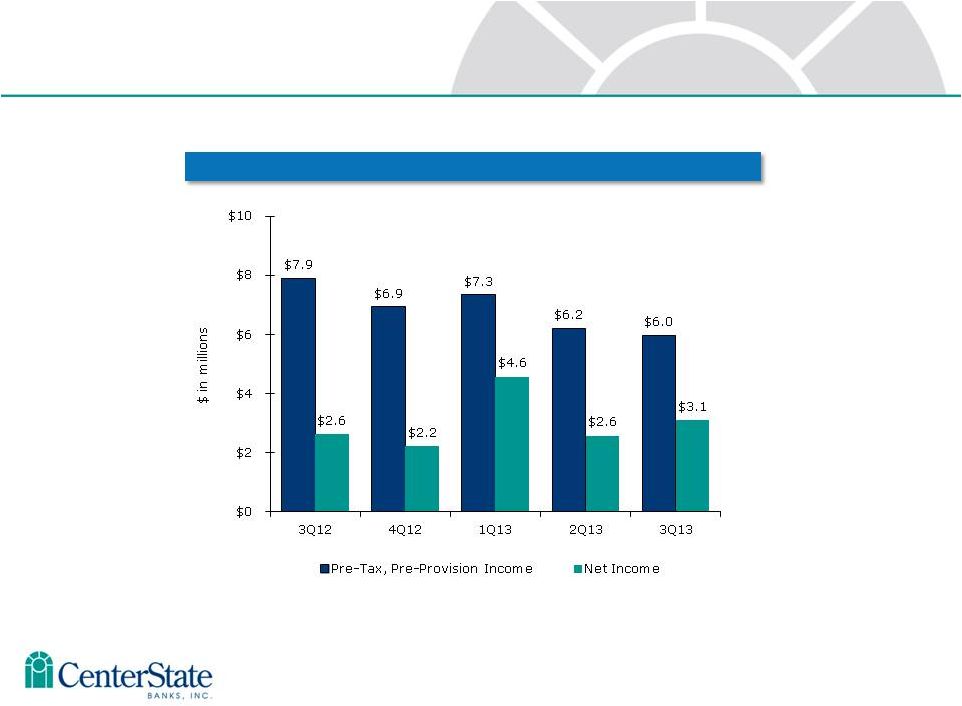 16 Profitability Metrics – 5 Quarters 1. Pre-tax pre-provision income (“PTPP”) is a non-GAAP measure that is defined as income (loss) before income tax excluding provision for loan losses, gain on sale of available for sale securities, income from FDIC loan pool impairment, OREO indemnification income from FDIC, other credit related costs including losses on repossessed real estate and other assets, other foreclosure related expenses., and non-recurring items. Pre-Tax Pre-Provision Income 1 & Net Income 16 |
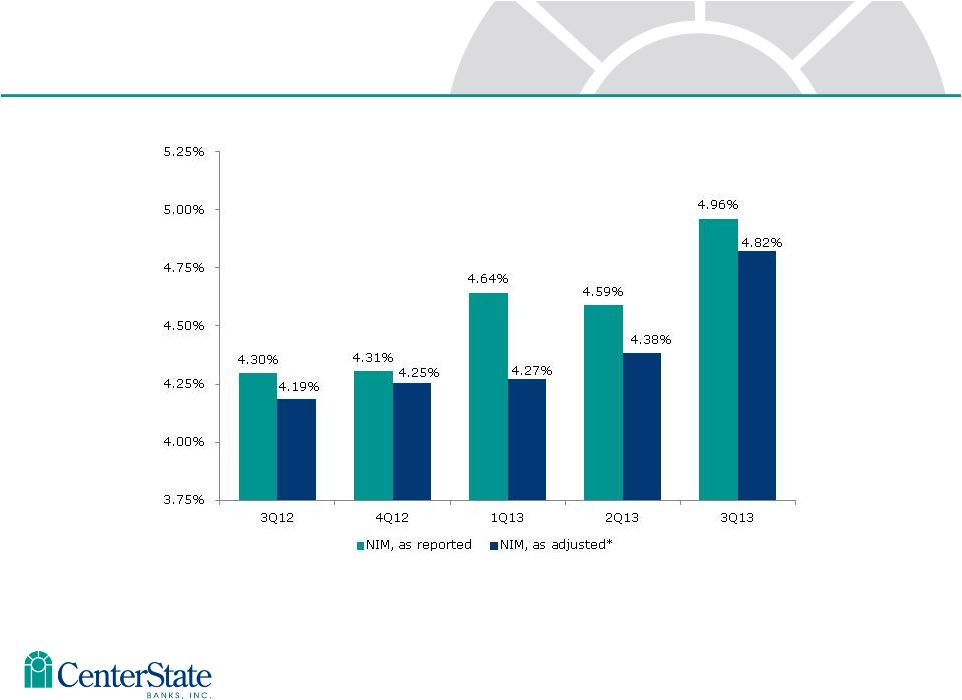 17 Net Interest Margin FTE * Excluding accelerated accretion related to ASC 310-10 loans and other adjustments 17 |
 10 Efficiency Ratio Operating Efficiencies 18 76% 77% 76% 76% 78% 78% 78% 77% 74% 73% 74% 73% 65% 70% 75% 80% 2Q12 3Q12 4Q12 1Q13 2Q13 3Q13 Efficiency Ratio* Efficiency ratio, excluding Correspondent Banking** * Efficiency Ratio is defined as follows: [non-interest expense – intangible amortization – credit related expenses – merger related expenses – other nonrecurring expense] / [net interest income (fully tax equivalent) + non-interest income – gain on sale of AFS securities – FDIC indemnification revenue – nonrecurring income] **Efficiency Ratio, excluding Correspondent Banking is defined as follows: [non-interest expense – Correspondent Banking non- interest expense – intangible amortization – credit related expenses – merger related expenses – other nonrecurring expense] / [net interest income (fully tax equivalent) – Correspondent Banking net interest income + non-interest income – Correspondent Banking non-interest income – gain on sale of AFS securities – FDIC indemnification revenue – nonrecurring income] |
 Loan Portfolio |
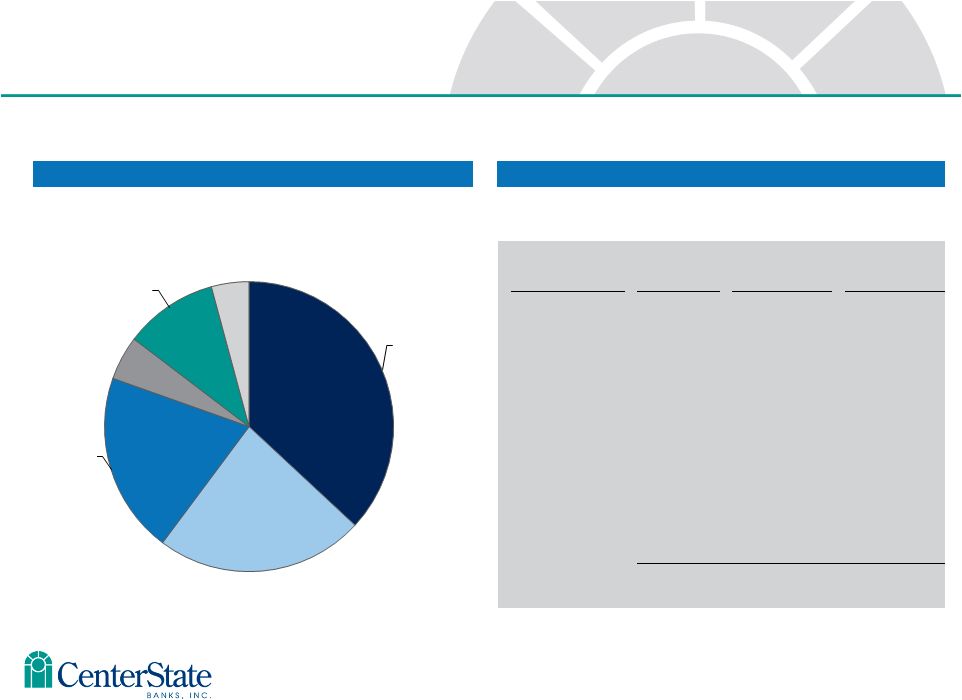 Total Loans by Type Total Loans Detail Loan Type No. of Loans Balance Avg Loan Balance Residential Real Estate 4,314 $ 449 MM $104,100 CRE-Owner Occupied 759 $ 283 MM $372,900 CRE-Non Owner Occupied 515 $ 246 MM $477,700 Construction, A&D, & Land 432 $ 60 MM $138,900 Commercial & Industrial 1,291 $ 127 MM $98,400 Consumer & All Other 2,920 $ 51 MM $17,500 Total 10,231 $ 1,216 MM $118,900 Total Loan Portfolio as of September 30, 2013 Excluding FDIC covered assets 20 Residential Real Estate 37% Comm RE - Owner Occupied 23% Comm RE - Non Owner Occupied 20% Construction, A&D, & Land 5% Commercial & Industrial 11% Consumer / Other 4% |
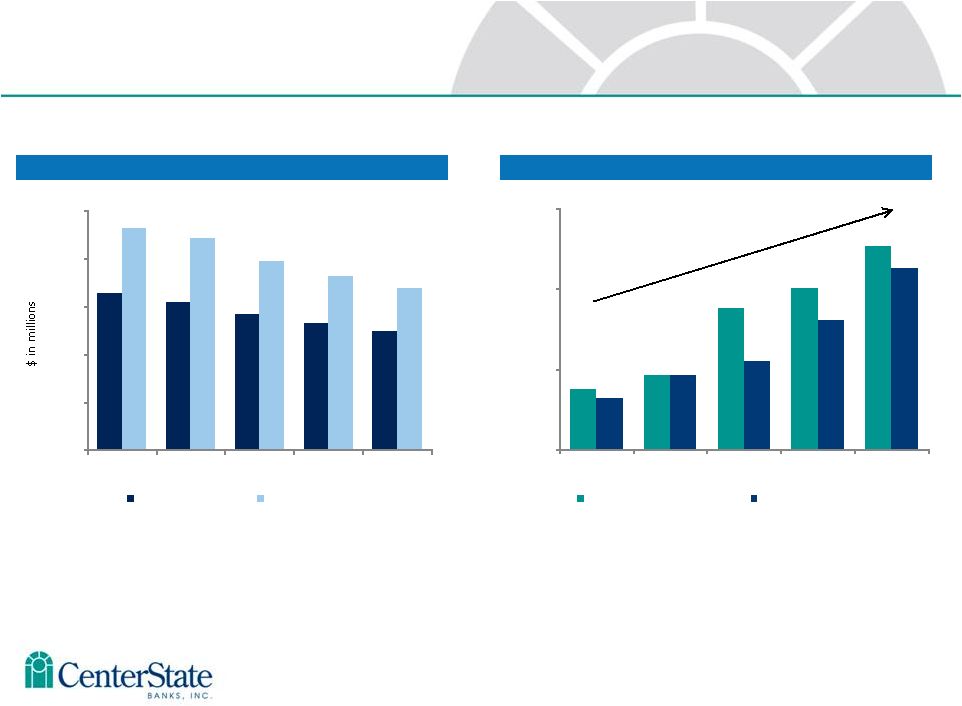
 Non-Covered Loans Non-Covered Loans - Average Yields, FTE Non-Covered Loans – Average Balances New Loan Production New Loan Production – Average Yields ^ Adjusted for accelerated accretion related to noncovered ASC 310-10 loans 21 $1,130 $1,138 $1,136 $1,156 $1,195 $1,075 $1,100 $1,125 $1,150 $1,175 $1,200 $1,225 3Q12 4Q12 1Q13 2Q13 3Q13 $52 $55 $44 $84 $82 $62 $77 $56 $106 $114 $20 $50 $80 $110 3Q12 4Q12 1Q13 2Q13 3Q13 Funded Loans Total Loan Production 4.40% 4.31% 4.27% 4.13% 4.35% 4.00% 4.10% 4.20% 4.30% 4.40% 4.50% 3Q12 4Q12 1Q13 2Q13 3Q13 5.08% 5.02% 4.92% 4.86% 4.73% 4.50% 4.75% 5.00% 5.25% 3Q12^ 4Q12^ 1Q13 2Q13 3Q13 |
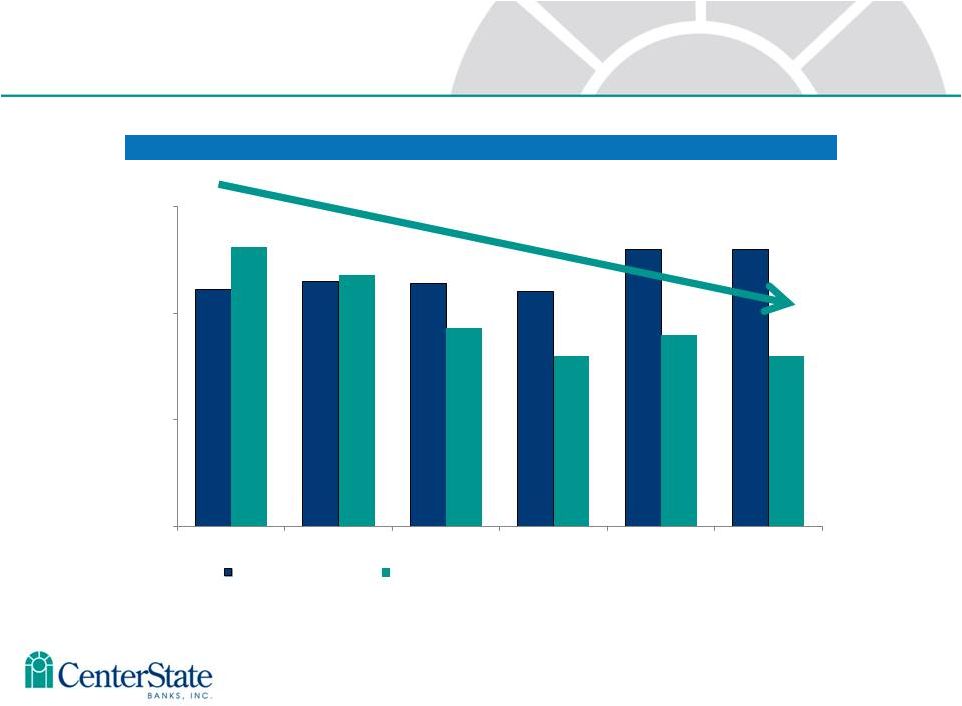
 Covered Loans – Average Yields* Covered Loans – Average Balances* Covered Loans 22 * Adjusted for measurement period adjustment. ** Excluding accelerated accretion related to ASC 310-10 loans 7.03% 7.71%7.71% 11.06% 12.03% 14.15% 6.56% 8.42% 10.45% 13.04% 4.00% 8.00% 12.00% 16.00% 3Q12** 4Q12 1Q13** 2Q13** 3Q13** Average Yield, as reported Average Yield, as adjusted $328 $310 $284 $265 $249 $464 $442 $394 $364 $338 $- $100 $200 $300 $400 $500 3Q12 4Q12 1Q13 2Q13 3Q13 Carrying Balance Unpaid Principal Balance |
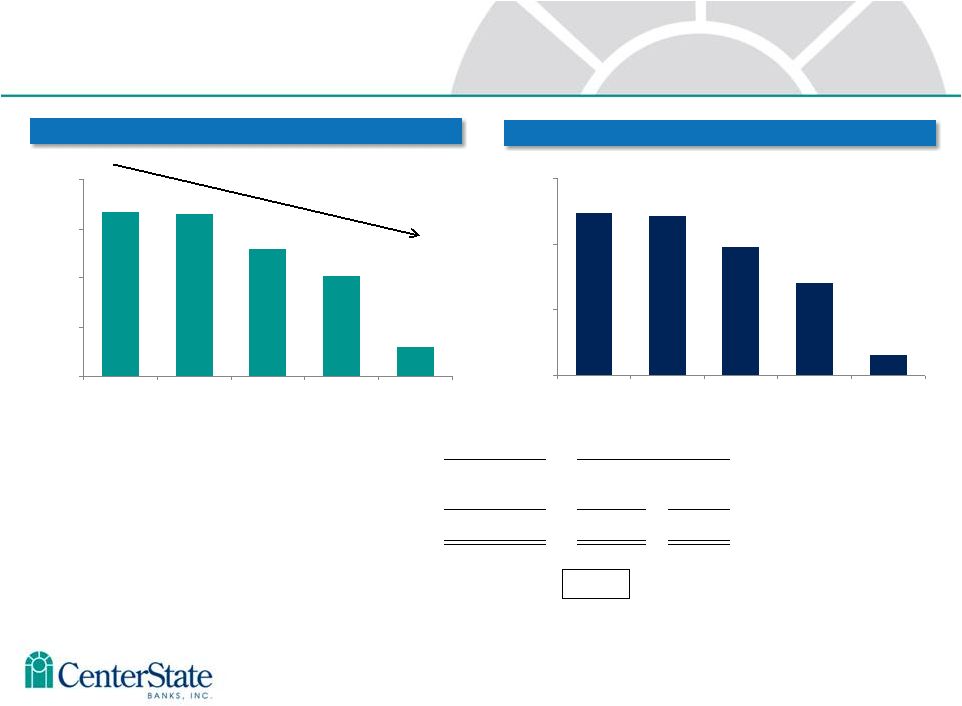
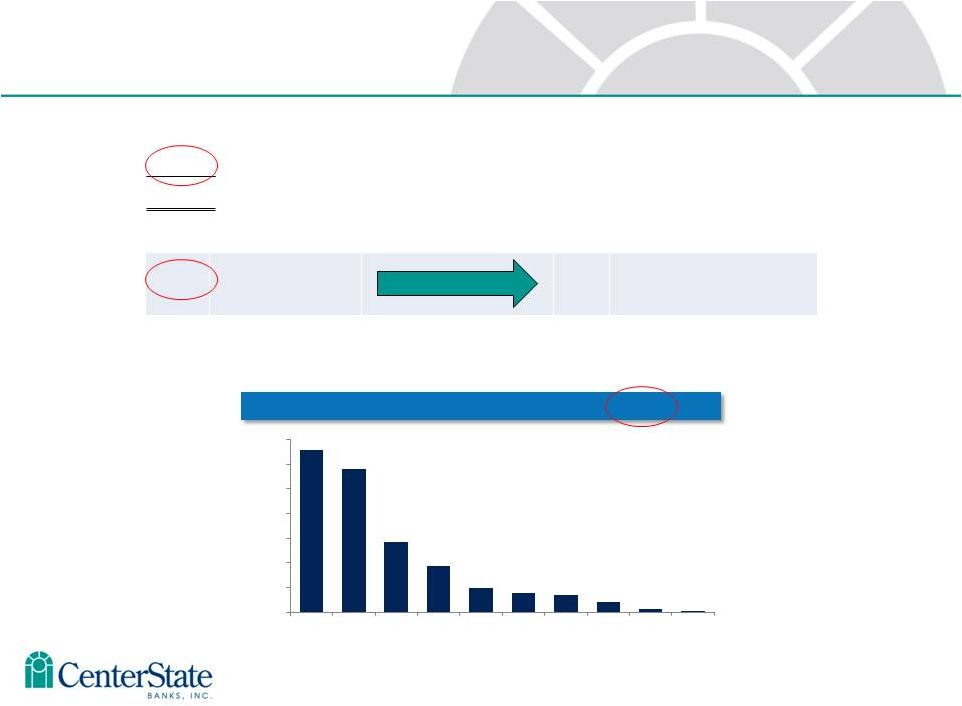 23 23 FDIC Indemnification Asset as of September 30, 2013 Written off over the lesser of the remaining expected life of the related loan pool(s) or the remaining term of the related loss share agreement(s). Amortization of Indemnification Asset $31M FDIC Reimbursement Write-Off $39M Collect from Borrower (or sale of OREO) Expected reimbursements from FDIC for 80% of expected losses Previously expected reimbursements for previously expected losses no longer expected Total indemnification assets $51M $31M $82M ($31M) $13.2 $11.6 $5.7 $3.8 $1.9 $1.6 $1.4 $0.9 $0.2 $0.0 $- $2.0 $4.0 $6.0 $8.0 $10.0 $12.0 $14.0 2013 2014 2015 2016 2017 2018 2019 2020 2021 2022 |
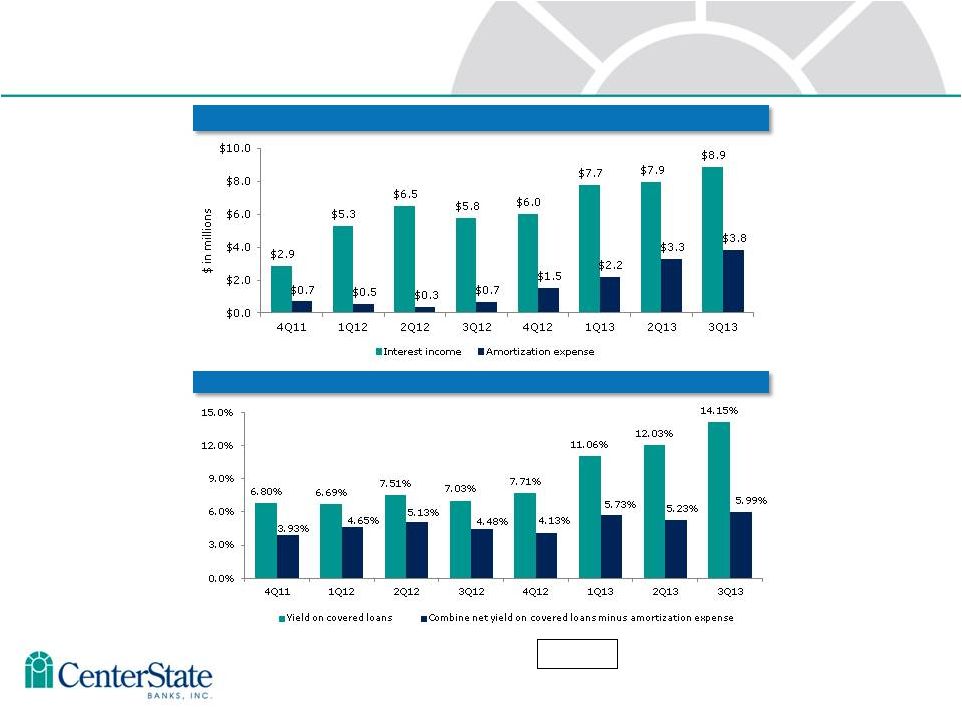 24 Indemnification Asset (“IA”) amortization and its relationship with FDIC covered loan interest income accretion 24 Interest Income and Amortization Expense Yields on Covered Loans and Indemnification Asset 8 Quarter Average = 4.91% |
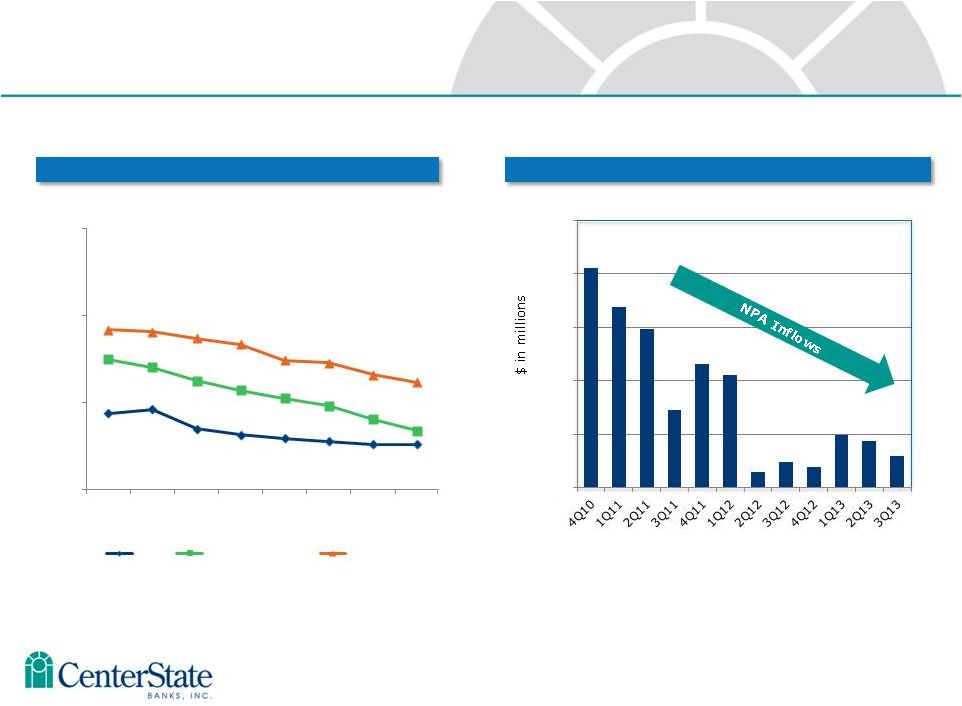 Credit Trends Improving 25 NPAs / Loans & OREO (%) NPA Inflows Slowing Down Source: SNL Financial Nonperforming assets include loans 90 days or more past due, nonaccrual loans, and OREO/ORA; and exclude FDIC covered assets Southeastern peers include ABCB, PNFP, RNST, SCBT, UBSH and UCBI. Florida peers include all banks headquartered in Florida with total assets between $500 million and $5 billion. $0 $5 $10 $15 $20 $25 2.58 3.36 6.15 0.00 5.00 10.00 15.00 4Q11 1Q12 2Q12 3Q12 4Q12 1Q13 2Q13 3Q13 CSFL Southeastern Peers Florida Peers |
 26 26 ALLL – Non-Covered Loans ALLL as a % of NPLs= 91% 2.12% 2.11% 1.97% 1.86% 1.57% 1.45% 1.65% 1.85% 2.05% 2.25% 3Q12 4Q12 1Q13 2Q13 3Q13 2.12% 2.11% 1.99% 1.85% 1.58% 1.50% 1.75% 2.00% 2.25% 3Q12 4Q12 1Q13 2Q13 3Q13 Total ALLL – Non-Covered Loans FAS 5 Component Loan Balance ALLL Loans (Fas 5) $1,175,801 $18,481 1.57% Impaired Loans (Fas 114) 39,880 784 1.97% Total Non-Covered Loans $1,215,681 $19,265 1.58% |
 Deposit Portfolio |
 Total Deposits by Type Total Deposits Detail 23 Total Deposit Portfolio Deposit Type No. of Deposits Balance Avg Deposit Balance Demand Deposits 37,498 $ 562 MM $15,000 Now Accounts 50,050 $ 453 MM $9,000 Savings Deposits 17,714 $ 240 MM $13,600 Money Market 3,127 $ 307 MM $98,100 Certificates of Deposits 11,530 $ 400 MM $34,700 Total 119,919 $ 1,962 MM $16,400 28 Demand Deposits 28% NOW Accounts 23% Savings Accounts 12% Money Market 16% Certificates of Deposits 21% as of September 30, 2013 |
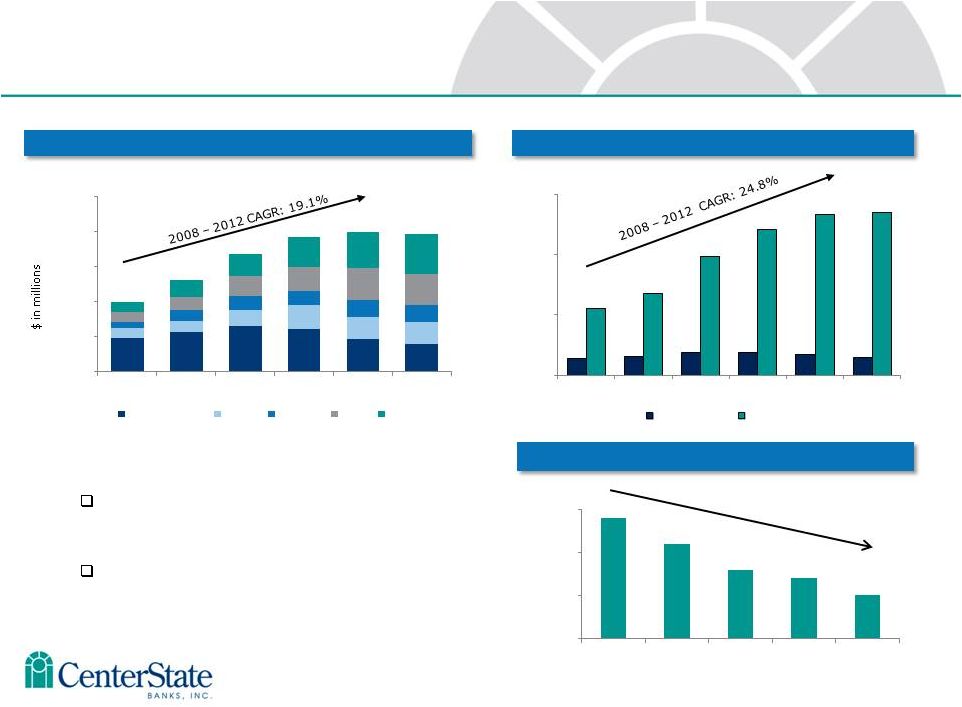 Value of core deposits not fully realized in this low rate environment. Approximately 119,919 total accounts - $16,361 average balance per account Core deposits defined as non-time deposits. Building Franchise Value with Core Deposits 29 28% 23% 21% 12% 16% 400 307 240 453 562 0 500 1,000 1,500 2,000 2,500 2008 2009 2010 2011 2012 9/30/13 Time Deposits MMDA Savings NOW DDA 11 12 15 15 14 12 44 55 79 97 107 108 0 40 80 120 2008 2009 2010 2011 2012 9/30/13 Time Deposits Core Deposits 0.34% 0.31% 0.28% 0.27% 0.25% 0.20% 0.25% 0.30% 0.35% 3Q12 4Q12 1Q13 2Q13 3Q13 Total Deposits Number of Deposit Accounts (000’s) Cost of Deposits |
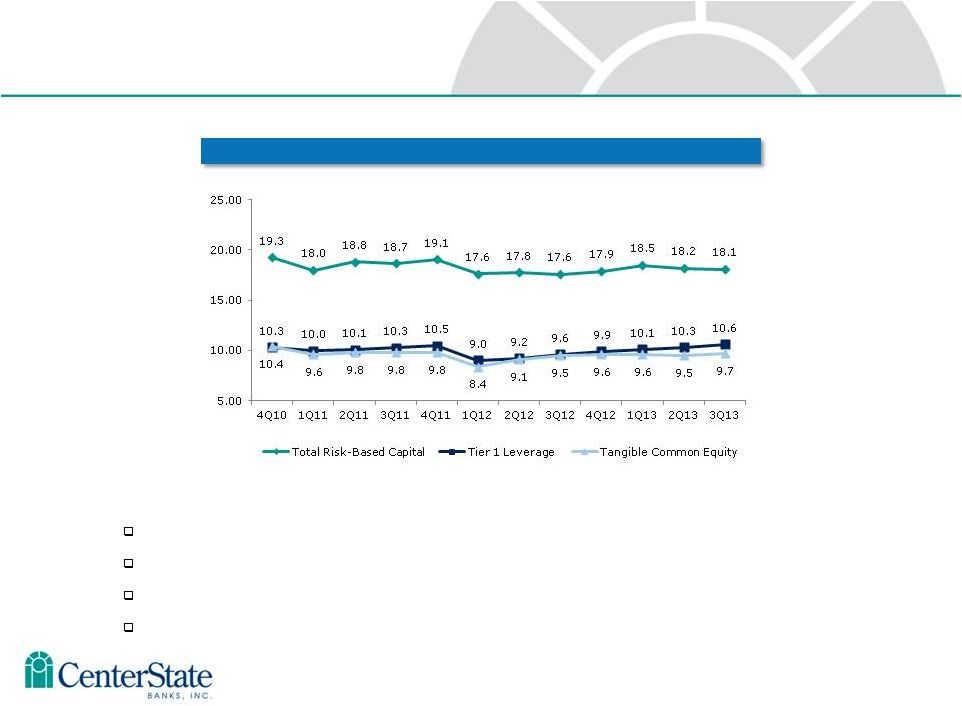 Total Risk-Based, Tier 1 Leverage & Tangible Common Equity Ratios Two successful capital raises in 2009 and 2010 totaling $114 million First publicly traded bank in Florida to successfully complete a capital raise during financial crisis in 2009 Over 50 “Blue Chip” active institutional investors – Average daily volume (3m) approximates 48,000 shares Institutions committed to capitalize additional FDIC accretive transactions Capital 30 |
 |