 Gulf South Bank Conference New Orleans May 12, 2014 Ernest S. Pinner, Chairman & CEO James J. Antal, Chief Financial Officer Stephen D. Young, Treasurer (and chief operating officer of subsidiary bank) Exhibit 99.1 |
 This presentation contains forward-looking statements, as defined by Federal Securities Laws, relating to present or future trends or factors affecting the operations, markets and products of CenterState Banks, Inc. (CSFL). These statements are provided to assist in the understanding of future financial performance. Any such statements are based on current expectations and involve a number of risks and uncertainties. For a discussion of factors that may cause such forward-looking statements to differ materially from actual results, please refer to CSFL’s most recent Form 10-Q and Form 10-K filed with the Securities Exchange Commission. CSFL undertakes no obligation to release revisions to these forward-looking statements or reflect events or circumstances after the date of this presentation. Forward Looking Statement 2 2 |
 Company Overview |
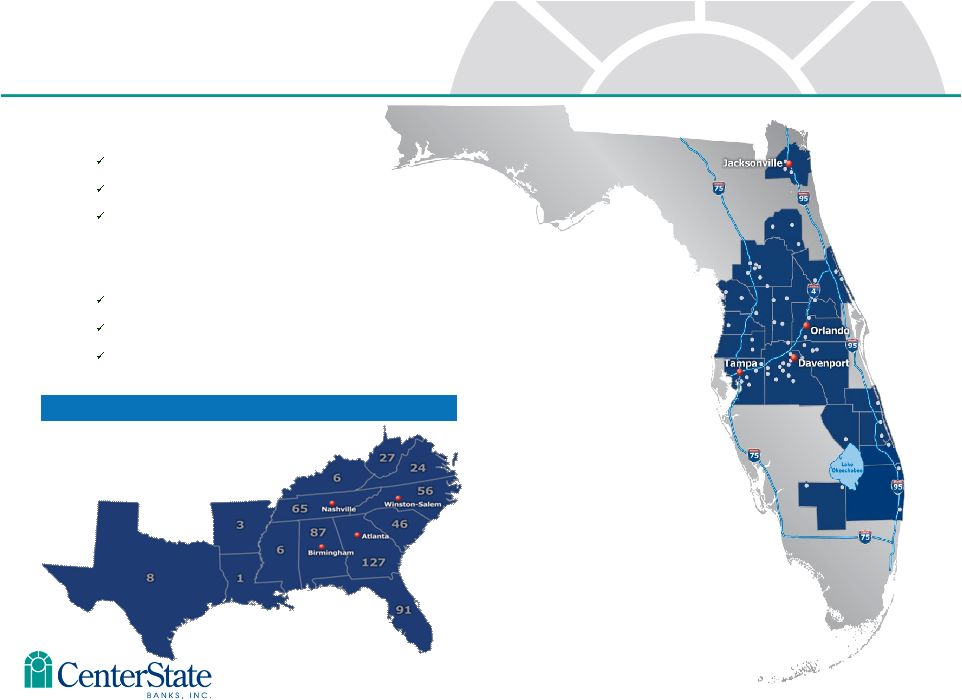 Correspondent Banking Market As of 3/31/14 • Headquartered in Davenport, FL $3.0 billion in assets $1.8 billion in loans $2.6 billion in deposits • Company formed: June 2000 1 Subsidiary Bank 51 Branch banking offices Correspondent Segment Corporate Overview 4 |
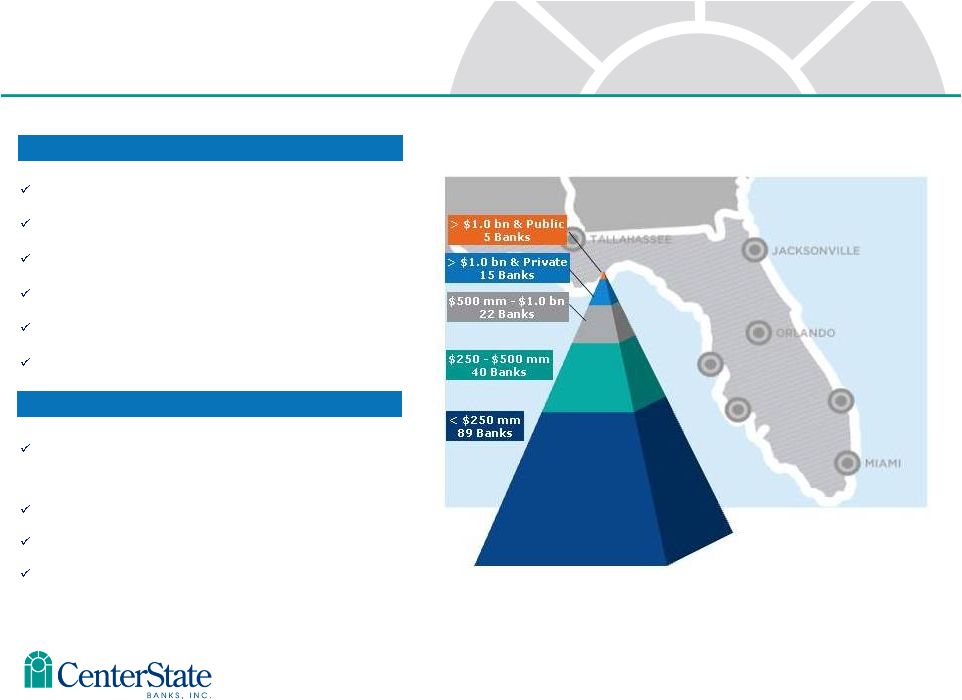 18 CSFL – Best Positioned Florida Consolidator Source: SNL Financial Data as of MRQ available 5 Ocala National Bank (Jan 2009) Olde Cypress Community Bank (July 2010) Independent National Bank of Ocala (Aug 2010) Community National Bank of Bartow (Aug 2010) Central Florida State Bank (Jan 2012) First Guaranty Bank & Trust Co. (Jan 2012) Federal Trust Acquisition from The Hartford Insurance Company (Nov 2011) TD Bank divesture in Putnam (Jan 2011) Gulfstream Business Bank in Stuart (Jan 2014) First Southern Bancorp (Pending) FDIC Acquisitions Non-FDIC Acquisitions |
 Gulfstream Business Bank – Closed January 17, 2014 Offices: 4 Assets: $545 million Deposits: $467 million Loans: $376 million Gulfstream Highlights (1) (1) Financial data as of 12/31/13 Gulfstream (4 branches) CSFL (55 branches) 6 Port St. Lucie Stuart Jupiter Delray Beach Lake Okeechobee Vero Beach Fort Pierce |
 7 Efficiency Initiatives Total fully phased-in expense reduction – $6 million annually Branch closures – $2.7 million annually Other restructuring and expense reductions – $3.3 million annually 8 branch closings in April 2014 |
 (1) Based on financial data as of December 31, 2013 Source: CSFL Management, FSOF Management First Southern Highlights (1) Offices: 17 Assets: $1,093 million Deposits: $883 million Loans: $635 million CSFL Branches CSFL & FSOF Branches FSOF Branches First Southern Bancorp, Inc. – Expected to close June 2014 8 |
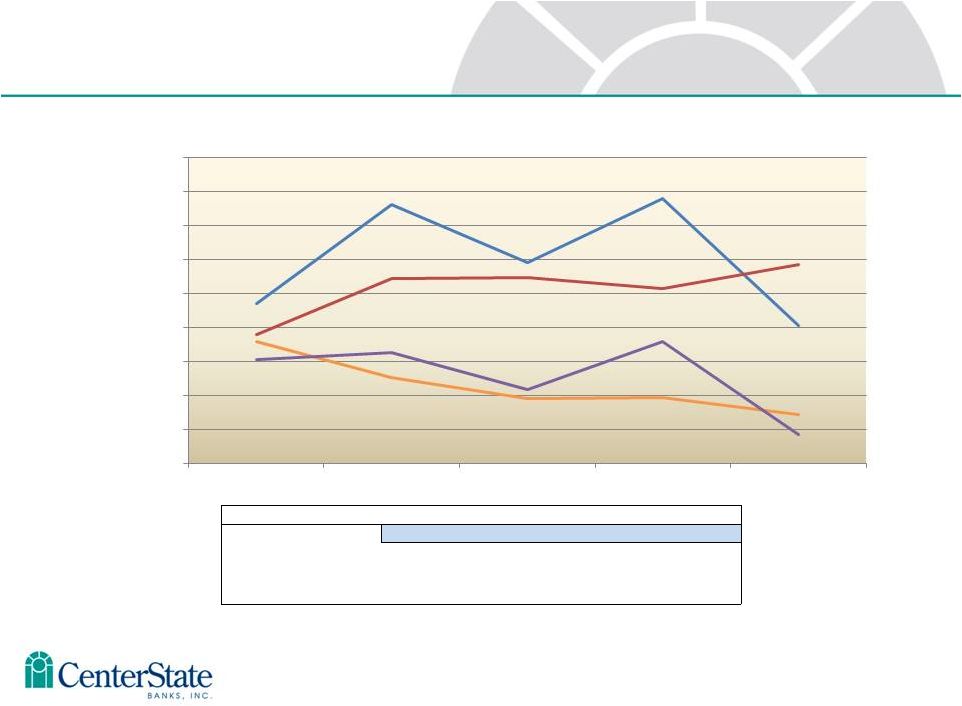
 Florida Trends 9 Source: U.S. Census Bureau and Bureau of Labor Statistics |
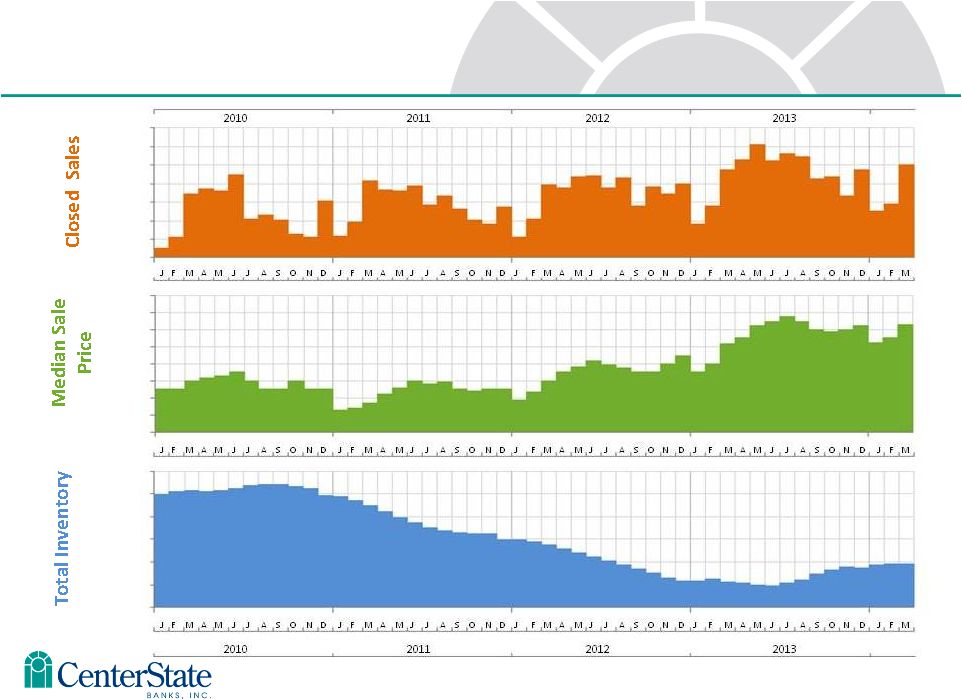 10 Source: Florida Realtors Monthly Market Detail (March 2014) – Single Family Homes Florida Real Estate – Single Family Homes 10 24,000 22,000 20,000 18,000 16,000 14,000 12,000 10,000 $190K $180K $170K $160K $150K $140K $130K $120K $110K 190,000 170,000 150,000 130,000 110,000 90,000 70,000 |
 1st Quarter Financial Summary |
 12 1st Quarter Summary of Financial Results 1Q14 4Q13 EPS $0.03 $0.06 Operating EPS $0.13 $0.07 • Merger related expenses Gulfstream $2,072 First Southern $275 • Efficiency initiatives- charges Impairment charges $2,653 RIF severance $505 • Efficiency improvements • GSB & Branch closures • NIM unchanged • 4.65% vs. 4.65% • PCI loans and IA effect • ALLL • Credit issues in rear view mirror • Bond sales • First Southern effect Current Qtr take-aways |
 13 NIM Summary 1. Interest bearing deposits. Does not include non-interest bearing checking accounts. 13 1Q14 4Q13 Average Avg Average Avg Balance Rate Balance Rate Loans $1,513,060 4.75% $1,229,868 4.64% PCI loans 251,587 13.27% 240,804 13.00% Securities 532,046 3.04% 453,658 2.94% Fed funds sold and other 197,915 0.49% 161,270 0.52% Total interest earning assets $2,494,608 4.91% $2,085,600 4.92% Interest bearing deposits¹ $1,653,806 0.33% $1,405,244 0.35% All other 94,340 1.08% 71,505 0.96% Total interest bearing liabilities $1,748,146 0.37% $1,476,749 0.38% Net Interest Margin 4.65% 4.65% |
 14 Relationship between Covered loans and FDIC indemnification asset (IA) 14 Covered Loans – Average Yields* * As adjusted, excludes accelerated accretion related to ASC 310-10 loans IA Amortization Expense At 3/31/14 remaining projected IA to be amortized ($34M) |
 15 Loan Growth, excludes PCI loans Loan Production by Quarter • Avg yld funded loans 4.54% • 27% Resi • 33% CRE • 24% C&I • 16% all other • Loan pipeline: End of 1Q14: $140M End of 4Q13: $114M End of 3Q13: $124M End of 2Q13: $150M End of 1Q13: $175M Current Quarter Loan Production |
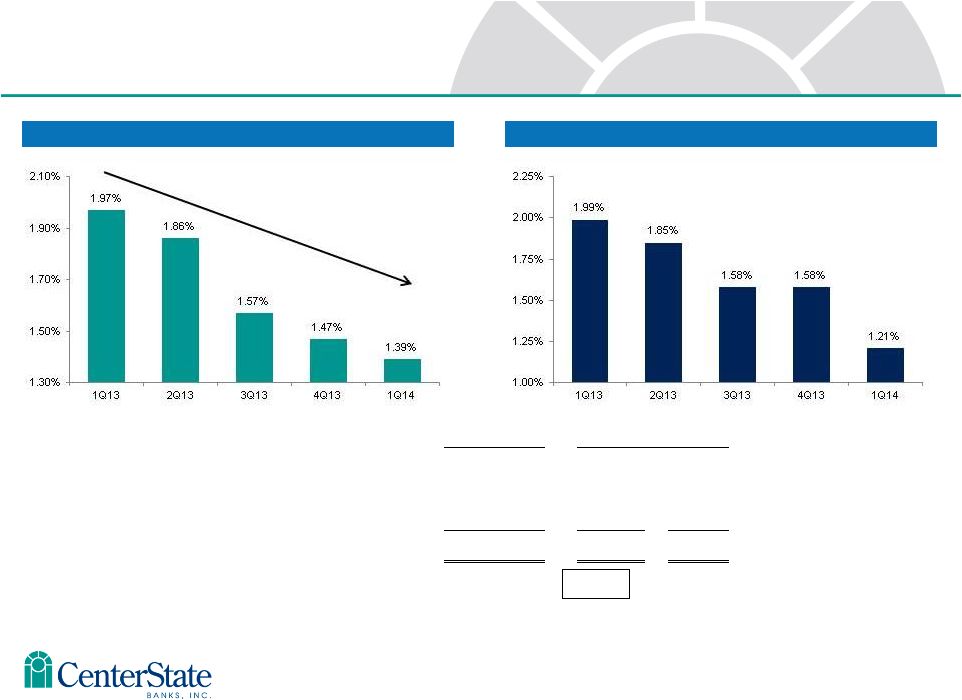 16 16 ALLL – excluding PCI Loans FAS 5 Component (excluding Gulfstream) Total ALLL (excluding PCI loans) Loan Balance ALLL Loans (Fas 5) $1,218,614 $16,994 1.39% Gulfstream loans 319,665 --- --- Impaired Loans (Fas 114) 26,555 1,919 7.23% Total Non-PCI Loans $1,564,834 $18,913 1.21% ALLL as a % of NPLs= 62% |
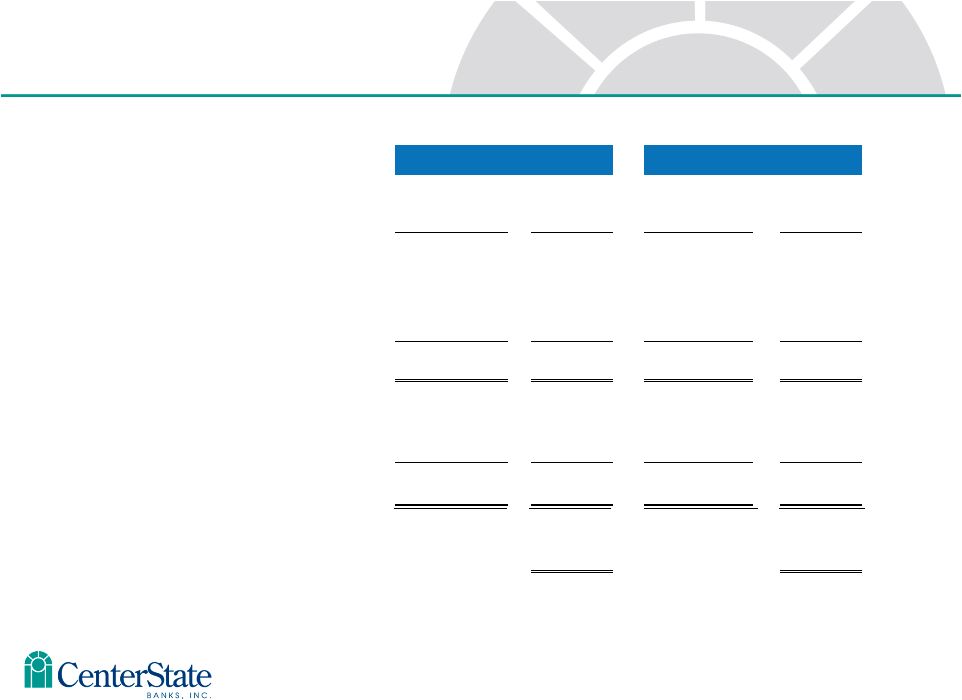
 17 ALLL – PCI loans 17 FDIC Not Total % of Covered Covered PCI Loans Legal Bal Legal Balance $291,821 $41,540 $333,361 100% Discount Balance (72,088) (10,473) (82,561) (25%) Book Value $219,733 $31,067 $250,800 75% ALLL (1,183) --- (1,183) Total, net of ALLL $218,550 $31,067 $249,617 |
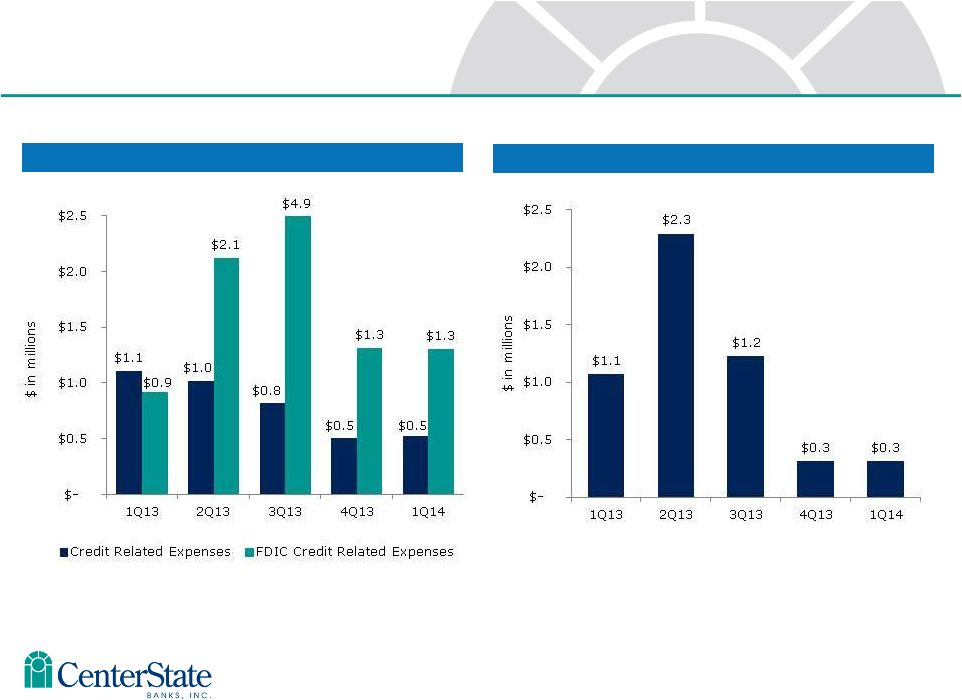 18 Credit Metrics Credit Related Expenses Net Charge-offs 18 |
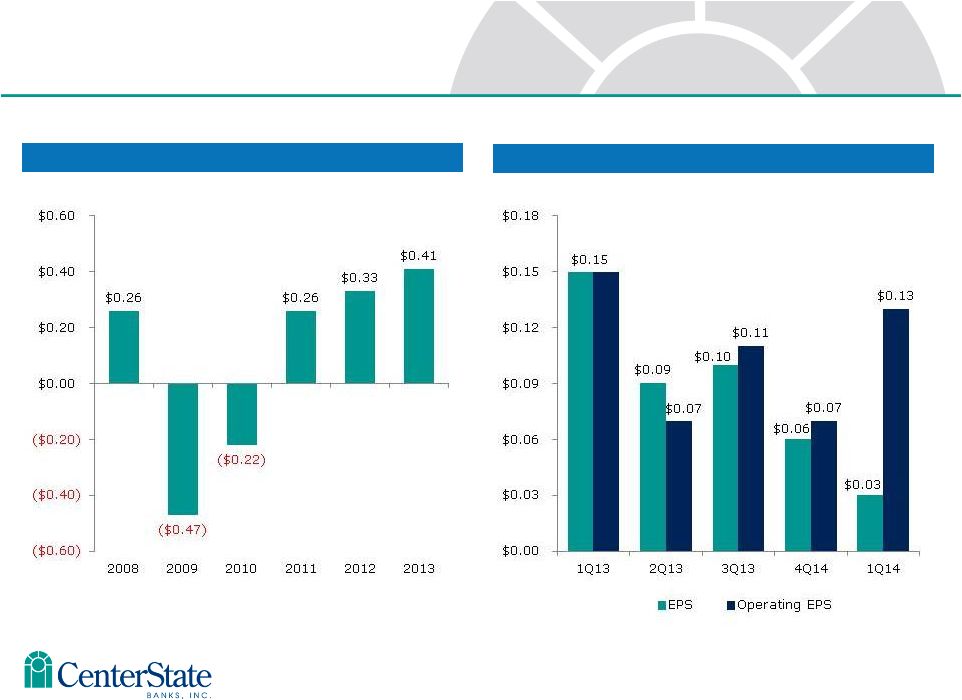 EPS – 6 years Profitability Metrics 19 EPS & Operating EPS - 5 quarters |
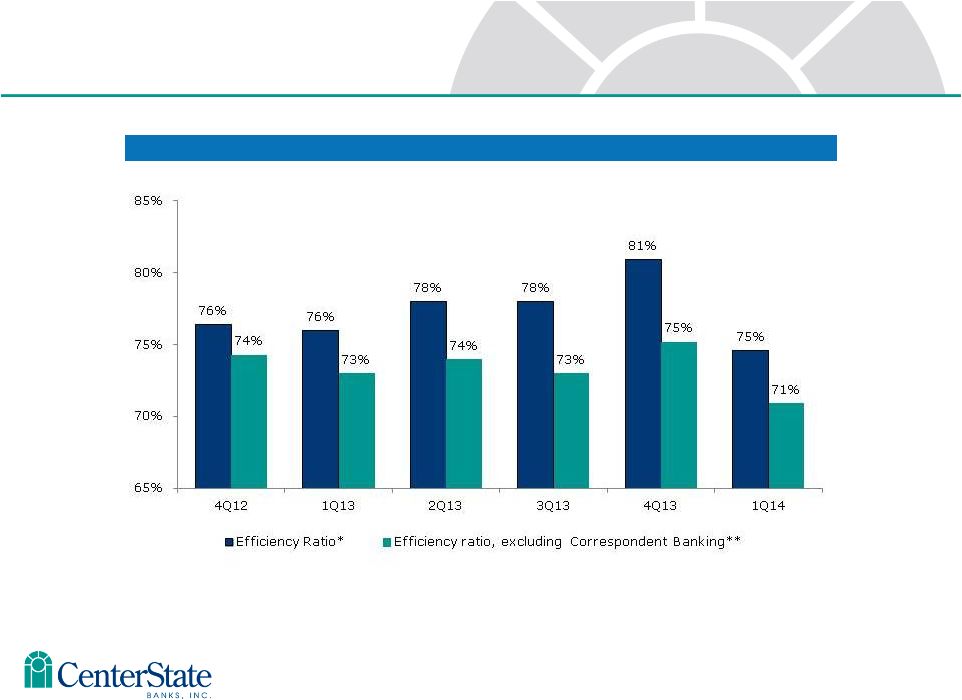 10 Efficiency Ratio Operating Efficiencies 20 * Efficiency Ratio is defined as follows: [non-interest expense – intangible amortization – credit related expenses – merger related expenses – other nonrecurring expense] / [net interest income (fully tax equivalent) + non-interest income – gain on sale of AFS securities – FDIC indemnification revenue – nonrecurring income] **Efficiency Ratio, excluding Correspondent Banking is defined as follows: [non-interest expense – Correspondent Banking non- interest expense – intangible amortization – credit related expenses – merger related expenses – other nonrecurring expense] / [net interest income (fully tax equivalent) – Correspondent Banking net interest income + non-interest income – Correspondent Banking non-interest income – gain on sale of AFS securities – FDIC indemnification revenue – nonrecurring income] |
 Loan Portfolio |
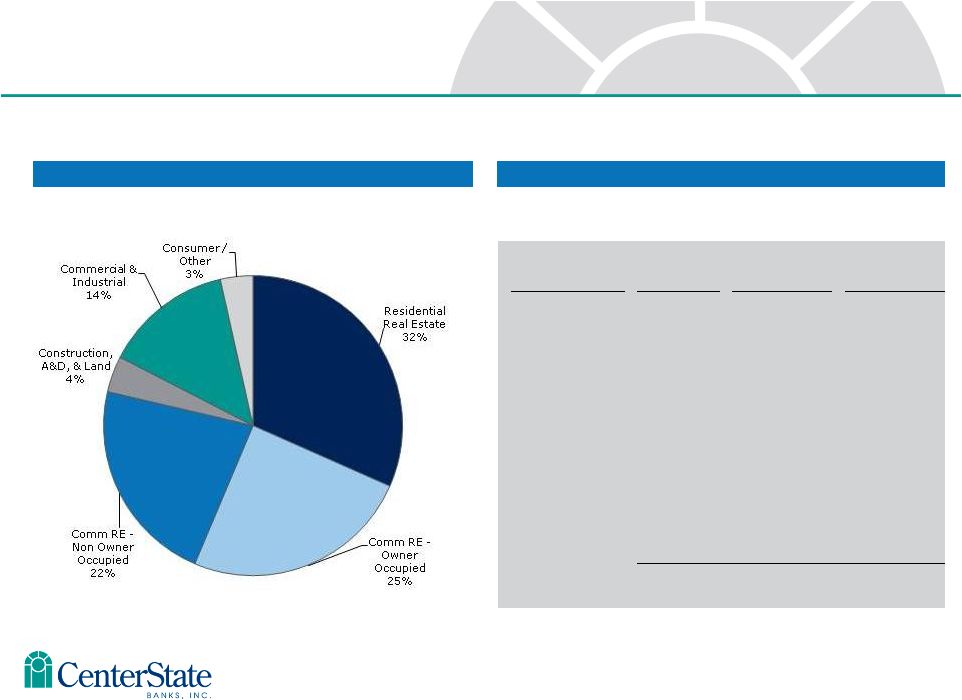 Total Loans by Type Total Loans Detail Loan Type No. of Loans Balance Avg Loan Balance Residential Real Estate 4,715 $ 495 MM $105,000 CRE-Owner Occupied 957 $ 387 MM $404,400 CRE-Non Owner Occupied 646 $ 349 MM $540,200 Construction, A&D, & Land 465 $ 61 MM $131,200 Commercial & Industrial 1,858 $ 218 MM $117,300 Consumer & All Other 2,874 $ 55 MM $19,100 Total 11,515 $ 1,565 MM $135,900 Total Loan Portfolio as of March 31, 2014 Excluding purchased credit-impaired loans 22 |
 Loans, excluding PCI loans Yields (TEY) Average Balances 23 New Loan Production – Average Yields New Loan Production |
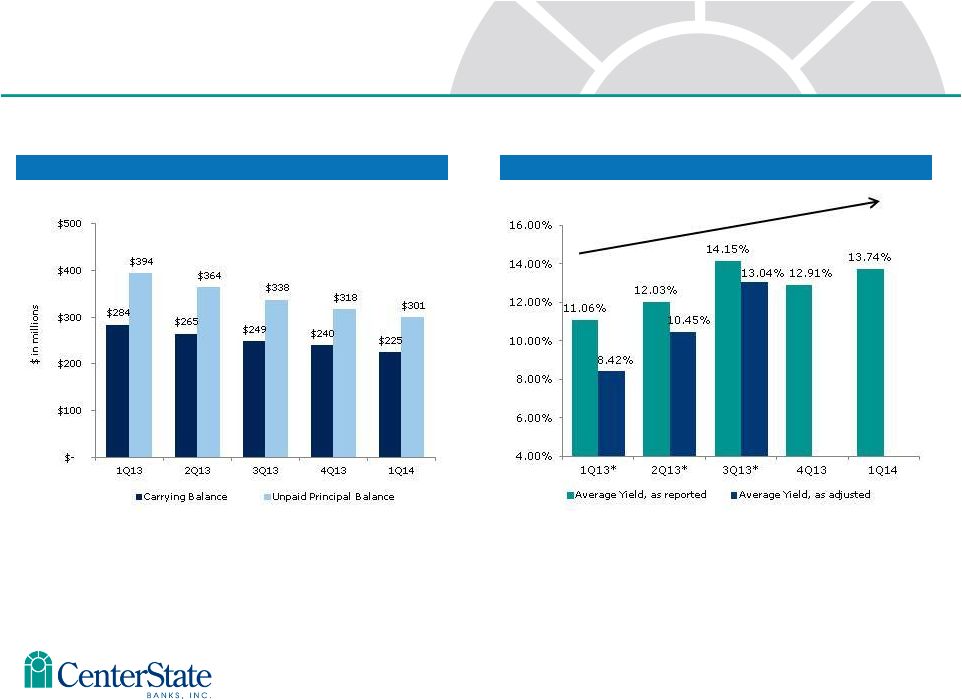 Covered Loans – Average Yields* Covered Loans – Average Balances Covered Loans, included in total PCI loans 24 * Excluding accelerated accretion related to ASC 310-10 loans |
 25 25 FDIC Indemnification Asset $34M FDIC Reimbursement Write-Off $43M Collect from Borrower (or sale of OREO) $31M Expected reimbursements from FDIC for 80% of expected losses $34M Previously expected reimbursements for previously expected losses no longer expected $65M Total indemnification assets Written off over the lesser of the remaining expected life of the related loan pool(s) or the remaining term of the related loss share agreement(s). Amortization of Indemnification Asset ($34M) as of March 31, 2014 |
 26 Indemnification Asset (“IA”) amortization and its relationship with FDIC covered loan interest income accretion 26 Interest Income and Amortization Expense 8 Quarter Average = 4.78% Yields on Covered Loans and Indemnification Asset |
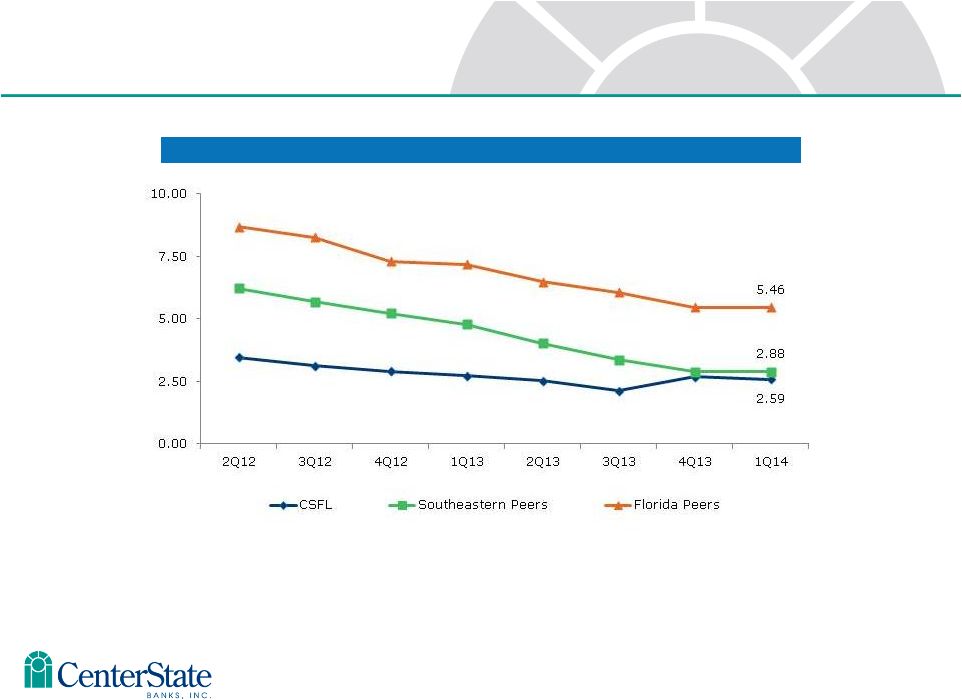 Credit Trends 27 NPAs / Loans & OREO (%) Source: SNL Financial, MRQ presented if current quarter not yet available Nonperforming assets include loans 90 days or more past due, nonaccrual loans, and OREO/ORA; and exclude FDIC covered assets Southeastern peers include ABCB, PNFP, RNST, SCBT, UBSH and UCBI. Florida peers include all banks headquartered in Florida with total assets between $500 million and $5 billion. |
 Deposit Portfolio |
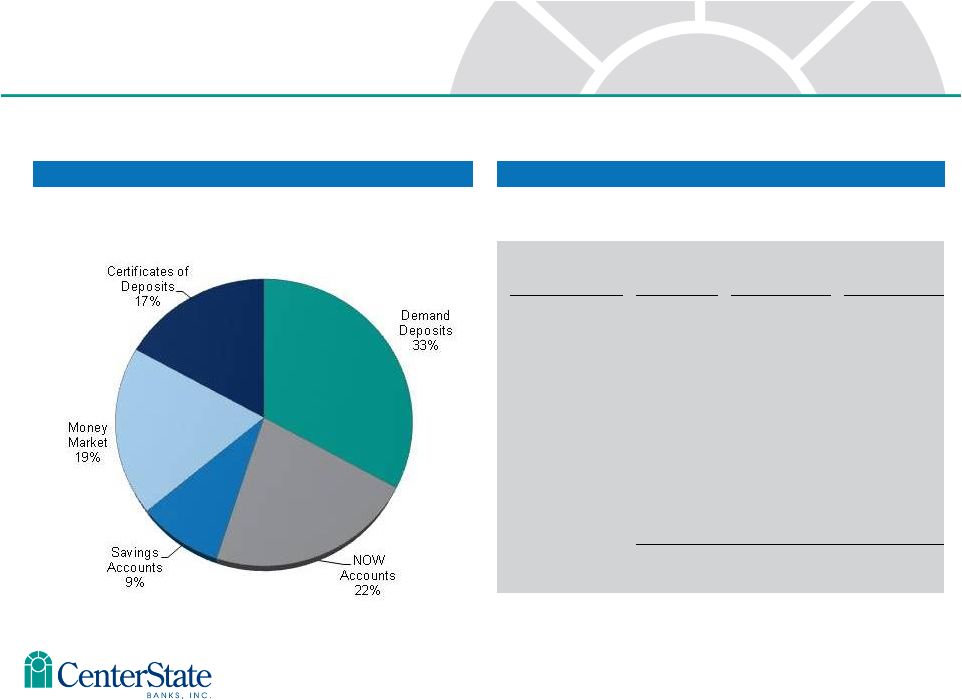 Total Deposits by Type Total Deposits Detail 23 Total Deposit Portfolio as of March 31, 2014 Deposit Type No. of Deposits Balance Avg Deposit Balance Demand Deposits 43,283 $ 839 MM $19,400 Now Accounts 50,961 $ 559 MM $11,000 Savings Deposits 17,487 $ 235 MM $13,400 Money Market 4,442 $ 482 MM $108,600 Certificates of Deposits 11,402 $ 444 MM $38,900 Total 127,575 $ 2,559 MM $20,100 29 |
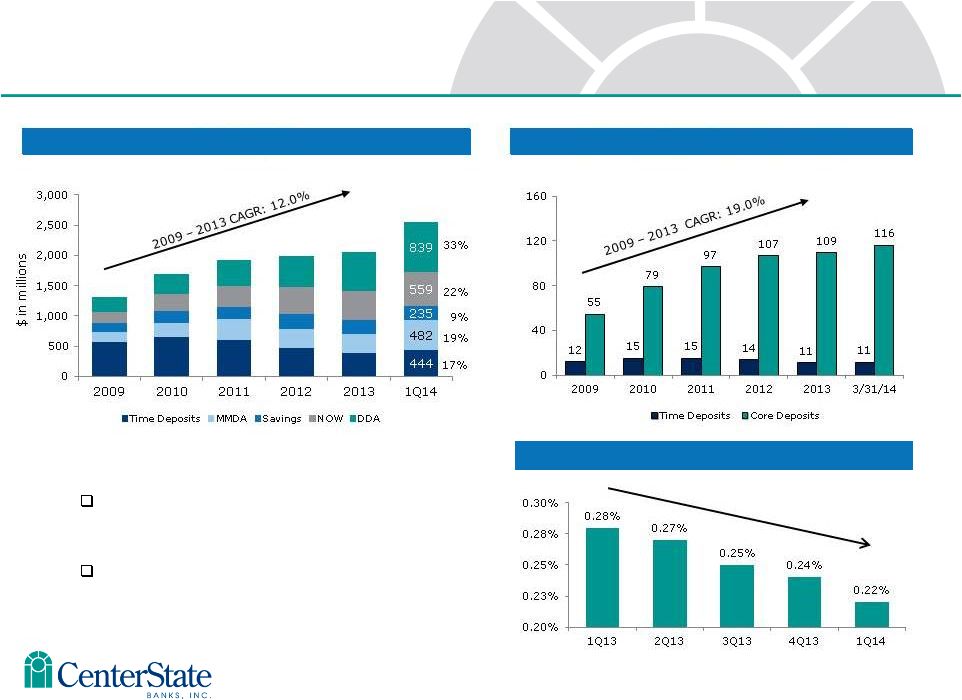 Core deposits defined as non-time deposits. Total Deposits Number of Deposit Accounts (000’s) Building Franchise Value with Core Deposits 30 Value of core deposits not fully realized in this low rate environment. Approximately 127,575 total accounts - $20,056 average balance per account Cost of Deposits |
 |
 Appendix |
 1. Assumes 8% capital allocation. Correspondent Analysis 33 Correspondent Earnings Ratios 2009 2010 2011 2012 2013 ROE 38.06% 59.07% 33.14% 58.80% 15.99% ROA 3.04% 4.73% 2.65% 4.70% 1.28% Net Capital Mkt Revenue Fixed Non-Interest Expense Net Interest Income Net Income $0 $2,000,000 $4,000,000 $6,000,000 $8,000,000 $10,000,000 $12,000,000 $14,000,000 $16,000,000 $18,000,000 2009 2010 2011 2012 2013 Correspondent Income Analysis 1 |
 Correspondent Analysis 34 $0 $200,000 $400,000 $600,000 $800,000 $1,000,000 $1,200,000 2009 2010 2011 2012 2013 Recurring Revenue International Clearing/Fed Funds BA / SK Asset Liability |