Exhibit 99.1
|
|
|
|
| |
FOR IMMEDIATE RELEASE January 26, 2016 |
| |
| CenterState Banks, Inc. Announces Fourth Quarter 2015 Operating Results |

CenterState reports record earnings for year ending December 31, 2015
DAVENPORT, FL. – January 26, 2016 - CenterState Banks, Inc. (Nasdaq: CSFL) reported earnings per share (“EPS”) of $0.23 on net income of $10,396 for the fourth quarter of 2015, compared to $0.22 per share on net income of $9,916 reported during the prior quarter. For the year 2015, the Company reported $0.85 EPS ($0.87 Operating EPS) compared to $0.31 EPS ($0.54 Operating EPS) reported for year 2014. All amounts are in thousands, except per share information, and all earnings per share amounts are reported on a diluted basis unless otherwise noted.
CURRENT QUARTER HIGHLIGHTS
| · | Fourth quarter annualized ROA of 1.02% gaap (1.06% operating) and 1.00% (1.01% operating) for the year 2015. |
| · | Efficiency ratio of 61% for the fourth quarter and 62% for the year 2015. |
| · | 9% annualized increase in loans during the fourth quarter and 11% for the year 2015 (excluding Purchased Credit Impaired “PCI” loans). (page 4) |
| · | 10% annualized increase in checking deposits during the fourth quarter and 9% for the year 2015. |
| · | 12% decrease in non-performing assets during the fourth quarter and 35% decrease from December 31, 2014. (page 10) |
| · | The two complimentary acquisitions in South Miami-Dade County announced in 4Q15 remain on schedule to close late in 1Q16. |
1
Quarterly condensed consolidated income statements (unaudited) are shown below for the periods indicated. See notes 1 and 2 below for a discussion related to FDIC revenue and amortization (negative accretion) included in non-interest income.
Quarterly Condensed Consolidated Statements of Operations (unaudited)
For the quarter ended: | 12/31/15 | 9/30/15 | 6/30/15 | 3/31/15 | 12/31/14 |
Interest income | $ 41,098 | $ 40,112 | $ 41,625 | $ 39,485 | $ 38,019 |
Interest expense | 1,819 | 1,784 | 1,818 | 1,865 | 1,848 |
Net interest income | 39,279 | 38,328 | 39,807 | 37,620 | 36,171 |
Provision for loan losses | 484 | 4 | 2,330 | 1,941 | 210 |
Recovery for loan losses- PCI loans | 59 | (4) | (22) | (299) | (192) |
Net interest income after loan loss provision | 38,736 | 38,328 | 37,499 | 35,978 | 36,153 |
|
|
|
|
|
|
Correspondent banking and capital markets division- income | 6,241 | 5,935 | 8,587 | 6,800 | 5,795 |
Gain on sale of securities available for sale | --- | 4 | --- | --- | --- |
FDIC- IA amortization (negative accretion) (1) | (3,420) | (4,144) | (4,649) | (4,350) | (5,599) |
FDIC- revenue (2) | 633 | 27 | 359 | 667 | 1,080 |
All other non-interest income | 6,212 | 6,308 | 6,276 | 5,964 | 6,259 |
Total non interest income | 9,666 | 8,130 | 10,573 | 9,081 | 7,535 |
|
|
|
|
|
|
Credit related expenses | 309 | 439 | 522 | 16 | 299 |
FDIC credit related expenses | 997 | (46) | 625 | (567) | 369 |
Correspondent banking and capital markets division-expense | 5,094 | 5,063 | 6,008 | 5,595 | 4,993 |
Merger and acquisition related expenses | 524 | 169 | --- | --- | 848 |
Branch closure and efficiency initiatives | --- | --- | --- | --- | (417) |
All other non-interest expense | 25,162 | 25,230 | 25,383 | 25,559 | 25,999 |
Total non interest expense | 32,086 | 30,855 | 32,538 | 30,603 | 32,091 |
|
|
|
|
|
|
Income before income tax | 16,316 | 15,603 | 15,534 | 14,456 | 11,597 |
Income tax provision | 5,920 | 5,687 | 5,656 | 5,308 | 4,316 |
NET INCOME | $ 10,396 | $ 9,916 | $ 9,878 | $ 9,148 | $ 7,281 |
Net Income allocated to common shares | $ 10,343 | $ 9,862 | $ 9,823 | $ 9,097 | $ 7,250 |
|
|
|
|
|
|
Earnings per share (basic) (GAAP) | $ 0.23 | $ 0.22 | $ 0.22 | $ 0.20 | $ 0.16 |
Earnings per share (diluted) (GAAP) | $ 0.23 | $ 0.22 | $ 0.21 | $ 0.20 | $ 0.16 |
Net operating income per share (Non-GAAP) (3) | $ 0.23 | $ 0.22 | $ 0.22 | $ 0.20 | $ 0.17 |
|
|
|
|
|
|
Average common shares outstanding (basic) | 45,237 | 45,200 | 45,161 | 45,128 | 45,072 |
Average common shares outstanding (diluted) | 45,935 | 45,826 | 45,737 | 45,658 | 45,506 |
Common shares outstanding at period end | 45,459 | 45,469 | 45,421 | 45,409 | 45,324 |
note 1: On the date of an FDIC acquisition (with loss share), the Company estimates expected future losses and the timing of those losses by loan pool. The related reimbursements from the FDIC, pursuant to the specific loss share agreement, of those losses are recorded as a receivable from the FDIC, referred to as indemnification asset or “IA.” The Company updates its estimate of future losses and the timing of the losses each quarter. To the extent management estimates that future losses are less than prior expected future losses, management adjusts its estimates of future expected cash flows and this increase is accreted to interest income over the remaining life of those specific loan pools, increasing the yield on loans. Because management no longer expects these incremental future losses on the loan pool(s), then the expected future reimbursements from the FDIC for the related percentage of loss share are also reduced. Instead of immediately charging down the IA for expected future FDIC reimbursements, the IA is written down over the shorter of the loss share period or the life of the related loan pool(s) by negative accretion (amortization) in this line item.
note 2: Two FDIC related revenue items are included in this line item. The first item is FDIC reimbursement income from the sale of OREO. When OREO (those covered by loss share agreements) is sold for a loss, the FDIC covered portion of the loss is recognized as income and included in this line item per the coverage breakdown in the table on page 10, Selected Credit Quality Ratios. Second, when a loan pool (with loss share) is impaired, the impairment expense is included in provision for loan losses, and the percentage of the loss that is reimbursable from the FDIC is recognized as income from FDIC reimbursement, and included in this line item as well.
2
note 3: This non-gaap metric represents gaap net income excluding certain income and expense items net of the effective tax rate for the period presented. Items excluded are gains on sales of securities held for sale, acquisition and merger related expenses and one time charges related to the Company’s efficiency and profitability initiatives announced in January 2014, which include impairment charges on the real estate of several of the branches closed during April 2014, divided by the average diluted common shares outstanding. A reconciliation table is presented on page 18, Explanation of Certain Unaudited Non-GAAP Financial Measures.
The condensed quarterly results of the Company’s correspondent banking and capital markets segment are presented below.
Quarterly Condensed Segment Information - Correspondent banking and capital markets division (unaudited) | |||||
For the quarter ended: | 12/31/15 | 9/30/15 | 6/30/15 | 3/31/15 | 12/31/14 |
Net interest income | $1,716 | $1,545 | $1,467 | $1,602 | $991 |
Provision for loan losses | (4) | 1 | (24) | (131) | --- |
Total non-interest income (note 1) | 6,241 | 5,935 | 8,587 | 6,800 | 5,795 |
Total non-interest expense (note 2) | (5,094) | (5,063) | (6,008) | (5,595) | (4,993) |
Income tax provision | (1,103) | (934) | (1,551) | (1,032) | (692) |
Net income | $ 1,756 | $ 1,484 | $ 2,471 | $ 1,644 | $ 1,101 |
Contribution to diluted earnings per share | $ 0.04 | $ 0.03 | $ 0.05 | $ 0.04 | $ 0.02 |
|
|
|
|
|
|
Allocation of indirect expense net of |
|
|
|
|
|
inter-company earnings credit, net of |
|
|
|
|
|
income tax benefit (note 3) | $(174) | $(304) | $(262) | $(276) | $(163) |
Contribution to diluted earnings per share after |
|
|
|
|
|
deduction of allocated indirect expenses | $ 0.03 | $ 0.03 | $ 0.05 | $ 0.03 | $ 0.02 |
note 1: The primary component in this line item is gross commissions earned on bond sales, fees from hedging services, loan brokering fees and related consulting fees which were $5,254, $4,943, $7,334, $5,694 and $4,876 for 4Q15, 3Q15, 2Q15, 1Q15 and 4Q14, respectively. The fee income in this category is based on sales volume in any particular period and is therefore volatile between comparable periods. The remaining non interest income items in this category, which are less volatile, include fees from safe-keeping activities, bond accounting services, asset/liability consulting related activities, international wires, clearing and corporate checking account services, and other correspondent banking related revenue and fees.
note 2: A significant portion of these expenses are variable in nature and are a derivative of the income from bond sales, hedging services, brokering loans sales and related consulting services identified in note 1 above. The variable expenses related to these fees identified in note 1 above were $2,505, $2,388, $3,461, $2,938 and $2,149 for 4Q15, 3Q15, 2Q15, 1Q15 and 4Q14, respectively. Expenses in this line item do not include any indirect support allocation costs.
note 3: | A portion of the cost of the Company’s indirect departments such as human resources, accounting, deposit operations, item processing, information technology, compliance and others have been allocated to the correspondent banking and capital markets division based on management’s estimates. In addition, an inter-company earnings credit is allocated to the segment for services provided to the commercial bank segment, also based on management’s estimates and judgment. |
3
Loans excluding PCI loans increased $51,395 during the fourth quarter, an annualized growth rate of approximately 8.8% and $230,489 during the year ending December 31, 2015, an annualized growth rate of approximately 10.7%. Total new loans originated during the quarter approximated $203.2 million, of which $157.1 million were funded. About 51% of funded loan origination was commercial real estate (“CRE”), 19% commercial and industrial (“C&I”), 19% single family residential, 5% land, development & construction and 6% were all other.
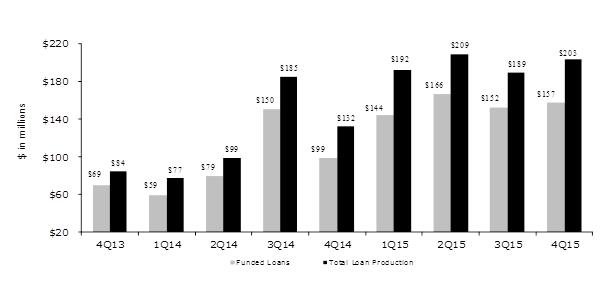
Approximately 60% of the funded loan production was a combination of floating and variable rate, and the remaining 40% was fixed rate. In the aggregate, the funded loan production for the current quarter is expected to result in an estimated duration of approximately 2.3 years. The loan origination pipeline is approximately $266 million at December 31, 2015 compared to $285 million at September 30, 2015. The graph above summarizes total loan production and funded loan production over the past nine quarters.
LOAN PORTFOLIO MIX, PCI LOANS, FDIC COVERED LOANS AND THE RELATED INDEMNIFICATION ASSET (“IA’)
Total PCI loans at December 31, 2015 is equal to $210,528 of which $150,338 (71%) are covered by FDIC loss sharing agreements. The Company acquired both covered and non-covered PCI loans in its June 1, 2014 acquisition of First Southern Bank (“FSB”). It also acquired FDIC covered loans that are not included in the PCI loan portfolio. In addition, the Company also acquired non-covered PCI loans in its January 17, 2014 Gulfstream Business Bank (“GSB”) acquisition. The table below compares the Company’s total FDIC covered loans and its PCI loan portfolio at December 31, 2015.
| PCI loans | Non-PCI | Total loans |
FDIC covered | $ 150,338 | $ 26,982 | $ 177,320 |
not covered | 60,190 | 2,356,266 | 2,416,456 |
Total | $ 210,528 | $ 2,383,248 | $ 2,593,776 |
4
The table below summarizes the Company’s total PCI loans, both covered and not covered by FDIC loss share arrangements. It also shows the difference between the unpaid principal balance and the carrying balance (book balance) at December 31, 2015.
| unpaid |
|
|
|
| principal | carrying |
|
|
| balance | balance | difference | percentage |
FDIC covered PCI loans | $193,550 | $ 150,338 | ($43,212) | 22% |
PCI loans not covered | 79,873 | 60,190 | (19,683) | 25% |
Total PCI loans | $273,423 | $ 210,528 | ($62,895) | 23% |
The table below summarizes the Company’s total loans covered by FDIC loss share arrangements, both PCI loans and non-PCI loans. It also shows the difference between the unpaid principal balance and the carrying balance (book balance) at December 31, 2015.
| unpaid |
|
|
|
| principal | carrying |
|
|
| balance | balance | difference | percentage |
FDIC covered PCI loans | $193,550 | $150,338 | ($43,212) | 22% |
FDIC covered, non-PCI loans | 27,367 | 26,982 | (385) | 1% |
Total FDIC covered loans | $220,917 | $177,320 | ($43,597) | 20% |
The table below summarizes the remaining ten loss share agreements by acquired bank and by term of the related loss share period at December 31, 2015.
|
|
|
|
|
| est rem | percentage |
|
| Loss | Unpaid |
|
|
| life of | of losses | end of |
| Share | Principal | Carrying | Difference (2) | loans in | reimbursable | loss share | |
| Term | Balance | Balance | $ | % | years(1) | from FDIC | period |
First Commercial Bank | 5 yrs | $61,597 | $55,048 | ($6,549) | 11% | 1.9 | 70%/30%/75% | Jan-16 |
First Guaranty Bank | 5 yrs | 43,584 | 30,430 | (13,154) | 30% | 2.7 | 80% | Jan-17 |
Central FL State Bank | 5 yrs | 9,274 | 7,005 | (2,269) | 24% | 2.6 | 80% | Jan-17 |
Subtotal |
| 114,455 | 92,483 | (21,972) | 19% | 2.2 |
|
|
|
|
|
|
|
|
|
|
|
Olde Cypress | 10 yrs | 25,918 | 22,904 | (3,014) | 12% | 5.3 | 80% | Jul-20 |
Comm Bank Bartow | 10 yrs | 13,131 | 9,733 | (3,398) | 26% | 8.5 | 80% | Aug-20 |
Independent Nat'l Bank | 10 yrs | 16,027 | 11,655 | (4,372) | 27% | 5.9 | 80% | Aug-20 |
Haven Trust Bank | 10 yrs | 3,697 | 2,775 | (922) | 25% | 3.5 | 70%/0%/70% | Sep-20 |
First Commercial Bank | 10 yrs | 8,262 | 7,444 | (818) | 10% | 2.6 | 70%/30%/75% | Jan-21 |
First Guaranty Bank | 10 yrs | 34,928 | 26,850 | (8,078) | 23% | 5.9 | 80% | Jan-22 |
Central FL State Bank | 10 yrs | 4,499 | 3,476 | (1,023) | 23% | 4.5 | 80% | Jan-22 |
Subtotal |
| 106,462 | 84,837 | (21,625) | 20% | 5.6 |
|
|
|
|
|
|
|
|
|
|
|
Total |
| $220,917 | $177,320 | ($43,597) | 20% | 3.8 |
|
|
| (1) | This represents an estimate of the weighted average remaining life or timing of the estimated future cash flows as of December 31, 2015. |
| (2) | Represents the dollar amount difference between the carrying value, or book value, of the loans and the unpaid principal balance (“UPB”), and the dollar amount difference as a percentage of the UPB. |
The Company’s total IA at December 31, 2015 was $25,795 of which $4,250 represents a receivable from the FDIC for estimated future loss reimbursements, and $21,545 represents previously estimated loss reimbursements that are no longer expected. This amount is now expected to be paid
5
(and/or has been paid) by the borrower (or realized upon the sale of OREO) instead of a reimbursement from the FDIC. At December 31, 2015, the $21,545 previously estimated reimbursements from the FDIC is expected to be written off as amortization expense (negative accretion) in the Company’s non-interest income as summarized below.
Period |
|
| Year |
|
1Q16 | $ 3,305 |
| 2017 | $ 3,875 |
2Q16 | 2,582 |
| 2018 | 2,876 |
3Q16 | 2,242 |
| 2019 | 2,364 |
4Q16 | 2,101 |
| 2020 thru 2022 | 2,200 |
|
|
| Total | $ 21,545 |
The table above is based on the Company’s most recent quarterly updated projections of estimated future losses, cash flows and timing of cash flows. The above amounts are subject to change, and have changed in past quarters, primarily due to the FDIC covered loan pools performing better than previously estimated. A summary of the activity in the Company’s IA account during the twelve month period ending December 31, 2015 is presented in the table below.
Balance at 12/31/14 | $49,054 |
Amortization, net (excludes clawback) | (16,282) |
Indemnification revenue | 1,900 |
Indemnification of foreclosure expenses | (4,001) |
Proceeds received from FDIC | (4,662) |
Net recovery of loan pool(s) impairments | (214) |
Balance 12/31/15 | $25,795 |
The table below summarizes the Company’s loan mix over the most recent five quarter ends.
Loan mix (unaudited)
At quarter ended: | 12/31/15 | 9/30/15 | 6/30/15 | 3/31/15 | 12/31/14 |
Loans |
|
|
|
|
|
Real estate loans |
|
|
|
|
|
Residential | $647,496 | $634,106 | $620,797 | $604,811 | $589,068 |
Commercial | 1,254,782 | 1,234,383 | 1,203,639 | 1,154,682 | 1,132,933 |
Land, development and construction loans | 105,276 | 100,200 | 96,020 | 85,186 | 79,002 |
Total real estate loans | 2,007,554 | 1,968,689 | 1,920,456 | 1,844,679 | 1,801,003 |
Commercial loans | 307,321 | 297,389 | 301,615 | 297,442 | 294,493 |
Consumer and other loans | 67,500 | 65,397 | 61,145 | 58,484 | 56,334 |
Total loans before unearned fees and costs | 2,382,375 | 2,331,475 | 2,283,216 | 2,200,605 | 2,151,830 |
Unearned fees and costs | 873 | 378 | 411 | 790 | 929 |
Total Non-PCI loans (note 1) | 2,383,248 | 2,331,853 | 2,283,627 | 2,201,395 | 2,152,759 |
PCI loans |
|
|
|
|
|
Real estate loans |
|
|
|
|
|
Residential | 86,104 | 92,243 | 96,674 | 101,365 | 102,009 |
Commercial | 105,629 | 119,379 | 126,058 | 131,270 | 140,977 |
Land, development and construction loans | 15,548 | 16,851 | 21,546 | 24,294 | 24,032 |
Total real estate loans | 207,281 | 228,473 | 244,278 | 256,929 | 267,018 |
Commercial loans | 2,771 | 2,848 | 2,735 | 5,615 | 8,953 |
Consumer and other loans | 476 | 457 | 516 | 724 | 795 |
Total PCI loans (note 2) | 210,528 | 231,778 | 247,529 | 263,268 | 276,766 |
|
|
|
|
|
|
Total Loans | $2,593,776 | $2,563,631 | $2,531,156 | $2,464,663 | $2,429,525 |
6
note 1: | Included in the $2,383,248 Non-PCI loans at December 31, 2015 are $26,982 that are covered by FDIC loss sharing agreements the Company acquired pursuant to its June 1, 2014 acquisition of FSB. |
note 2: | Included in the $210,528 PCI loans at December 31, 2015 are $150,338 of loans that are covered by FDIC loss sharing agreements and $60,190 are not covered. |
CREDIT QUALITY AND ALLOWANCE FOR LOAN LOSSES
During the quarter, excluding PCI loans, the Company recorded a loan loss provision expense of $484 and charge-offs net of recoveries of $927, resulting in a decrease in the allowance for loan losses (excluding PCI loans) of $443 as shown in the table below.
With regard to PCI loans, the Company recorded a loan loss provision expense of $59 resulting in an increase in the allowance for loan losses on PCI loans of $59. See the table “Allowance for loan losses” for additional information.
The allowance for loan losses (“ALLL") was $22,264 at December 31, 2015 compared to $22,648 at September 30, 2015, a decrease of $384. This decrease is the result of the aggregate effect of a $311 decrease in general loan loss allowance, $132 decrease in the specific loan loss allowance related to impaired loans and a $59 increase in the loan loss allowance related to PCI loans accounted for pursuant to ASC Topic 310-30. The changes in the Company’s ALLL components between December 31, 2015 and September 30, 2015 are summarized in the table below.
| Dec 31, 2015 |
| Sept 30, 2015 |
| increase (decrease) | ||||||
| loan | ALLL |
|
| loan | ALLL |
|
| loan | ALLL |
|
| balance | balance | % |
| balance | balance | % |
| balance | balance |
|
Originated loans | $1,770,747 | $ 18,351 | 1.04% |
| $1,694,866 | $ 17,979 | 1.06% |
| $ 75,881 | $ 372 | (2) bps |
Impaired loans | 23,175 | 1,080 | 4.66% |
| 21,858 | 1,212 | 5.54% |
| 1,317 | (132) | (88) bps |
subtotal | 1,793,922 | 19,431 | 1.08% |
| 1,716,724 | 19,191 | 1.12% |
| 77,198 | 240 | (4) bps |
Acquired loans | 589,326 | 2,712 |
|
| 615,129 | 3,395 |
|
| (25,803) | (683) |
|
Non-PCI loans | 2,383,248 | 22,143 |
|
| 2,331,853 | 22,586 |
|
| 51,395 | (443) |
|
PCI loans | 210,528 | 121 |
|
| 231,778 | 62 |
|
| (21,250) | 59 |
|
Total loans | $2,593,776 | $22,264 |
|
| $2,563,631 | $22,648 |
|
| $ 30,145 | $(384) |
|
The general loan loss allowance (non-impaired loans) relating to originated loans increased by $372 resulting primarily from an increase in loans outstanding less a decrease resulting from a mixture of decreases and increases in the Company’s various two year historical loss factors and qualitative factors.
The general loan loss allowance (non-impaired loans) relating to acquired loans decreased by $683 resulting from both a decrease in loans outstanding and net decreases in loss factors due to management’s estimates of potential incurred losses based on performance since acquisition date. The loans also have an unamortized acquisition date fair value adjustment equal to $9,354 as of December 31, 2015.
The specific loan loss allowance (impaired loans) is the aggregate of the results of individual analyses prepared for each one of the impaired loans, excluding PCI loans. Total impaired loans at December 31, 2015 are equal to $23,175. Approximately $13,718 of the Company’s impaired loans (59%) are accruing performing loans. This group of impaired loans is not included in the Company’s non-performing loans or non-performing assets categories.
7
PCI loans, including those covered by FDIC loss sharing agreements, are accounted for pursuant to ASC Topic 310-30. PCI loan pools are evaluated for impairment each quarter. If a pool is impaired, an allowance for loan loss is recorded.
Management believes the Company’s allowance for loan losses is adequate at December 31, 2015. However, management recognizes that many factors can adversely impact various segments of the Company’s market and customers, and therefore there is no assurance as to the amount of losses or probable losses which may develop in the future. The table below summarizes the changes in allowance for loan losses during the previous five quarters.
|
|
|
|
| |
as of or for the quarter ending | 12/31/15 | 9/30/15 | 6/30/15 | 3/31/15 | 12/31/14 |
Loans, excluding PCI loans |
|
|
|
| |
Allowance at beginning of period | $ 22,586 | $ 22,818 | $ 20,842 | $ 19,384 | $ 19,035 |
Charge-offs | (1,266) | (893) | (783) | (949) | (506) |
Recoveries | 339 | 657 | 429 | 466 | 645 |
Net (charge-offs) recoveries | (927) | (236) | (354) | (483) | 139 |
Provision for loan losses | 484 | 4 | 2,330 | 1,941 | 210 |
Allowance at end of period for loans |
|
|
|
|
|
other than PCI loans | $ 22,143 | $ 22,586 | $ 22,818 | $ 20,842 | $ 19,384 |
|
|
|
|
|
|
PCI loans |
|
|
|
| |
Allowance at beginning of period | $ 62 | $ 116 | $ 138 | $ 514 | $ 807 |
Charge-offs | --- | (50) | --- | (77) | (101) |
Recoveries | --- | --- | --- | --- | --- |
Net charge-offs | --- | (50) | --- | (77) | (101) |
Provision (recovery) for loan losses | 59 | (4) | (22) | (299) | (192) |
Allowance at end of period for |
|
|
|
|
|
PCI loans | $ 121 | $ 62 | $ 116 | $ 138 | $ 514 |
Total allowance at end of period | $ 22,264 | $ 22,648 | $ 22,934 | $ 20,980 | $ 19,898 |
8
The following table summarizes the Company’s loan portfolio and related allowance for loan losses as a percentage of the loan portfolio segment presented as of the end of the previous five quarters.
(unaudited)
For the quarter ended: | 12/31/15 | 9/30/15 | 6/30/15 | 3/31/15 | 12/31/14 |
Troubled debt restructure (“TDRs”) (note 1) | $ 15,127 | $ 15,204 | $ 15,659 | $ 14,666 | $ 15,066 |
Impaired loans that were not TDRs | 8,048 | 6,654 | 7,187 | 7,516 | 10,184 |
Total impaired loans | 23,175 | 21,858 | 22,846 | 22,182 | 25,250 |
Originated non-impaired loans | 1,770,747 | 1,694,866 | 1,615,315 | 1,488,536 | 1,407,781 |
Acquired non-impaired loans | 589,326 | 615,129 | 645,466 | 690,677 | 719,728 |
Total Non-PCI loans | 2,383,248 | 2,331,853 | 2,283,627 | 2,201,395 | 2,152,759 |
Total PCI loans | 210,528 | 231,778 | 247,529 | 263,268 | 276,766 |
Total loans | $2,593,776 | $2,563,631 | $2,531,156 | $2,464,663 | $2,429,525 |
ALLL for Non-PCI loans |
|
|
| ||
General loan loss allowance- originated loans | $ 18,351 | $ 17,979 | $ 17,392 | $ 16,745 | $ 16,587 |
Specific loan loss allowance- impaired loans | 1,080 | 1,212 | 1,836 | 1,101 | 1,115 |
General loan loss allowance- acquired loans | 2,712 | 3,395 | 3,590 | 2,996 | 1,682 |
Total allowance for loan losses (note 2) | $ 22,143 | $ 22,586 | $ 22,818 | $ 20,842 | $ 19,384 |
ALLL as a percentage of period end loans: |
|
|
|
|
|
Originated non-impaired loans | 1.04% | 1.06% | 1.08% | 1.12% | 1.18% |
Impaired loans | 4.66% | 5.54% | 8.04% | 4.96% | 4.42% |
subtotal | 1.08% | 1.12% | 1.17% | 1.18% | 1.24% |
|
|
|
|
|
|
Acquired non-impaired loans | 0.46% | 0.55% | 0.56% | 0.43% | 0.23% |
Total loans (note 2) | 0.93% | 0.97% | 1.00% | 0.95% | 0.90% |
note 1: The Company has approximately $15,127 of TDRs. Of this amount $10,254 are performing pursuant to their modified terms, and $4,873 are not performing and have been placed on non-accrual status and included in non performing loans (“NPLs”). Current accounting standards require TDRs to be included in our impaired loans, whether they are performing or not performing. Only non performing TDRs are included in NPLs.
note 2: Excludes PCI loans.
The Company defines non-performing loans (“NPLs”) as non-accrual loans plus loans past due 90 days or more and still accruing interest. NPLs do not include PCI loans. PCI loans are accounted for pursuant to ASC Topic 310-30. NPLs as a percentage of total Non-PCI loans were 0.87% at December 31, 2015 compared to 0.96% at September 30, 2015.
Non-performing assets (“NPAs”) (which the Company defines as NPLs, as defined above, plus (a) OREO (i.e. real estate acquired through foreclosure or deed in lieu of foreclosure), excluding OREO covered by FDIC loss share agreement; and (b) other repossessed assets that are not real estate, and are not covered by FDIC loss share agreement) were $22,545 at December 31, 2015, compared to $25,549 at September 30, 2015. NPAs as a percentage of total assets was 0.56% at December 31, 2015 compared to 0.65% at September 30, 2015. NPAs as a percentage of loans plus OREO and other repossessed assets, excluding PCI loans and OREO covered by FDIC loss share agreements, was 0.95% at December 31, 2015 compared to 1.09% at September 30, 2015.
9
The table below summarizes selected credit quality data for the periods indicated.
Selected credit quality ratios (unaudited) |
|
|
|
| |
As of or for the quarter ended: | 12/31/15 | 9/30/15 | 6/30/15 | 3/31/15 | 12/31/14 |
Non-accrual loans (note 1) | $20,833 | $22,450 | $25,028 | $26,857 | $25,595 |
Past due loans 90 days or more |
|
|
|
|
|
and still accruing interest (note 1) | --- | --- | --- | --- | --- |
Total non-performing loans (“NPLs”) (note 1) | 20,833 | 22,450 | 25,028 | 26,857 | 25,595 |
Other real estate owned (“OREO”) (note 2) | 1,567 | 2,993 | 4,691 | 7,586 | 8,896 |
Repossessed assets other than real estate (note 1) | 145 | 106 | 172 | 139 | 87 |
Total non-performing assets (“NPAs”) (note 2) | $22,545 | $25,549 | $29,891 | $34,582 | $34,578 |
OREO covered by FDIC loss share agreements: |
|
|
|
|
|
80% covered | 4,828 | 3,661 | 6,531 | 4,716 | 7,264 |
75% covered | --- | --- | --- | --- | 606 |
70% covered | --- | 297 | 249 | 249 | 1,755 |
30% covered | 4,742 | 3,729 | 5,224 | 8,563 | 9,779 |
0% covered | 59 | --- | --- | --- | --- |
Total non-performing assets including |
|
|
|
|
|
FDIC covered OREO | $32,174 | $33,236 | $41,895 | $48,110 | $53,982 |
Non-performing loans as percentage of total |
|
|
|
|
|
loans excluding PCI loans | 0.87% | 0.96% | 1.10% | 1.22% | 1.19% |
Non-performing assets as percentage of total assets |
|
|
|
|
|
Excluding FDIC covered OREO | 0.56% | 0.65% | 0.77% | 0.89% | 0.92% |
Including FDIC covered OREO | 0.80% | 0.85% | 1.08% | 1.24% | 1.43% |
Non-performing assets as percentage of loans and |
|
|
|
|
|
OREO plus other repossessed assets (note 1) |
|
|
|
|
|
Excluding FDIC covered OREO | 0.95% | 1.09% | 1.31% | 1.57% | 1.60% |
Including FDIC covered OREO | 1.34% | 1.42% | 1.82% | 2.16% | 2.47% |
Loans past due 30 thru 89 days and accruing interest |
|
|
|
|
|
as a percentage of total loans (note 1) | 0.62% | 0.67% | 0.51% | 0.61% | 0.61% |
Net charge-offs (recovery) (note 1) | $927 | $236 | $354 | $483 | $(139) |
Net charge-offs (recovery) as a percentage |
|
|
|
|
|
of average loans for the period (note 1) | 0.04% | 0.01% | 0.02% | 0.02% | (0.01%) |
Net charge-offs (recovery) as a percentage of average |
|
|
|
|
|
loans for the period on an annualized basis (note 1) | 0.16% | 0.04% | 0.06% | 0.09% | (0.03%) |
Allowance for loan losses as percentage of NPLs (note 1) | 106% | 101% | 91% | 78% | 76% |
note 1: Excludes PCI loans.
note 2: Excludes OREO covered by FDIC loss share agreements.
NET INTEREST MARGIN (“NIM”)
The Company’s NIM decreased from 4.44% in 3Q15 to 4.37% in 4Q15. The primary reason for this decrease was due to the mix of interest earning assets between the two quarters. Higher average balances in lower yielding assets, such as taxable securities and federal funds sold, and lower average balance in higher yielding assets, such as PCI loans, in the current quarter compared to the prior quarter.
The average yield on loans, excluding PCI loans, increased from 4.38% in 3Q15 to 4.42% in 4Q15. During 4Q15 there were certain payoffs of acquired purchased loans that were not PCI loans, and the resulting remaining unamortized fair value mark was recognized as interest income in 4Q15. If this had not occurred, the yield in 4Q15 would have been approximately 4.30%, which was 8 bps lower than the yield in the prior quarter, primarily due to the average interest rates on new loan production, which
10
has been averaging over the past several quarters in the 3.75% range. The Company expects the yield on loans, excluding PCI loans, to continue trending lower until the average portfolio yields approach the average yields of new loan production.
If these certain loan payoffs, described above, had not occurred, the NIM for the current quarter would have approximated 4.29% (versus the 4.37% actual).
The average yield on PCI loans during the current quarter was 16.78% compared to 16.27% during 3Q15. The PCI loans historically have performed better than previously expected. Initial loss expectations have been adjusted downward during subsequent quarterly estimates of future cash flows. The results have been higher yields over the remaining life of the related loan pools.
If the PCI loans were producing a yield similar to the Company’s non-PCI loans, the NIM during the current quarter and previous quarter would have been approximately 3.61%. However, total PCI loans have a legal balance outstanding equal to $273,423 and a book balance equal to $210,528 resulting in a difference, or discount, of approximately $62,895, or 23%. The estimated remaining life of the expected cash flows is approximately 3.8 years at December 31, 2015. As such, management expects several years of favorable yield, albeit balances will be decreasing over time.
The table below summarizes yields and costs by various interest earning asset and interest bearing liability account types for the current quarter, the previous calendar quarter and the same quarter last year.
Yield and cost table (unaudited)
|
| 4Q15 |
|
|
| 3Q15 |
|
|
| 4Q14 |
|
| average | interest | avg |
| average | interest | avg |
| average | interest | avg |
| balance | inc/exp | rate |
| balance | inc/exp | rate |
| balance | inc/exp | rate |
Loans (TEY)* | $2,363,060 | $26,337 | 4.42% |
| $2,306,751 | $25,465 | 4.38% |
| $ 2,139,263 | $25,055 | 4.65% |
PCI loans | 222,685 | 9,420 | 16.78% |
| 241,393 | 9,898 | 16.27% |
| 291,862 | 8,607 | 11.70% |
Taxable securities | 737,057 | 4,480 | 2.41% |
| 676,892 | 3,895 | 2.28% |
| 569,045 | 3,623 | 2.53% |
Tax -exempt securities (TEY) | 85,329 | 1,076 | 5.00% |
| 90,376 | 1,107 | 4.86% |
| 54,636 | 656 | 4.76% |
Fed funds sold and other | 211,112 | 403 | 0.76% |
| 165,927 | 355 | 0.85% |
| 177,391 | 459 | 1.03% |
Tot. interest earning assets(TEY) | $3,619,243 | $41,716 | 4.57% |
| $3,481,339 | $40,720 | 4.64% |
| $3,232,197 | $38,400 | 4.71% |
|
|
|
|
|
|
|
|
|
|
|
|
Interest bearing deposits | $2,072,838 | $1,351 | 0.26% |
| $2,033,045 | $1,339 | 0.26% |
| $2,033,431 | $1,523 | 0.30% |
Fed funds purchased | 203,413 | 186 | 0.36% |
| 173,575 | 150 | 0.34% |
| 71,545 | 34 | 0.19% |
Other borrowings | 27,061 | 36 | 0.53% |
| 31,356 | 51 | 0.65% |
| 27,849 | 50 | 0.71% |
Corporate debentures | 24,070 | 246 | 4.05% |
| 24,026 | 244 | 4.03% |
| 23,891 | 241 | 4.00% |
Total interest bearing liabilities | $2,327,382 | $1,819 | 0.31% |
| $2,262,002 | $1,784 | 0.31% |
| $2,156,716 | $1,848 | 0.34% |
|
|
|
|
|
|
|
|
|
|
|
|
Net Interest Spread (TEY) |
|
| 4.26% |
|
|
| 4.33% |
|
|
| 4.37% |
Net Interest Margin (TEY) |
|
| 4.37% |
|
|
| 4.44% |
|
|
| 4.49% |
*TEY = tax equivalent yield
11
The table below summarizes the Company’s yields on interest earning assets and costs of interest bearing liabilities over the prior five quarters.
Five quarter trend of yields and costs (unaudited) |
|
|
|
| |
For the quarter ended: | 12/31/15 | 9/30/15 | 6/30/15 | 3/31/15 | 12/31/14 |
Yield on loans (TEY)* | 4.42% | 4.38% | 4.59% | 4.57% | 4.65% |
Yield on PCI loans | 16.78% | 16.27% | 17.75% | 14.85% | 11.70% |
Yield on securities (TEY) | 2.68% | 2.59% | 2.53% | 2.75% | 2.72% |
Yield on fed funds sold and other | 0.76% | 0.85% | 0.87% | 0.76% | 1.03% |
Yield on total interest earning assets | 4.51% | 4.57% | 4.87% | 4.70% | 4.67% |
Yield on total interest earning assets (TEY) | 4.57% | 4.64% | 4.93% | 4.75% | 4.71% |
Cost of interest bearing deposits | 0.26% | 0.26% | 0.27% | 0.29% | 0.30% |
Cost of fed funds purchased | 0.36% | 0.34% | 0.33% | 0.30% | 0.19% |
Cost of other borrowings | 0.53% | 0.65% | 0.62% | 0.65% | 0.71% |
Cost of corporate debentures | 4.05% | 4.03% | 4.03% | 4.02% | 4.00% |
Cost of interest bearing liabilities | 0.31% | 0.31% | 0.32% | 0.33% | 0.34% |
Net interest margin (TEY) | 4.37% | 4.44% | 4.72% | 4.53% | 4.49% |
Cost of total deposits | 0.16% | 0.17% | 0.17% | 0.19% | 0.19% |
*TEY = tax equivalent yield
The table below summarizes selected financial ratios over the prior five quarters.
Selected financial ratios (unaudited) |
|
|
|
|
|
As of or for the quarter ended: | 12/31/15 | 9/30/15 | 6/30/15 | 3/31/15 | 12/31/14 |
Return on average assets (annualized) | 1.02% | 1.01% | 1.02% | 0.96% | 0.78% |
Net operating income return on |
|
|
|
|
|
average assets (annualized) | 1.06% | 1.02% | 1.02% | 0.97% | 0.81% |
Return on average equity (annualized) | 8.52% | 8.28% | 8.49% | 8.10% | 6.46% |
Return on average tangible equity (annualized) | 10.47% | 10.23% | 10.42% | 10.00% | 8.15% |
Loan / deposit ratio | 80.7% | 80.5% | 80.7% | 78.3% | 78.6% |
Stockholders’ equity (to total assets) | 12.2% | 12.2% | 12.1% | 11.9% | 12.0% |
Common tangible equity (to total tangible assets) | 10.2% | 10.1% | 10.0% | 9.8% | 9.8% |
Tier 1 capital (to average assets) | 10.5% | 10.6% | 10.4% | 10.0% | 10.1% |
Efficiency ratio, including correspondent banking (note 1) | 60.6% | 63.1% | 60.9% | 65.5% | 70.5% |
Efficiency ratio, excluding correspondent banking (note 2) | 59.2 % | 61.0 % | 60.1 % | 64.0 % | 69.4 % |
Common equity per common share | $10.79 | $10.55 | $10.31 | $10.20 | $9.98 |
Common tangible equity per common share | $8.82 | $8.57 | $8.31 | $8.18 | $7.95 |
note 1: Numerator equals non-interest expense less non-recurring expenses (e.g. merger costs, bank property impairment, etc.) less intangible amortization (both CDI and Trust intangible) less credit related expenses. Denominator equals net interest income on a taxable equivalent yield basis (“TEY”) before the provision for loan losses plus non-interest income less non-recurring income (e.g. gain on sale of securities available for sale, etc.) less FDIC income related to losses on the sales of covered OREO properties and impairment of loan pool(s) covered by FDIC loss share arrangements.
note 2: Numerator starts with the same numerator as in “note 1”, less correspondent bank non-interest expense, including indirect expense allocations. Denominator starts with the same denominator as in “note 1”, less correspondent bank net interest income and less correspondent bank non-interest income.
12
During the quarter, the Company’s total deposits increased by $29,989. Time deposits decreased by $12,058 and non-time deposits increased by $42,047.
The cost of interest bearing deposits in the current quarter was 0.26%, the same as in the prior quarter. The overall cost of total deposits (i.e. includes non-interest bearing checking accounts) during the current quarter was 0.16% compared to 0.17% in the prior quarter. The table below summarizes the Company’s deposit mix over the periods indicated.
Deposit mix (unaudited)
For the quarter ended: | 12/31/15 | 9/30/15 | 6/30/15 | 3/31/15 | 12/31/14 |
Checking accounts |
|
|
|
|
|
Non-interest bearing | $1,133,138 | $1,145,474 | $1,127,591 | $1,112,282 | $1,048,874 |
Interest bearing | 679,714 | 621,582 | 621,473 | 623,370 | 607,359 |
Savings deposits | 241,605 | 249,292 | 240,528 | 242,782 | 231,039 |
Money market accounts | 738,301 | 734,363 | 706,647 | 711,903 | 716,956 |
Time deposits | 422,420 | 434,478 | 440,276 | 459,035 | 487,812 |
Total deposits | $3,215,178 | $3,185,189 | $3,136,515 | $3,149,372 | $3,092,040 |
|
|
|
|
|
|
Non time deposits as percentage of total deposits | 87% | 86% | 86% | 85% | 84% |
Time deposits as percentage of total deposits | 13% | 14% | 14% | 15% | 16% |
Total deposits excluding held for sale | 100% | 100% | 100% | 100% | 100% |
13
Presented below are condensed consolidated balance sheets and average balance sheets for the periods indicated.
Condensed Consolidated Balance Sheets (unaudited) |
|
|
| ||
For the quarter ended: | 12/31/15 | 9/30/15 | 6/30/15 | 3/31/15 | 12/31/14 |
Cash and due from banks | $ 50,902 | $ 42,624 | $ 50,317 | $ 59,295 | $ 52,067 |
Fed funds sold and Fed Res Bank deposits | 101,580 | 185,807 | 104,805 | 197,046 | 106,346 |
Trading securities | 2,107 | 1,266 | 1,508 | 1,017 | 3,420 |
Investment securities, available for sale | 604,739 | 490,458 | 532,440 | 520,247 | 517,457 |
Investment securities, held to maturity | 272,840 | 248,310 | 250,482 | 228,870 | 237,362 |
Loans held for sale | 1,529 | 806 | 1,656 | 522 | 1,251 |
210,528 | 231,778 | 247,529 | 263,268 | 276,766 | |
Loans | 2,383,248 | 2,331,853 | 2,283,627 | 2,201,395 | 2,152,759 |
Allowance for loan losses | (22,264) | (22,648) | (22,934) | (20,980) | (19,898) |
FDIC indemnification assets | 25,795 | 28,596 | 36,157 | 41,594 | 49,054 |
Premises and equipment, net | 101,821 | 102,675 | 101,079 | 100,526 | 98,848 |
Goodwill | 76,739 | 76,739 | 76,739 | 76,739 | 76,739 |
Core deposit intangible | 12,164 | 12,744 | 13,186 | 13,789 | 14,417 |
Bank owned life insurance | 85,890 | 85,316 | 84,736 | 84,137 | 83,544 |
OREO covered by FDIC loss share agreements | 9,629 | 7,687 | 12,004 | 13,528 | 19,404 |
OREO not covered by FDIC loss share agreements | 1,567 | 2,993 | 4,691 | 7,586 | 8,896 |
Deferred income tax asset, net | 46,220 | 47,516 | 49,704 | 48,502 | 49,587 |
Other assets | 57,683 | 58,552 | 45,483 | 51,491 | 48,850 |
TOTAL ASSETS | $ 4,022,717 | $ 3,933,072 | $ 3,873,209 | $ 3,888,572 | $ 3,776,869 |
|
|
|
|
|
|
Deposits | $ 3,215,178 | $ 3,185,189 | $ 3,136,515 | $ 3,149,372 | $ 3,092,040 |
Federal funds purchased | 200,250 | 161,303 | 171,219 | 187,443 | 151,992 |
Other borrowings | 76,565 | 52,561 | 64,203 | 55,032 | 50,939 |
Other liabilities | 40,210 | 54,207 | 32,836 | 33,660 | 29,421 |
Common stockholders’ equity | 490,514 | 479,812 | 468,436 | 463,065 | 452,477 |
TOTAL LIABILITIES AND |
|
|
|
|
|
STOCKHOLDERS’ EQUITY | $ 4,022,717 | $ 3,933,072 | $ 3,873,209 | $ 3,888,572 | $ 3,776,869 |
|
|
|
|
|
|
|
|
|
|
|
|
Condensed Consolidated Average Balance Sheets (unaudited) |
|
|
| ||
For quarter ended: | 12/31/15 | 9/30/15 | 6/30/15 | 3/31/15 | 12/31/14 |
Federal funds sold and other | $ 211,112 | $ 165,927 | $ 170,139 | $ 211,247 | $ 177,391 |
Security investments | 822,386 | 767,268 | 764,359 | 751,819 | 623,681 |
PCI loans | 222,685 | 241,393 | 257,581 | 271,135 | 291,862 |
Loans | 2,363,060 | 2,306,751 | 2,237,178 | 2,172,621 | 2,139,263 |
Allowance for loan losses | (22,078) | (22,890) | (20,107) | (20,980) | (20,406) |
All other assets | 458,087 | 455,067 | 479,645 | 468,645 | 501,143 |
TOTAL ASSETS | $ 4,055,252 | $ 3,913,516 | $ 3,888,795 | $ 3,854,487 | $ 3,712,934 |
|
|
|
|
|
|
Deposits- interest bearing | $ 2,072,838 | $ 2,033,045 | $ 2,014,726 | $ 2,034,864 | $ 2,033,431 |
Deposits- non interest bearing | 1,194,763 | 1,136,788 | 1,127,639 | 1,098,236 | 1,074,288 |
Federal funds purchased | 203,413 | 173,575 | 184,525 | 176,109 | 71,545 |
Other borrowings | 51,131 | 55,382 | 58,920 | 54,683 | 51,740 |
Other liabilities | 48,969 | 39,740 | 36,138 | 32,373 | 35,024 |
Stockholders’ equity | 484,138 | 474,986 | 466,847 | 458,222 | 446,906 |
TOTAL LIABILITIES AND |
|
|
|
|
|
STOCKHOLDERS’ EQUITY | $ 4,055,252 | $ 3,913,516 | $ 3,888,795 | $ 3,854,487 | $ 3,712,934 |
14
Condensed Consolidated Earnings Statement (unaudited)
For quarter ended: | 12/31/15 | 9/30/15 | 6/30/15 | 3/31/15 | 12/31/14 |
|
|
|
|
|
|
Interest income: |
|
|
|
|
|
Loans | $35,508 | $35,134 | $36,786 | $34,268 | $33,505 |
Investments | 5,187 | 4,623 | 4,470 | 4,821 | 4,055 |
Federal funds sold and other | 403 | 355 | 369 | 396 | 459 |
Total interest income | 41,098 | 40,112 | 41,625 | 39,485 | 38,019 |
|
|
|
|
|
|
Interest expense: |
|
|
|
|
|
Deposits | 1,351 | 1,339 | 1,369 | 1,447 | 1,523 |
Securities sold under agreement to repurchase | 32 | 51 | 54 | 49 | 50 |
Federal funds purchased | 190 | 150 | 154 | 132 | 34 |
Corporate debentures | 246 | 244 | 241 | 237 | 241 |
Total interest expense | 1,819 | 1,784 | 1,818 | 1,865 | 1,848 |
|
|
|
|
|
|
Net interest income | 39,279 | 38,328 | 39,807 | 37,620 | 36,171 |
Provision for loan losses | 543 | --- | 2,308 | 1,642 | 18 |
Net interest income after loan loss provision | 38,736 | 38,328 | 37,499 | 35,978 | 36,153 |
|
|
|
|
|
|
Non interest income (see page 16) | 9,666 | 8,130 | 10,573 | 9,081 | 7,535 |
|
|
|
|
|
|
Non interest expense: |
|
|
|
|
|
Salaries, wages and employee benefits | 18,977 | 18,916 | 19,925 | 19,580 | 18,710 |
Occupancy expense | 2,360 | 2,586 | 2,566 | 2,445 | 2,686 |
Depreciation of premises and equipment | 1,442 | 1,438 | 1,403 | 1,433 | 1,483 |
Data processing expense | 1,069 | 1,153 | 1,127 | 1,330 | 1,466 |
Legal, audit and other professional fees | 750 | 779 | 690 | 735 | 816 |
Amortization of intangibles | 616 | 615 | 640 | 666 | 694 |
Credit related expense (see page 17) | 309 | 439 | 522 | 50 | 299 |
FDIC credit related expenses (see page 17) | 997 | (46) | 625 | (567) | 369 |
Merger and acquisition related expenses | 524 | 169 | --- | --- | 848 |
Branch closure and efficiency initiatives | --- | --- | --- | --- | (417) |
Impairment/sales bank property held for sale, net | 94 | 12 | (16) | 641 | --- |
Lease termination recovery | --- | --- | --- | (597) | --- |
All other expenses | 4,948 | 4,794 | 5,056 | 4,887 | 5,137 |
Total non interest expenses | 32,086 | 30,855 | 32,538 | 30,603 | 32,091 |
|
|
|
|
|
|
Income before provision for income taxes | 16,316 | 15,603 | 15,534 | 14,456 | 11,597 |
Provision for income taxes | 5,920 | 5,687 | 5,656 | 5,308 | 4,316 |
Net income | $10,396 | $9,916 | $9,878 | $9,148 | $7,281 |
|
|
|
|
|
|
Earnings per share (diluted) | $0.23 | $0.22 | $0.21 | $0.20 | $0.16 |
15
NON INTEREST INCOME AND NON INTEREST EXPENSES
The table below summarizes the Company’s non-interest income for the periods indicated.
Quarterly Condensed Consolidated Non Interest Income (unaudited) |
|
|
| ||
For the quarter ended: | 12/31/15 | 9/30/15 | 6/30/15 | 3/31/15 | 12/31/14 |
Correspondent banking and capital markets division (1) | $ 5,254 | $ 4,943 | $ 7,334 | $ 5,694 | $ 4,876 |
Other correspondent banking related revenue (2) | 987 | 992 | 1,253 | 1,106 | 919 |
Wealth management related revenue | 913 | 940 | 990 | 970 | 925 |
Service charges on deposit accounts | 2,576 | 2,488 | 2,420 | 2,261 | 2,451 |
Debit, prepaid, ATM and merchant card related fees | 1,730 | 1,659 | 1,823 | 1,701 | 1,637 |
BOLI income | 574 | 580 | 599 | 593 | 608 |
Other service charges and fees | 419 | 641 | 444 | 439 | 638 |
Gain on sale of securities available for sale | --- | 4 | --- | --- | --- |
Subtotal | $12,453 | $12,247 | $14,863 | $12,764 | $12,054 |
FDIC indemnification asset – amortization (see explanation below) | (3,420) | (4,144) | (4,649) | (4,350) | (5,599) |
FDIC indemnification income | 633 | 27 | 359 | 667 | 1,080 |
Total non-interest income | $9,666 | $8,130 | $10,573 | $9,081 | $7,535 |
note 1: | Includes gross commissions earned on bond sales, fees from hedging services, loan brokering fees and related consulting fees. The fee income in this category is based on sales volume in any particular period and is therefore volatile between comparable periods. |
note 2: | Includes fees from safe-keeping activities, bond accounting services, asset/liability consulting services, international wires, clearing and corporate checking account services and other correspondent banking related revenue and fees. The fees included in this category are less volatile than those described above in note 1. |
The FDIC indemnification asset (“IA”) is producing amortization (versus accretion) due to reductions in the estimated losses in the FDIC covered PCI loan portfolio. To the extent current projected losses in the covered PCI loan portfolio are less than originally projected losses, the related projected reimbursements from the FDIC contemplated in the IA are less, which produces a negative income accretion in non-interest income. This event generally corresponds to the increase in yields in the FDIC covered PCI loan portfolio, although there is not perfect correlation. Higher expected cash flows (i.e. less expected future losses) on the loan side of the equation is accreted into interest income over the life of the related loan pool. The lower expected reimbursement from the FDIC is amortized over the lesser of the remaining life of the related loan pool(s) or the remaining term of the loss share period.
When a FDIC covered OREO property is sold at a loss, the loss is included in non-interest expense as loss on sale of OREO, and the reimbursement for the respective loss share percentage is recorded as FDIC indemnification income and included in non-interest income. In addition, the FDIC loss share reimbursement percentage of any related loan pool impairments also are reflected in this non-interest income account.
16
The table below summarizes the Company’s non-interest expense for the periods indicated.
Quarterly Condensed Consolidated Non Interest Expense (unaudited) |
|
|
| ||
For the quarter ended: | 12/31/15 | 9/30/15 | 6/30/15 | 3/31/15 | 12/31/14 |
Employee salaries and wages | $14,344 | $14,200 | $15,130 | $14,535 | $13,866 |
Employee incentive/bonus compensation accrued | 1,854 | 1,719 | 1,749 | 1,200 | 1,578 |
Employee equity based compensation expense | 866 | 775 | 812 | 830 | 542 |
Deferred compensation expense | 148 | 157 | 153 | 161 | 157 |
Health insurance and other employee benefits | 983 | 1,240 | 1,312 | 1,330 | 1,556 |
Payroll taxes | 734 | 825 | 893 | 1,403 | 785 |
401K employer contributions | 358 | 416 | 408 | 435 | 319 |
Other employee related expenses | 314 | 328 | 237 | 238 | 438 |
Incremental direct cost of loan origination | (624) | (744) | (769) | (552) | (531) |
Total salaries, wages and employee benefits | 18,977 | 18,916 | 19,925 | 19,580 | 18,710 |
|
|
|
|
|
|
Loss (gain) on sale of OREO | 39 | 31 | 74 | (547) | (126) |
Loss (gain) on sale of FDIC covered OREO | 491 | (313) | (47) | (981) | (541) |
Valuation write down of OREO | 22 | 65 | 109 | 61 | 313 |
Valuation write down of FDIC covered OREO | 169 | 172 | 281 | 328 | 703 |
(Gain) loss on repossessed assets other than real estate | (7) | 15 | --- | (1) | 11 |
Foreclosure and repossession related expenses | 255 | 328 | 339 | 503 | 101 |
Foreclosure and repo expense, FDIC (note 1) | 337 | 95 | 391 | 86 | 207 |
Total credit related expenses | 1,306 | 393 | 1,147 | (551) | 668 |
|
|
|
|
|
|
Occupancy expense | 2,360 | 2,586 | 2,566 | 2,445 | 2,686 |
Depreciation of premises and equipment | 1,442 | 1,438 | 1,403 | 1,433 | 1,483 |
Supplies, stationary and printing | 338 | 382 | 351 | 365 | 383 |
Marketing expenses | 668 | 630 | 481 | 538 | 746 |
Data processing expenses | 1,069 | 1,153 | 1,127 | 1,330 | 1,466 |
Legal, auditing and other professional fees | 750 | 779 | 690 | 735 | 816 |
Bank regulatory related expenses | 606 | 774 | 883 | 910 | 909 |
Postage and delivery | 337 | 348 | 336 | 368 | 394 |
ATM and debit card related expenses | 495 | 515 | 450 | 433 | 510 |
Amortization of intangibles | 616 | 615 | 640 | 666 | 694 |
Internet and telephone banking | 538 | 545 | 550 | 534 | 493 |
Correspondent account and Federal Reserve charges | 155 | 163 | 169 | 168 | 163 |
Conferences, seminars, education and training | 142 | 110 | 151 | 117 | 132 |
Director fees | 176 | 164 | 173 | 179 | 244 |
Travel expenses | 117 | 148 | 97 | 84 | 99 |
Other expenses | 1,376 | 1,015 | 1,415 | 1,225 | 1,064 |
Subtotal | 31,468 | 30,674 | 32,554 | 30,559 | 31,660 |
Impairment/sales bank property held for sale | 94 | 12 | (16) | 641 | --- |
Lease termination recovery | --- | --- | --- | (597) | --- |
Merger and acquisition related expenses | 524 | 169 | --- | --- | 848 |
Branch closure and efficiency initiatives | --- | --- | --- | --- | (417) |
Total non- interest expense | $32,086 | $30,855 | $32,538 | $30,603 | $32,091 |
note 1: These are foreclosure and repossession related expenses related to FDIC covered assets, and are shown net of FDIC reimbursable amounts pursuant to FDIC loss share agreements.
17
Explanation of Certain Unaudited Non-GAAP Financial Measures
This press release contains financial information determined by methods other than Generally Accepted Accounting Principles (“GAAP”). The financial highlights provide reconciliations between GAAP interest income, net interest income and tax equivalent basis interest income and net interest income, as well as total stockholders’ equity and tangible common equity. It also reconciles net income and net operating income. Management uses these non-GAAP financial measures in its analysis of the Company’s performance and believes these presentations provide useful supplemental information, and a clearer understanding of the Company’s performance. The Company believes the non-GAAP measures enhance investors’ understanding of the Company’s business and performance. These measures are also useful in understanding performance trends and facilitate comparisons with the performance of other financial institutions. The limitations associated with operating measures are the risk that persons might disagree as to the appropriateness of items comprising these measures and that different companies might calculate these measures differently. The Company provides reconciliations between GAAP and these non-GAAP measures. These disclosures should not be considered an alternative to GAAP.
Reconciliation of GAAP to non-GAAP Measures. All amounts are in thousands except per share data (unaudited):
| 4Q15 | 3Q15 | 4Q14 |
|
|
|
|
|
|
|
|
Interest income, as reported (GAAP) | $41,098 | $40,112 | $38,019 |
|
|
tax equivalent adjustments | 618 | 608 | 381 |
|
|
Interest income (tax equivalent) | $41,716 | $40,720 | $38,400 |
|
|
|
|
|
|
|
|
Net interest income, as reported (GAAP) | $39,279 | $38,328 | $36,171 |
|
|
tax equivalent adjustments | 618 | 608 | 381 |
|
|
Net interest income (tax equivalent) | $39,897 | $38,936 | $36,552 |
|
|
|
|
|
|
|
|
| 12/31/15 | 9/30/15 | 6/30/15 | 3/31/15 | 12/31/14 |
Total stockholders' equity (GAAP) | $490,514 | $479,812 | $468,436 | $463,065 | $452,477 |
Goodwill | (76,739) | (76,739) | (76,739) | (76,739) | (76,739) |
Core deposit intangible | (12,164) | (12,744) | (13,186) | (13,789) | (14,417) |
Trust intangible | (837) | (873) | (909) | (946) | (984) |
Tangible common equity | $400,774 | $389,456 | $377,602 | $371,591 | $360,337 |
| 4Q15 | 3Q15 | 2Q15 | 1Q15 | 4Q14 |
Net income (GAAP) | $10,396 | $9,916 | $9,878 | $9,148 | $7,281 |
Exclude gain on sale of AFS securities | --- | (4) | --- | --- | --- |
Add back merger and acquisition |
|
|
|
|
|
related expenses | 524 | 169 | --- | --- | 848 |
Add back branch closure and |
|
|
|
|
|
efficiency initiatives | --- | --- | --- | --- | (417) |
Add back impairment/sales relating to |
|
|
|
|
|
bank property held for sale, net | 94 | 12 | (16) | 641 | --- |
Subtract lease termination recovery | --- | --- | --- | (597) | --- |
Tax effected using the effective tax |
|
|
|
|
|
rate for the period presented | (224) | (65) | 6 | (16) | (161) |
Net operating income | $10,790 | $10,028 | $9,868 | $9,176 | $7,551 |
Average diluted shares outstanding |
|
|
|
|
|
during the period presented | 45,935 | 45,826 | 45,737 | 45,658 | 45,506 |
Net operating income per share | $0.23 | $0.22 | $0.22 | $0.20 | $0.17 |
18
About CenterState Banks, Inc.
The Company, headquartered in Davenport, Florida between Orlando and Tampa, is a financial holding company with one nationally chartered bank, CenterState Bank of Florida, N.A. Presently, the Company operates through its network of 57 branch banking offices located in 20 counties throughout Florida, providing traditional deposit and lending products and services to its commercial and retail customers. The Company also provides correspondent banking and capital market services to approximately 600 community banks nationwide.
For additional information contact Ernest S. Pinner (Chairman), John C. Corbett (CEO), James J. Antal (CFO) or Stephen D. Young (Treasurer) at 863-419-7750.
“Safe Harbor” Statement under the Private Securities Litigation Reform Act of 1995:
Some of the statements in this report constitute forward-looking statements, within the meaning of the Securities Act of 1933 and the Securities Exchange Act of 1934. These statements related to future events, other future financial and operating performance, costs, revenues, economic conditions in our markets, loan performance, credit risks, collateral values and credit conditions, or business strategies, including expansion and acquisition activities and may be identified by terminology such as “may,” “will,” “should,” “expects,” “scheduled,” “plans,” “intends,” “anticipates,” “believes,” “estimates,” “potential,” or “continue” or the negative of such terms or other comparable terminology. Actual events or results may differ materially. In evaluating these statements, you should specifically consider the factors described throughout this report. We cannot assure you that future results, levels of activity, performance or goals will be achieved, and actual results may differ from those set forth in the forward looking statements.
Forward-looking statements, with respect to our beliefs, plans, objectives, goals, expectations, anticipations, estimates and intentions, involve known and unknown risks, uncertainties and other factors, which may be beyond our control, and which may cause the actual results, performance or achievements of the Company or the Bank to be materially different from future results, performance or achievements expressed or implied by such forward-looking statements. You should not expect us to update any forward-looking statements. All written or oral forward-looking statements attributable to us are expressly qualified in their entirety by this cautionary notice, including, without limitation, those risks and uncertainties described in our annual report on Form 10-K for the year ended December 31, 2014, and otherwise in our SEC reports and filings.
19