Exhibit 99.1
FOR IMMEDIATE RELEASE October 18, 2016 |
|
|

CenterState Banks, Inc. Announces
Third Quarter 2016 Operating Results
(all amounts are in thousands of dollars, except per share data, or unless otherwise noted)
WINTER HAVEN, FL. – October 18, 2016 - CenterState Banks, Inc. (Nasdaq: CSFL) reported net income of $15,384 or diluted earnings per share (“EPS”) of $0.32 for the third quarter of 2016, compared to reported net income of $9,916 or $0.22 EPS during the same period in 2015.
|
|
|
|
| 3Q16 |
| 3Q15 |
Return on average assets (annualized) | 1.22% |
| 1.01% |
Return on average tangible equity (annualized) | 14.5% |
| 10.2% |
Efficiency ratio | 55% |
| 63% |
|
|
|
|
CURRENT QUARTER HIGHLIGHTS
| • | 16% annualized increase in loans during the current quarter when the decline in Purchased Credit Impaired (“PCI”) loans is excluded |
| • | 23% decline in Non-Performing Assets (“NPAs”) during the current quarter |
| • | 13% increase in deposit related service charges during the current quarter as a result of new product changes on personal and business accounts |
In addition, the Company announced today it entered into a definitive agreement to acquire Platinum Bank Holding Company in West-Central Florida:
| o | Acquired balances: |
| • | Assets: $584 million |
| • | Loans: $452 million |
| • | Deposits: $495 million |
| o | Pro-forma balances: |
| • | Assets: $5.6 billion |
| • | Loans: $3.7 billion |
| • | Deposits: $4.5 billion |
| o | Mid-single digit EPS accretion fully phased-in 2018. |
| o | Pro-forma CSFL will be #1 community bank by deposit market share in the Lakeland-Winter Haven MSA and #3 community bank by deposit market share in the Tampa-St. Petersburg MSA. |
1
Quarterly condensed consolidated income statements (unaudited) are shown below for the periods indicated.
Quarterly Condensed Consolidated Statements of Operations (unaudited)
For the quarter ended: | 9/30/16 | 6/30/16 | 3/31/16 | 12/31/15 | 9/30/15 |
Interest income | $ 47,703 | $ 47,309 | $ 43,498 | $ 41,098 | $ 40,112 |
Interest expense | 2,384 | 2,312 | 2,023 | 1,819 | 1,784 |
Net interest income | 45,319 | 44,997 | 41,475 | 39,279 | 38,328 |
Provision for loan losses | 1,090 | 925 | 511 | 484 | 4 |
Provision (recovery) for loan losses- PCI loans | 185 | (14) | (1) | 59 | (4) |
Net interest income after loan loss provision | 44,044 | 44,086 | 40,965 | 38,736 | 38,328 |
|
|
|
|
|
|
Correspondent banking and capital markets division- income | 7,528 | 9,291 | 8,775 | 6,241 | 5,935 |
Gain on sale of securities available for sale | 13 | --- | --- | --- | 4 |
FDIC- IA amortization (negative accretion) (1) | --- | --- | (1,166) | (3,420) | (4,144) |
FDIC- revenue (1) | --- | --- | 96 | 633 | 27 |
Gain on early extinguishment of debt | --- | --- | 308 | --- | --- |
All other non-interest income | 8,073 | 7,680 | 6,548 | 6,212 | 6,308 |
Total non interest income | 15,614 | 16,971 | 14,561 | 9,666 | 8,130 |
|
|
|
|
|
|
Credit related expenses | 187 | 611 | 359 | 1,306 | 393 |
Correspondent banking and capital markets division-expense | 5,456 | 6,159 | 5,782 | 5,094 | 5,063 |
Merger and acquisition related expenses | --- | --- | 11,172 | 524 | 169 |
Impairment of Branch real estate held for sale | 549 | (38) | 456 | 94 | 12 |
Termination of FDIC loss share agreements (1) | --- | --- | 17,560 | --- | --- |
All other non-interest expense | 30,136 | 30,317 | 27,524 | 25,068 | 25,218 |
Total non interest expense | 36,328 | 37,049 | 62,853 | 32,086 | 30,855 |
|
|
|
|
|
|
Income (loss) before income tax | 23,330 | 24,008 | (7,327) | 16,316 | 15,603 |
Income tax provision (benefit) | 7,946 | 8,274 | (2,523) | 5,920 | 5,687 |
NET INCOME (LOSS) | $ 15,384 | $ 15,734 | $ (4,804) | $ 10,396 | $ 9,916 |
Net income (loss) allocated to common shares | $ 15,324 | $ 15,672 | $ (4,804) | $ 10,343 | $ 9,862 |
|
|
|
|
|
|
Earnings (loss) per share (basic) (GAAP) | $ 0.32 | $ 0.33 | $ (0.10) | $ 0.23 | $ 0.22 |
Earnings (loss) per share (diluted) (GAAP) | $ 0.32 | $ 0.32 | $ (0.10) | $ 0.23 | $ 0.22 |
Operating income per share (Non-GAAP) (2) | $ 0.32 | $ 0.32 | $ 0.30 | $ 0.23 | $ 0.22 |
|
|
|
|
|
|
Average common shares outstanding (basic) | 47,821 | 47,782 | 46,343 | 45,237 | 45,200 |
Average common shares outstanding (diluted) | 48,603 | 48,454 | 46,343 | 45,935 | 45,826 |
Common shares outstanding at period end | 48,017 | 47,996 | 47,943 | 45,459 | 45,469 |
note 1: | In February 2016, the Company terminated all existing loss share agreements with the FDIC. As a result, the Company wrote off the remaining indemnification asset and the claw back liability, received cash from the FDIC, and recognized a loss on the transaction of approximately $17,560 during the first quarter. |
note 2: | This non-gaap metric represents gaap net income excluding certain income and expense items net of the effective tax rate for the period presented. Items excluded are gains on sales of securities held for sale, acquisition and merger related expenses, expenses related to the termination of FDIC loss share agreements and impairment charges on the real estate of several branches closed and transferred to held for sale, divided by the average diluted common shares outstanding. A reconciliation table is presented on page 17, Explanation of Certain Unaudited Non-GAAP Financial Measures. |
2
Loans, excluding PCI loans and loans acquired in the two Homestead bank transactions, increased $244,840 during the first nine months of the year, an annualized growth rate of approximately 14%. Total new loans originated during the current quarter approximated $274.8 million, of which $232.2 million were funded. About 60% of funded loan origination was commercial real estate (“CRE”), 19% commercial and industrial (“C&I”), 14% single family residential, 3% land, development & construction and 4% were all other.
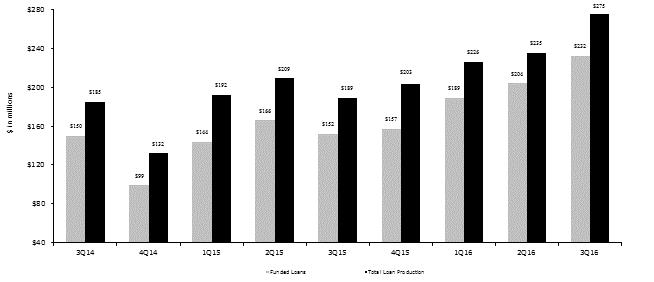
Approximately 30% of the funded loan production was floating rate, 25% were other variable rate and 45% were fixed rate. The loan origination pipeline is approximately $378 million at September 30, 2016 compared to $365 million at June 30, 2016. The graph above summarizes total loan production and funded loan production over the past nine quarters.
3
DEPOSIT ACTIVITY
During the quarter, the Company’s total deposits decreased by $76,202, or approximately 7% on an annualized basis. The deposit decline in the current quarter was concentrated in the correspondent and prepaid card division, along with a continued decline in retail time deposits. The overall cost of total deposits (i.e. includes non-interest bearing checking accounts) during the current quarter was 0.18% compared to 0.17% during the previous quarter. The table below summarizes the Company’s deposit mix over the periods indicated.
Deposit mix (unaudited) |
|
|
|
|
|
For the quarter ended: | 9/30/16 | 6/30/16 | 3/31/16 | 12/31/15 | 9/30/15 |
Checking accounts |
|
|
|
|
|
Non-interest bearing | $1,406,030 | $1,486,600 | $1,489,530 | $1,133,138 | $1,145,474 |
Interest bearing | 814,123 | 763,614 | 756,129 | 679,714 | 621,582 |
Savings deposits | 352,547 | 347,631 | 341,864 | 241,605 | 249,292 |
Money market accounts | 903,697 | 927,997 | 872,219 | 738,301 | 734,363 |
Time deposits | 579,537 | 606,294 | 632,425 | 422,420 | 434,478 |
Total deposits | $4,055,934 | $4,132,136 | $4,092,167 | $3,215,178 | $3,185,189 |
|
|
|
|
|
|
Non time deposits as percentage of total deposits | 86% | 85% | 85% | 87% | 86% |
Time deposits as percentage of total deposits | 14% | 15% | 15% | 13% | 14% |
Total deposits | 100% | 100% | 100% | 100% | 100% |
NET INTEREST MARGIN (“NIM”)
The Company’s NIM decreased from 4.14% in 2Q16 to 4.12% in 3Q16, primarily due to lower yields during the quarter related to non-PCI loans and securities compared to the prior quarter.
The yield on loans, excluding PCI loans, decreased 7 basis points (“bps”) compared to the prior quarter as the yields generated on significant recent loan production (3.9% during the current quarter and 3.7% during the first nine months of 2016) continues to compress the overall loan yield. Some additional increase in the mortgage backed securities principal paydowns resulted in accelerated amortization of premiums, which also reduced the investment yields compared to the prior quarter. Partially offsetting the items noted above, which are compressing the NIM, was a reduction in average lower fed funds sold and other balances compared to the prior quarter.
If the PCI loans were producing income based on the contractual terms at the time of acquisition, the NIM’s during the current quarter and previous quarter would have been approximately 3.69% and 3.70%, respectively, a 1 bp decrease between the linked quarters.
4
The table below summarizes yields and costs by various interest earning asset and interest bearing liability account types for the current quarter, the previous calendar quarter and the same quarter last year.
Yield and cost table (unaudited)
|
| 3Q16 |
|
|
| 2Q16 |
|
|
| 3Q15 |
|
| average | interest | avg |
| average | interest | avg |
| average | interest | avg |
| balance | inc/exp | rate |
| balance | inc/exp | rate |
| balance | inc/exp | rate |
Loans (TEY)* | $3,037,333 | $34,071 | 4.46% |
| $2,949,651 | $33,255 | 4.53% |
| $ 2,306,751 | $25,465 | 4.38% |
PCI loans | 207,406 | 7,795 | 14.95% |
| 225,584 | 8,047 | 14.35% |
| 241,393 | 9,898 | 16.27% |
Taxable securities | 900,514 | 4,693 | 2.07% |
| 879,774 | 4,767 | 2.18% |
| 676,892 | 3,895 | 2.28% |
Tax -exempt securities (TEY) | 134,576 | 1,581 | 4.67% |
| 121,737 | 1,423 | 4.70% |
| 90,376 | 1,107 | 4.86% |
Fed funds sold and other | 187,906 | 512 | 1.08% |
| 272,635 | 622 | 0.92% |
| 165,927 | 355 | 0.85% |
Tot. interest earning assets(TEY) | $4,467,735 | $48,652 | 4.33% |
| $4,449,381 | $48,114 | 4.35% |
| $3,481,339 | $40,720 | 4.64% |
|
|
|
|
|
|
|
|
|
|
|
|
Interest bearing deposits | $2,678,638 | $1,821 | 0.27% |
| $2,626,668 | $1,740 | 0.27% |
| $2,033,045 | $1,339 | 0.26% |
Fed funds purchased | 181,037 | 238 | 0.52% |
| 188,663 | 244 | 0.52% |
| 173,575 | 150 | 0.34% |
Other borrowings | 28,847 | 27 | 0.37% |
| 33,315 | 34 | 0.41% |
| 31,356 | 51 | 0.65% |
Corporate debentures | 25,852 | 298 | 4.59% |
| 25,811 | 294 | 4.58% |
| 24,026 | 244 | 4.03% |
Total interest bearing liabilities | $2,914,374 | $2,384 | 0.33% |
| $2,874,457 | $2,312 | 0.32% |
| $2,262,002 | $1,784 | 0.31% |
|
|
|
|
|
|
|
|
|
|
|
|
Net Interest Spread (TEY) |
|
| 4.00% |
|
|
| 4.03% |
|
|
| 4.33% |
Net Interest Margin (TEY) |
|
| 4.12% |
|
|
| 4.14% |
|
|
| 4.44% |
*TEY = tax equivalent yield (Non-GAAP)
The table below summarizes the Company’s yields on interest earning assets and costs of interest bearing liabilities over the prior five quarters.
Five quarter trend of yields and costs (unaudited) |
|
|
|
| |
For the quarter ended: | 9/30/16 | 6/30/16 | 3/31/16 | 12/31/15 | 9/30/15 |
Yield on loans (TEY)* | 4.46% | 4.53% | 4.46% | 4.42% | 4.38% |
Yield on PCI loans | 14.95% | 14.35% | 16.66% | 16.78% | 16.27% |
Yield on securities (TEY) | 2.41% | 2.49% | 2.83% | 2.68% | 2.59% |
Yield on fed funds sold and other | 1.08% | 0.92% | 0.96% | 0.76% | 0.85% |
Yield on total interest earning assets | 4.25% | 4.28% | 4.49% | 4.51% | 4.57% |
Yield on total interest earning assets (TEY) | 4.33% | 4.35% | 4.56% | 4.57% | 4.64% |
Cost of interest bearing deposits | 0.27% | 0.27% | 0.26% | 0.26% | 0.26% |
Cost of fed funds purchased | 0.52% | 0.52% | 0.53% | 0.36% | 0.34% |
Cost of other borrowings | 0.37% | 0.41% | 0.42% | 0.53% | 0.65% |
Cost of corporate debentures | 4.59% | 4.58% | 4.66% | 4.05% | 4.03% |
Cost of interest bearing liabilities | 0.33% | 0.32% | 0.32% | 0.31% | 0.31% |
Net interest margin (TEY) | 4.12% | 4.14% | 4.35% | 4.37% | 4.44% |
Cost of total deposits | 0.18% | 0.17% | 0.17% | 0.16% | 0.17% |
*TEY = tax equivalent yield (Non-GAAP)
5
The table below summarizes selected financial ratios over the prior five quarters.
Selected financial ratios (unaudited) | |||||
As of or for the quarter ended: | 9/30/16 | 6/30/16 | 3/31/16 | 12/31/15 | 9/30/15 |
Return on average assets (annualized) | 1.22% | 1.27% | (0.44)% | 1.02% | 1.01% |
Operating return on |
|
|
|
|
|
average assets (annualized) (note 3) | 1.25% | 1.27% | 1.30% | 1.06% | 1.02% |
Return on average equity (annualized) | 11.21% | 11.96% | (3.88)% | 8.52% | 8.28% |
Return on average tangible equity (annualized) | 14.46% | 15.61% | (4.95)% | 10.47% | 10.23% |
Operating return on |
|
|
|
|
|
average tangible equity (annualized) (note 3) | 14.80% | 15.58% | 14.56% | 10.86% | 10.35% |
Loan / deposit ratio | 81.2% | 77.3% | 76.9% | 80.7% | 80.5% |
Stockholders’ equity (to total assets) | 11.0% | 10.8% | 10.5% | 12.2% | 12.2% |
Common tangible equity (to total tangible assets) | 8.8% | 8.5% | 8.2% | 10.2% | 10.1% |
Tier 1 capital (to average assets) | 9.0% | 8.7% | 9.6% | 10.5% | 10.6% |
Efficiency ratio, including correspondent banking (note 1) | 55.0% | 56.8% | 57.9% | 60.6% | 63.1% |
Efficiency ratio, excluding correspondent banking (note 2) | 53.5% | 56.1% | 57.9 % | 59.2 % | 61.0 % |
Common equity per common share | $11.51 | $11.21 | $10.84 | $10.79 | $10.55 |
Common tangible equity per common share | $8.96 | $8.64 | $8.25 | $8.82 | $8.57 |
note 1: | Numerator equals non-interest expense less non-recurring expenses (e.g. merger costs, bank property impairment, etc.) less intangible amortization (both CDI and Trust intangible) less credit related expenses. Denominator equals net interest income on a tax equivalent yield basis (“TEY”) before the provision for loan losses plus non-interest income less non-recurring income (e.g. gain on sale of securities available for sale, etc.) less FDIC income related to losses on the sales of covered OREO properties and impairment of loan pool(s) covered by FDIC loss share arrangements. |
note 2: | Numerator starts with the same numerator as in “note 1”, less correspondent bank non-interest expense, including indirect expense allocations. Denominator starts with the same denominator as in “note 1”, less correspondent bank net interest income and less correspondent bank non-interest income. |
note 3: | See reconciliation table presented on page 17, Explanation of Certain Unaudited Non-GAAP Financial Measures, related to operating income. |
6
LOAN MIX
The table below summarizes the Company’s loan mix over the most recent five quarter ends.
At quarter ended: | 9/30/2016 | 6/30/2016 | 3/31/2016 | 12/31/2015 | 9/30/2015 |
Originated Loans |
|
|
|
|
|
Real estate loans |
|
|
|
|
|
Residential | $534,070 | $517,861 | $507,835 | $491,149 | $472,685 |
Commercial | 1,019,458 | 910,687 | 824,702 | 781,419 | 740,877 |
Land, development and construction loans | 94,896 | 100,584 | 99,605 | 91,817 | 85,116 |
Total real estate loans | 1,648,424 | 1,529,132 | 1,432,142 | 1,364,385 | 1,298,678 |
Commercial loans | 339,938 | 301,557 | 290,658 | 251,855 | 236,526 |
Consumer and other loans | 80,391 | 74,398 | 69,528 | 67,026 | 64,913 |
Total loans before unearned fees and costs | 2,068,753 | 1,905,087 | 1,792,328 | 1,683,266 | 1,600,117 |
Unearned fees and costs | 519 | 479 | 796 | 873 | 378 |
Total originated loans | 2,069,272 | 1,905,566 | 1,793,124 | 1,684,139 | 1,600,495 |
|
|
|
|
|
|
Acquired Loans (1) |
|
|
|
|
|
Real estate loans |
|
|
|
|
|
Residential | 272,419 | 284,580 | 291,886 | 156,347 | 161,421 |
Commercial | 662,917 | 682,693 | 705,877 | 473,363 | 493,506 |
Land, development and construction loans | 25,435 | 24,797 | 31,541 | 13,459 | 15,084 |
Total real estate loans | 959,287 | 992,070 | 1,029,304 | 643,169 | 670,011 |
Commercial loans | 62,775 | 75,638 | 82,970 | 55,466 | 60,863 |
Consumer and other loans | 4,376 | 4,834 | 6,307 | 474 | 484 |
Total acquired loans | 1,027,922 | 1,072,542 | 1,118,581 | 699,109 | 731,358 |
|
|
|
|
|
|
PCI loans |
|
|
|
|
|
Real estate loans |
|
|
|
|
|
Residential | 74,825 | 78,371 | 82,595 | 86,104 | 92,243 |
Commercial | 106,482 | 120,255 | 127,354 | 105,629 | 119,379 |
Land, development and construction loans | 10,928 | 11,649 | 19,912 | 15,548 | 16,851 |
Total real estate loans | 192,235 | 210,275 | 229,861 | 207,281 | 228,473 |
Commercial loans | 4,649 | 5,974 | 6,020 | 2,771 | 2,848 |
Consumer and other loans | 404 | 610 | 635 | 476 | 457 |
Total PCI loans | 197,288 | 216,859 | 236,516 | 210,528 | 231,778 |
|
|
|
|
|
|
Total Loans | $3,294,482 | $3,194,967 | $3,148,221 | $2,593,776 | $2,563,631 |
| (1) | Acquired loans include the non-PCI loans purchased pursuant to the following acquisitions: |
| o | Branch and loan transaction with TD Bank (year 2011); |
| o | Federal Trust Bank acquisition (year 2011); |
| o | Gulfstream Business Bank acquisition (year 2014); |
| o | First Southern Bank acquisition (year 2014); |
| o | Community Bank of South Florida acquisition (year 2016); and |
| o | Hometown of Homestead Banking Company (year 2016). |
7
PURCHASED CREDIT IMPAIRED (“PCI”) LOANS
The table below compares the unpaid principal balance and the carrying balance (book balance) of the Company’s total PCI loans at September 30, 2016.
| Unpaid |
|
|
|
| Principal | Carrying |
|
|
| Balance | Balance | Difference | Percentage |
Total PCI loans | $266,008 | $197,288 | ($68,720) | 26% |
CREDIT QUALITY AND ALLOWANCE FOR LOAN LOSSES
During the quarter, the Company recorded a loan loss provision expense of $1,275 and recoveries net of charge-offs of $52, resulting in an increase in the allowance for loan losses of $1,327 as shown in the table below.
The total allowance for loan losses (“ALLL") was $25,499 at September 30, 2016 compared to $24,172 at June 30, 2016, an increase of $1,327. This increase is the result of the aggregate effect of: (1) a net increase of $1,714 in the allowance for loan losses on originated loans ($1,744 increase in general loan loss allowance and decrease of $30 in specific loan loss allowance); (2) a net decrease of $506 in acquired loans ($179 decrease in general loan loss allowance and $327 decrease in specific loan loss allowance); and (3) an increase of $119 in the allowance for loan losses on PCI loans. The changes in the Company’s ALLL components between September 30, 2016 and June 30, 2016 are summarized in the table below (unaudited).
| September 30, 2016 |
| June 30, 2016 |
| increase (decrease) | ||||||
| loan | ALLL |
|
| loan | ALLL |
|
| loan | ALLL |
|
| balance | balance | % |
| balance | balance | % |
| balance | balance |
|
Originated loans | $2,051,764 | $ 21,426 | 1.04% |
| $1,885,349 | $ 19,682 | 1.04% |
| $ 166,415 | $ 1,744 | --- bps |
Impaired originated loans | 17,508 | 693 | 3.96% |
| 20,217 | 723 | 3.58% |
| (2,709) | (30) | 38 bps |
Total originated loans | 2,069,272 | 22,119 | 1.07% |
| 1,905,566 | 20,405 | 1.07% |
| 163,706 | 1,714 | --- bps |
|
|
|
|
|
|
|
|
|
|
|
|
Acquired loans (2) | 1,025,914 | 3,112 | 0.30% |
| 1,067,875 | 3,291 | 0.31% |
| (41,961) | (179) | (1) bps |
Impaired acquired loans (1) | 2,008 | 43 | 2.14% |
| 4,667 | 370 | 7.93% |
| (2,659) | (327) | (579)bps |
Total acquired loans | 1,027,922 | 3,155 | 0.31% |
| 1,072,542 | 3,661 | 0.34% |
| (44,620) | (506) | (3) bps |
|
|
|
|
|
|
|
|
|
|
|
|
Total non-PCI loans | 3,097,194 | 25,274 |
|
| 2,978,108 | 24,066 |
|
| 119,086 | 1,208 |
|
PCI loans | 197,288 | 225 |
|
| 216,859 | 106 |
|
| (19,571) | 119 |
|
Total loans | $3,294,482 | $25,499 |
|
| $3,194,967 | $24,172 |
|
| $99,515 | $1,327 |
|
| (1) | These are loans that were acquired as performing loans that subsequently became impaired. |
| (2) | Performing acquired loans recorded at estimated fair value on the related acquisition dates. The total net unamortized fair value adjustment at September 30, 2016 was approximately $16,787 or 1.6% of the aggregate outstanding related loan balances. Prior to March 31, 2016, the Company did not previously include loans acquired pursuant to the TD Bank and Federal Trust acquisitions that occurred in 2011. Acquired loans currently include performing loans acquired from the TD Bank acquisition (year 2011), the Federal Trust acquisition (year 2011), the Gulfstream Business Bank acquisition (year 2014), the First Southern Bank acquisition (year 2014), the Community Bank acquisition (year 2016) and the Hometown of Homestead Banking Company acquisition (year 2016). All prior periods have been reclassified to conform to this new presentation format. |
The general loan loss allowance (non-impaired loans) relating to originated loans increased by $1,744 resulting primarily from an increase in loans outstanding.
The general loan loss allowance (non-impaired loans) relating to acquired loans decreased by $179 resulting primarily from a decrease in loans outstanding, excluding the two bank acquisitions (Community Bank and Hometown of Homestead Banking Company) which occurred during the first quarter. At September 30, 2016 the loans acquired from these two acquisitions were equal to
8
approximately $421,590. These loans were recorded at estimated fair value at the March 1, 2016 acquisition date, and there is no allowance for loan losses associated with these loans as of September 30, 2016. The unamortized acquisition date fair value adjustment related to these loans at September 30, 2016 was approximately $8,218, or 1.9% of the related loan balances.
The specific loan loss allowance (impaired loans) for both originated loans and acquired loans is the aggregate of the results of individual analyses prepared for each one of the impaired loans, excluding PCI loans.
Total impaired loans at September 30, 2016 are equal to $19,516 ($17,508 originated impaired loans plus $2,008 acquired impaired loans). Approximately $10,528 of the Company’s impaired loans (54%) are accruing performing loans. This group of impaired loans is not included in the Company’s non-performing loans or non-performing assets categories. Included in impaired loans are $13,592 of troubled debt restructuings (“TDRs”). Of this amount $10,528 are performing pursuant to their modified terms, and $3,064 are not performing and have been placed on non-accrual status and included in non performing loans (“NPLs”). Accounting standards require TDRs to be included in our impaired loans, whether they are performing or not performing.
PCI loans are accounted for pursuant to ASC Topic 310-30. PCI loan pools are evaluated for impairment each quarter. If a pool is impaired, an allowance for loan loss is recorded.
Management believes the Company’s allowance for loan losses is adequate at September 30, 2016. The Company has recognized net recoveries over the last three quarters as focus has been placed on maximizing recoveries from charged-offs loans and judgements. However, management recognizes that many factors can adversely impact various segments of the Company’s market and customers, and therefore there is no assurance as to the amount of losses or probable losses which may develop in the future. The table below summarizes the changes in allowance for loan losses during the previous five quarters.
|
|
|
|
| |
as of or for the quarter ending | 9/30/16 | 6/30/16 | 3/31/16 | 12/31/15 | 9/30/15 |
Loans, excluding PCI loans |
|
|
|
| |
Allowance at beginning of period | $ 24,066 | $ 23,002 | $ 22,143 | $ 22,586 | $ 22,818 |
Charge-offs | (821) | (326) | (495) | (1,266) | (893) |
Recoveries | 939 | 465 | 843 | 339 | 657 |
Net recoveries (charge-offs) | 118 | 139 | 348 | (927) | (236) |
Provision for loan losses | 1,090 | 925 | 511 | 484 | 4 |
Allowance at end of period for loans |
|
|
|
|
|
other than PCI loans | $ 25,274 | $ 24,066 | $ 23,002 | $ 22,143 | $ 22,586 |
|
|
|
|
|
|
PCI loans |
|
|
|
| |
Allowance at beginning of period | $ 106 | $ 120 | $ 121 | $ 62 | $ 116 |
Charge-offs | (66) | --- | --- | --- | (50) |
Recoveries | --- | --- | --- | --- | --- |
Net charge-offs | (66) | --- | --- | --- | (50) |
(Recovery) provision for loan losses | 185 | (14) | (1) | 59 | (4) |
Allowance at end of period for |
|
|
|
|
|
PCI loans | $ 225 | $ 106 | $ 120 | $ 121 | $ 62 |
Total allowance at end of period | $ 25,499 | $ 24,172 | $ 23,122 | $ 22,264 | $ 22,648 |
9
The following table summarizes the Company’s loan portfolio and related allowance for loan losses as a percentage of the loan portfolio segment presented as of the end of the previous five quarters.
(unaudited) |
|
|
|
|
| |
For the quarter ended: | 9/30/16 | 6/30/16 | 3/31/16 | 12/31/15 | 9/30/15 | |
Troubled debt restructure (“TDRs”) (note 1) | $ 13,592 | $ 14,895 | $ 15,350 | $ 15,127 | $ 15,204 | |
Impaired loans that were not TDRs | 5,924 | 9,989 | 12,564 | 8,048 | 6,654 | |
Total impaired loans | 19,516 | 24,884 | 27,914 | 23,175 | 21,858 | |
Originated non-impaired loans | 2,051,764 | 1,885,349 | 1,768,628 | 1,664,056 | 1,580,791 | |
Acquired non-impaired loans | 1,025,914 | 1,067,875 | 1,115,163 | 696,017 | 729,204 | |
Total Non-PCI loans | 3,097,194 | 2,978,108 | 2,911,705 | 2,383,248 | 2,331,853 | |
Total PCI loans | 197,288 | 216,859 | 236,516 | 210,528 | 231,778 | |
Total loans | $3,294,482 | $3,194,967 | $3,148,221 | $2,593,776 | $2,563,631 | |
ALLL for Non-PCI loans |
|
|
| |||
General loan loss allowance- originated loans | $ 21,426 | $ 19,682 | $ 18,417 | $ 17,326 | $ 16,824 | |
General loan loss allowance- acquired loans | 3,112 | 3,291 | 3,501 | 3,737 | 4,550 | |
Specific loan loss allowance- impaired loans | 736 | 1,093 | 1,084 | 1,080 | 1,212 | |
Total allowance for loan losses (note 2) | $ 25,274 | $ 24,066 | $ 23,002 | $ 22,143 | $ 22,586 | |
ALLL as a percentage of period end loans: |
|
|
|
|
| |
Total Originated non-impaired loans | 1.04% | 1.04% | 1.04% | 1.04% | 1.06% | |
Total Acquired non-impaired loans (note 3) | 0.30% | 0.31% | 0.31% | 0.54% | 0.62% | |
Total impaired loans | 3.77% | 4.39% | 3.88% | 4.66% | 5.54% | |
note 1: | The Company has approximately $13,592 of TDRs. Of this amount $10,528 are performing pursuant to their modified terms, and $3,064 are not performing and have been placed on non-accrual status and included in non performing loans (“NPLs”). Current accounting standards require TDRs to be included in our impaired loans, whether they are performing or not performing. Only non performing TDRs are included in NPLs. |
note 2: | Excludes PCI loans. |
note 3: | Non-impaired loans acquired pursuant to the March 1, 2016 acquisition of Hometown of Homestead Banking Company and Community Bank of South Florida, Inc. are included in the 9/30/16 acquired loan balances in the table above. These loans were recorded at estimated fair value as of the acquisition date, and there is no related allowance for loan losses associated with these loans, resulting in an overall combined lower percentage when compared to previous quarter ends. |
The Company defines NPLs as non-accrual loans plus loans past due 90 days or more and still accruing interest. NPLs do not include PCI loans. PCI loans are accounted for pursuant to ASC Topic 310-30. NPLs as a percentage of total Non-PCI loans were 0.64% at September 30, 2016 compared to 0.84% at June 30, 2016.
Non-performing assets (“NPAs”) (which the Company defines as NPLs, as defined above, plus (a) OREO (i.e. real estate acquired through foreclosure or deed in lieu of foreclosure), and (b) other repossessed assets that are not real estate, were $28,879 at September 30, 2016, compared to $37,450 at June 30, 2016. The decline resulted from sales of properties reducing the OREO balances approximately $3.3 million and several large loan payoffs and an upgrade decreasing the nonperforming loans by approximately $5.3 million. NPAs as a percentage of total assets was 0.58% at September 30, 2016 compared to 0.75% at June 30, 2016. NPAs as a percentage of loans plus OREO and other repossessed assets, excluding PCI loans, was 0.93% at September 30, 2016 compared to 1.25% at June 30, 2016.
10
The table below summarizes selected credit quality data for the periods indicated.
Selected credit quality ratios (unaudited) |
|
|
|
| ||||
As of or for the quarter ended: | 9/30/16 | 6/30/16 | 3/31/16 | 12/31/15 | 9/30/15 | |||
Non-accrual loans (note 1) | $19,704 | $25,035 | $24,865 | $20,833 | $22,450 | |||
Past due loans 90 days or more |
|
|
|
|
| |||
and still accruing interest (note 1) | --- | --- | --- | --- | --- | |||
Total non-performing loans (“NPLs”) (note 1) | 19,704 | 25,035 | 24,865 | 20,833 | 22,450 | |||
Other real estate owned (“OREO”) | 9,005 | 12,311 | 15,937 | 11,196 | 10,680 | |||
Repossessed assets other than real estate (note 1) | 170 | 104 | 86 | 145 | 106 | |||
Total non-performing assets | $28,879 | $37,450 | $40,888 | $32,174 | $33,236 | |||
Non-performing loans as percentage of total |
|
|
|
|
| |||
loans excluding PCI loans | 0.64% | 0.84% | 0.85% | 0.87% | 0.96% | |||
Non-performing assets as percentage of total assets | 0.58% | 0.75% | 0.82% | 0.80% | 0.85% | |||
Non-performing assets as percentage of loans and |
|
|
|
|
| |||
OREO plus other repossessed assets (note 1) | 0.93% | 1.25% | 1.40% | 1.34% | 1.42% | |||
Loans past due 30 thru 89 days and accruing interest |
|
|
|
|
| |||
as a percentage of total loans (note 1) | 0.36% | 0.41% | 0.40% | 0.62% | 0.67% | |||
Net (recovery) charge-offs (note 1) | $(118) | $(139) | $(348) | $927 | $236 | |||
Net (recovery) charge-offs as a percentage |
|
|
|
|
| |||
of average loans for the period (note 1) | (0.00%) | (0.00%) | (0.01%) | 0.04% | 0.01% | |||
Net (recovery) charge-offs as a percentage of average |
|
|
|
|
| |||
loans for the period on an annualized basis (note 1) | (0.02%) | (0.02%) | (0.05%) | 0.16% | 0.04% | |||
Allowance for loan losses as percentage of NPLs (note 1) | 128% | 96% | 93% | 106% | 101% | |||
note 1: Excludes PCI loans.
11
CORRESPONDENT BANKING AND CAPITAL MARKETS SEGMENT
The condensed quarterly results of the Company’s correspondent banking and capital markets segment are presented below.
Quarterly Condensed Segment Information - Correspondent banking and capital markets division (unaudited) | |||||
For the quarter ended: | 9/30/16 | 6/30/16 | 3/31/16 | 12/31/15 | 9/30/15 |
Net interest income | $1,625 | $1,555 | $1,802 | $1,716 | $1,545 |
Provision for loan losses | 28 | (24) | (52) | (4) | 1 |
Total non-interest income (note 1) | 7,528 | 9,291 | 8,775 | 6,241 | 5,935 |
Total non-interest expense (note 2) | (5,456) | (6,159) | (5,782) | (5,094) | (5,063) |
Income tax provision | (1,437) | (1,799) | (1,830) | (1,103) | (934) |
Net income | $ 2,288 | $ 2,864 | $ 2,913 | $ 1,756 | $ 1,484 |
Contribution to diluted earnings per share | $ 0.05 | $ 0.06 | $ 0.06 | $ 0.04 | $ 0.03 |
|
|
|
|
|
|
Allocation of indirect expense net of |
|
|
|
|
|
inter-company earnings credit, net of |
|
|
|
|
|
income tax benefit (note 3) | $(244) | $(232) | $(340) | $(174) | $(304) |
Contribution to diluted earnings per share after |
|
|
|
|
|
deduction of allocated indirect expenses | $ 0.04 | $ 0.05 | $ 0.06 | $ 0.03 | $ 0.03 |
note 1: | The primary component in this line item is gross commissions earned on bond sales, fees from hedging services, loan brokering fees and related consulting fees which were $6,381, $8,049, $7,371, $5,254 and $4,943 for 3Q16, 2Q16, 1Q16, 4Q15 and 3Q15, respectively. The fee income in this category is based on sales volume in any particular period and is therefore volatile between comparable periods. The remaining non interest income items in this category, which are less volatile, include fees from safe-keeping activities, bond accounting services, asset/liability consulting related activities, international wires, clearing and corporate checking account services, and other correspondent banking related revenue and fees. |
note 2: | A significant portion of these expenses are variable in nature and are a derivative of the income from bond sales, hedging services, brokering loans sales and related consulting services identified in note 1 above. The variable expenses related to these fees identified in note 1 above were $2,908, $3,491, $3,352, $2,505 and $2,388 for 3Q16, 2Q16, 1Q16, 4Q15 and 3Q15, respectively. Expenses in this line item do not include any indirect support allocation costs. |
note 3: | A portion of the cost of the Company’s indirect departments such as human resources, accounting, deposit operations, item processing, information technology, compliance and others have been allocated to the correspondent banking and capital markets division based on management’s estimates. In addition, an inter-company earnings credit is allocated to the segment for services provided to the commercial bank segment, also based on management’s estimates and judgment. |
12
Presented below are condensed consolidated balance sheets and average balance sheets for the periods indicated.
Condensed Consolidated Balance Sheets (unaudited) |
|
|
| |||
For the quarter ended: | 9/30/16 | 6/30/16 | 3/31/16 | 12/31/15 | 9/30/15 | |
Cash and due from banks | $37,460 | $60,522 | $65,560 | $50,902 | $42,624 | |
Fed funds sold and Fed Res Bank deposits | 161,406 | 223,533 | 296,459 | 101,580 | 185,807 | |
Trading securities | 2,166 | --- | 2,719 | 2,107 | 1,266 | |
Investment securities, available for sale | 761,648 | 744,575 | 707,573 | 604,739 | 490,458 | |
Investment securities, held to maturity | 263,692 | 267,082 | 256,849 | 272,840 | 248,310 | |
Loans held for sale | 2,333 | 4,329 | 2,186 | 1,529 | 806 | |
197,288 | 216,859 | 236,516 | 210,528 | 231,778 | ||
Loans | 3,097,194 | 2,978,108 | 2,911,705 | 2,383,248 | 2,331,853 | |
Allowance for loan losses | (25,499) | (24,172) | (23,122) | (22,264) | (22,648) | |
FDIC indemnification assets | --- | --- | --- | 25,795 | 28,596 | |
Premises and equipment, net | 114,567 | 116,129 | 116,734 | 101,821 | 102,675 | |
Goodwill | 105,492 | 105,492 | 105,492 | 76,739 | 76,739 | |
Core deposit intangible | 16,267 | 17,023 | 17,803 | 12,164 | 12,744 | |
Bank owned life insurance | 97,767 | 97,109 | 86,455 | 85,890 | 85,316 | |
OREO covered by FDIC loss share agreements | --- | --- | --- | 9,629 | 7,687 | |
OREO not covered by FDIC loss share agreements | 9,005 | 12,311 | 15,937 | 1,567 | 2,993 | |
Deferred income tax asset, net | 58,614 | 62,774 | 69,470 | 46,220 | 47,516 | |
Other assets | 115,112 | 113,615 | 101,319 | 57,683 | 58,552 | |
TOTAL ASSETS | $5,014,512 | $4,995,289 | $4,969,655 | $4,022,717 | $3,933,072 | |
|
|
|
|
|
| |
Deposits | $4,055,934 | $4,132,136 | $4,092,167 | $3,215,178 | $3,185,189 | |
Federal funds purchased | 258,329 | 174,116 | 225,298 | 200,250 | 161,303 | |
Other borrowings | 52,788 | 56,432 | 57,906 | 76,565 | 52,561 | |
Other liabilities | 94,690 | 94,634 | 74,823 | 40,210 | 54,207 | |
Common stockholders’ equity | 552,771 | 537,971 | 519,461 | 490,514 | 479,812 | |
TOTAL LIABILITIES AND |
|
|
|
|
| |
STOCKHOLDERS’ EQUITY | $5,014,512 | $4,995,289 | $4,969,655 | $4,022,717 | $3,933,072 | |
|
|
|
|
|
| |
|
|
|
|
|
| |
Condensed Consolidated Average Balance Sheets (unaudited) |
|
|
| |||
For quarter ended: | 9/30/16 | 6/30/16 | 3/31/16 | 12/31/15 | 9/30/15 | |
Federal funds sold and other | $187,906 | $272,635 | $225,302 | $211,112 | $165,927 | |
Security investments | 1,035,090 | 1,001,511 | 889,488 | 822,386 | 767,268 | |
PCI loans | 207,406 | 225,584 | 214,998 | 222,685 | 241,393 | |
Loans | 3,037,333 | 2,949,651 | 2,569,240 | 2,363,060 | 2,306,751 | |
Allowance for loan losses | (24,209) | (23,173) | (22,616) | (22,078) | (22,890) | |
All other assets | 559,841 | 556,040 | 479,454 | 458,087 | 455,067 | |
TOTAL ASSETS | $5,003,367 | $4,982,248 | $4,355,866 | $4,055,252 | $3,913,516 | |
|
|
|
|
|
| |
Deposits- interest bearing | $2,678,638 | $2,626,668 | $2,266,700 | $2,072,838 | $2,033,045 | |
Deposits- non interest bearing | 1,445,140 | 1,506,762 | 1,282,422 | 1,194,763 | 1,136,788 | |
Federal funds purchased | 181,037 | 188,663 | 197,335 | 203,413 | 173,575 | |
Other borrowings | 54,699 | 59,126 | 55,337 | 51,131 | 55,382 | |
Other liabilities | 97,830 | 71,935 | 56,650 | 48,969 | 39,740 | |
Stockholders’ equity | 546,023 | 529,094 | 497,422 | 484,138 | 474,986 | |
TOTAL LIABILITIES AND |
|
|
|
|
| |
STOCKHOLDERS’ EQUITY | $5,003,367 | $4,982,248 | $4,355,866 | $4,055,252 | $3,913,516 | |
13
Condensed Consolidated Earnings Statement (unaudited)
For quarter ended: | 9/30/16 | 6/30/16 | 3/31/16 | 12/31/15 | 9/30/15 |
|
|
|
|
|
|
Interest income: |
|
|
|
|
|
Loans | $41,445 | $40,977 | $37,118 | $35,508 | $35,134 |
Investments | 5,746 | 5,710 | 5,842 | 5,187 | 4,623 |
Federal funds sold and other | 512 | 622 | 538 | 403 | 355 |
Total interest income | 47,703 | 47,309 | 43,498 | 41,098 | 40,112 |
|
|
|
|
|
|
Interest expense: |
|
|
|
|
|
Deposits | 1,821 | 1,740 | 1,481 | 1,351 | 1,339 |
Securities sold under agreement to repurchase | 25 | 28 | 27 | 32 | 51 |
Federal funds purchased | 240 | 250 | 271 | 190 | 150 |
Corporate debentures | 298 | 294 | 244 | 246 | 244 |
Total interest expense | 2,384 | 2,312 | 2,023 | 1,819 | 1,784 |
|
|
|
|
|
|
Net interest income | 45,319 | 44,997 | 41,475 | 39,279 | 38,328 |
Provision for loan losses | 1,275 | 911 | 510 | 543 | --- |
Net interest income after loan loss provision | 44,044 | 44,086 | 40,965 | 38,736 | 38,328 |
|
|
|
|
|
|
Non interest income (see page 15) | 15,614 | 16,971 | 14,561 | 9,666 | 8,130 |
|
|
|
|
|
|
Non interest expense: |
|
|
|
|
|
Salaries, wages and employee benefits | 22,418 | 22,959 | 21,455 | 18,977 | 18,916 |
Occupancy expense | 2,414 | 2,477 | 2,147 | 1,986 | 2,203 |
Depreciation of premises and equipment | 1,629 | 1,588 | 1,497 | 1,442 | 1,438 |
Data processing expense | 1,761 | 1,765 | 1,527 | 1,443 | 1,536 |
Legal, audit and other professional fees | 904 | 949 | 903 | 750 | 779 |
Amortization of intangibles | 791 | 814 | 678 | 616 | 615 |
Credit related expense | 187 | 611 | 359 | 309 | 439 |
FDIC credit related expenses | --- | --- | --- | 997 | (46) |
Merger and acquisition related expenses | --- | --- | 11,172 | 524 | 169 |
Termination of FDIC loss share agreements | --- | --- | 17,560 | --- | --- |
Impairment/sales bank property held for sale, net | 549 | (38) | 456 | 94 | 12 |
All other expenses | 5,675 | 5,924 | 5,099 | 4,948 | 4,794 |
Total non interest expenses | 36,328 | 37,049 | 62,853 | 32,086 | 30,855 |
|
|
|
|
|
|
Income (loss) before provision for income taxes | 23,330 | 24,008 | (7,327) | 16,316 | 15,603 |
Provision for income taxes | 7,946 | 8,274 | (2,523) | 5,920 | 5,687 |
Net income (loss) | $15,384 | $15,734 | $(4,804) | $10,396 | $9,916 |
|
|
|
|
|
|
Earnings (loss) per share -diluted | $0.32 | $0.32 | $(0.10) | $0.23 | $0.22 |
14
NON INTEREST INCOME AND NON INTEREST EXPENSES
The table below summarizes the Company’s non-interest income for the periods indicated.
Quarterly Condensed Consolidated Non Interest Income (unaudited) |
|
|
| ||
For the quarter ended: | 9/30/16 | 6/30/16 | 3/31/16 | 12/31/15 | 9/30/15 |
Correspondent banking and capital markets division (1) | $ 6,381 | $ 8,049 | $ 7,371 | $ 5,254 | $ 4,943 |
Other correspondent banking related revenue (2) | 1,147 | 1,242 | 1,404 | 987 | 992 |
Wealth management related revenue | 892 | 795 | 735 | 913 | 940 |
Service charges on deposit accounts | 3,770 | 3,329 | 2,736 | 2,576 | 2,488 |
Debit, prepaid, ATM and merchant card related fees | 2,017 | 2,182 | 2,046 | 1,730 | 1,659 |
BOLI income | 658 | 654 | 565 | 574 | 580 |
Other service charges and fees | 736 | 720 | 466 | 419 | 641 |
Gain on sale of securities available for sale | 13 | --- | --- | --- | 4 |
Subtotal | $15,614 | $16,971 | $15,323 | $12,453 | $12,247 |
Gain on early extinguishment of debt | --- | --- | 308 | --- | --- |
FDIC indemnification asset – amortization (see explanation below) | --- | --- | (1,166) | (3,420) | (4,144) |
FDIC indemnification income | --- | --- | 96 | 633 | 27 |
Total non-interest income | $15,614 | $16,971 | $14,561 | $9,666 | $8,130 |
note 1: | Includes gross commissions earned on bond sales, fees from hedging services, loan brokering fees and related consulting fees. The fee income in this category is based on sales volume in any particular period and is therefore volatile between comparable periods. |
note 2: | Includes fees from safe-keeping activities, bond accounting services, asset/liability consulting services, international wires, clearing and corporate checking account services and other correspondent banking related revenue and fees. The fees included in this category are less volatile than those described above in note 1. |
Services charges on deposit accounts increased during the current quarter compared to the previous quarter as result of new product changes on personal and business accounts.
15
The table below summarizes the Company’s non-interest expense for the periods indicated.
Quarterly Condensed Consolidated Non Interest Expense (unaudited) | |||||
For the quarter ended: | 9/30/2016 | 6/30/2016 | 3/31/2016 | 12/31/2015 | 9/30/2015 |
Employee salaries and wages | $17,074 | $17,499 | $16,137 | $14,344 | $14,200 |
Employee incentive/bonus compensation accrued | 1,610 | 1,548 | 1,259 | 1,854 | 1,719 |
Employee equity based compensation expense | 1,109 | 1,062 | 1,080 | 866 | 775 |
Deferred compensation expense | 148 | 160 | 160 | 148 | 157 |
Health insurance and other employee benefits | 1,537 | 1,546 | 1,260 | 983 | 1,240 |
Payroll taxes | 999 | 1,111 | 1,423 | 734 | 825 |
401K employer contributions | 470 | 479 | 477 | 358 | 416 |
Other employee related expenses | 322 | 291 | 291 | 314 | 328 |
Incremental direct cost of loan origination | (851) | (737) | (632) | (624) | (744) |
Total salaries, wages and employee benefits | 22,418 | 22,959 | 21,455 | 18,977 | 18,916 |
|
|
|
|
|
|
(Gain) loss on sale of OREO | (558) | (554) | (158) | 39 | 31 |
Loss (gain) on sale of FDIC covered OREO | --- | --- | --- | 491 | (313) |
Valuation write down of OREO | 237 | 392 | 22 | 22 | 65 |
Valuation write down of FDIC covered OREO | --- | --- | --- | 169 | 172 |
(Gain) loss on repossessed assets other than real estate | (4) | 31 | 6 | (7) | 15 |
Foreclosure and repossession related expenses | 512 | 742 | 489 | 255 | 328 |
Foreclosure and repo expense, FDIC | --- | --- | --- | 337 | 95 |
Total credit related expenses | 187 | 611 | 359 | 1,306 | 393 |
|
|
|
|
|
|
Occupancy expense | 2,414 | 2,477 | 2,147 | 1,986 | 2,203 |
Depreciation of premises and equipment | 1,629 | 1,588 | 1,497 | 1,442 | 1,438 |
Supplies, stationary and printing | 341 | 380 | 299 | 338 | 382 |
Marketing expenses | 700 | 826 | 690 | 668 | 630 |
Data processing expenses | 1,761 | 1,765 | 1,527 | 1,443 | 1,536 |
Legal, auditing and other professional fees | 904 | 949 | 903 | 750 | 779 |
Bank regulatory related expenses | 863 | 968 | 810 | 606 | 774 |
Postage and delivery | 423 | 486 | 355 | 337 | 348 |
ATM and debit card related expenses | 725 | 816 | 596 | 495 | 515 |
Amortization of intangibles | 791 | 814 | 678 | 616 | 615 |
Internet and telephone banking | 559 | 628 | 564 | 538 | 545 |
Correspondent account and Federal Reserve charges | 191 | 203 | 176 | 155 | 163 |
Conferences, seminars, education and training | 155 | 102 | 133 | 142 | 110 |
Director fees | 134 | 149 | 209 | 176 | 164 |
Travel expenses | 153 | 119 | 79 | 117 | 148 |
Other expenses | 1,431 | 1,247 | 1,188 | 1,376 | 1,015 |
Subtotal | 35,779 | 37,087 | 33,665 | 31,468 | 30,674 |
Impairment/sales bank property held for sale | 549 | (38) | 456 | 94 | 12 |
Merger and acquisition related expenses | --- | --- | 11,172 | 524 | 169 |
Termination of FDIC loss share agreements | --- | --- | 17,560 | --- | --- |
Total non- interest expense | $36,328 | $37,049 | $62,853 | $32,086 | $30,855 |
Note: Certain prior period amounts have been reclassified to conform to the current period presentation format.
16
Explanation of Certain Unaudited Non-GAAP Financial Measures
This press release contains financial information determined by methods other than Generally Accepted Accounting Principles (“GAAP”). The financial highlights provide reconciliations between GAAP interest income, net interest income and tax equivalent basis interest income and net interest income, as well as total stockholders’ equity and tangible common equity. It also reconciles net income and net operating income. Management uses these non-GAAP financial measures in its analysis of the Company’s performance and believes these presentations provide useful supplemental information, and a clearer understanding of the Company’s performance. The Company believes the non-GAAP measures enhance investors’ understanding of the Company’s business and performance. These measures are also useful in understanding performance trends and facilitate comparisons with the performance of other financial institutions. The limitations associated with operating measures are the risk that persons might disagree as to the appropriateness of items comprising these measures and that different companies might calculate these measures differently. The Company provides reconciliations between GAAP and these non-GAAP measures. These disclosures should not be considered an alternative to GAAP.
Reconciliation of GAAP to non-GAAP Measures (unaudited):
| 3Q16 | 2Q16 | 3Q15 |
|
|
Interest income, as reported (GAAP) | $47,703 | $47,309 | $40,112 |
|
|
tax equivalent adjustments | 949 | 805 | 608 |
|
|
Interest income (tax equivalent) | $48,652 | $48,114 | $40,720 |
|
|
|
|
|
|
|
|
Net interest income, as reported (GAAP) | $45,319 | $44,997 | $38,328 |
|
|
tax equivalent adjustments | 949 | 805 | 608 |
|
|
Net interest income (tax equivalent) | $46,268 | $45,802 | $39,936 |
|
|
|
|
|
|
|
|
| 9/30/16 | 6/30/16 | 3/31/16 | 12/31/15 | 9/30/15 |
Total stockholders' equity (GAAP) | $552,771 | $537,971 | $519,461 | $490,514 | $479,812 |
Goodwill | (105,492) | (105,492) | (105,492) | (76,739) | (76,739) |
Core deposit intangible | (16,267) | (17,023) | (17,803) | (12,164) | (12,744) |
Trust intangible | (733) | (768) | (802) | (837) | (873) |
Tangible common equity | $430,279 | $414,688 | $395,364 | $400,774 | $389,456 |
| 3Q16 | 2Q16 | 1Q16 | 4Q15 | 3Q15 |
Net (loss) income (GAAP) | $15,384 | $15,734 | $(4,804) | $10,396 | $9,916 |
Exclude gain on sale of AFS securities | (13) | --- | --- | --- | (4) |
Exclude gain on early extinguishment |
|
|
|
|
|
of debt | --- | --- | (308) | --- | --- |
Add back merger and acquisition |
|
|
|
|
|
related expenses | --- | --- | 11,172 | 524 | 169 |
Add expenses related to termination of |
|
|
|
|
|
FDIC loss share agreements | --- | --- | 17,560 | --- | --- |
Add back impairment/sales relating to |
|
|
|
|
|
bank property held for sale, net | 549 | (38) | 456 | 94 | 12 |
Tax effected using the effective tax |
|
|
|
|
|
rate for the period presented | (183) | 13 | (9,943) | (224) | (65) |
Operating income | $15,737 | $15,709 | $14,133 | $10,790 | $10,028 |
Average diluted shares outstanding |
|
|
|
|
|
during the period presented | 48,603 | 48,454 | 46,343 | 45,935 | 45,826 |
Operating income per share | $0.32 | $0.32 | $0.30 | $0.23 | $0.22 |
17
About CenterState Banks, Inc.
The Company, headquartered in Winter Haven, Florida between Orlando and Tampa, is a financial holding company with one nationally chartered bank, CenterState Bank of Florida, N.A. Presently, the Company operates through its network of 66 branch banking offices located in 22 counties throughout Florida, providing traditional deposit and lending products and services to its commercial and retail customers. The Company also provides correspondent banking and capital market services to over 600 community banks nationwide.
For additional information contact Ernest S. Pinner (Chairman), John C. Corbett (CEO), Stephen D. Young (COO) or Jennifer Idell (CFO) at 863-293-4710.
“Safe Harbor” Statement under the Private Securities Litigation Reform Act of 1995:
Some of the statements in this report constitute forward-looking statements, within the meaning of the Securities Act of 1933 and the Securities Exchange Act of 1934. These statements related to future events, other future financial and operating performance, costs, revenues, economic conditions in our markets, loan performance, credit risks, collateral values and credit conditions, or business strategies, including expansion and acquisition activities and may be identified by terminology such as “may,” “will,” “should,” “expects,” “scheduled,” “plans,” “intends,” “anticipates,” “believes,” “estimates,” “potential,” or “continue” or the negative of such terms or other comparable terminology. Actual events or results may differ materially. In evaluating these statements, you should specifically consider the factors described throughout this report. We cannot assure you that future results, levels of activity, performance or goals will be achieved, and actual results may differ from those set forth in the forward looking statements.
Forward-looking statements, with respect to our beliefs, plans, objectives, goals, expectations, anticipations, estimates and intentions, involve known and unknown risks, uncertainties and other factors, which may be beyond our control, and which may cause the actual results, performance or achievements of the Company or the Bank to be materially different from future results, performance or achievements expressed or implied by such forward-looking statements. You should not expect us to update any forward-looking statements. All written or oral forward-looking statements attributable to us are expressly qualified in their entirety by this cautionary notice, including, without limitation, those risks and uncertainties described in our annual report on Form 10-K for the year ended December 31, 2015, and otherwise in our SEC reports and filings.
18