4th Quarter 2018 Investor Presentation Exhibit 99.1

Forward Looking Statements Information in this presentation that are not statements of historical fact constitute forward-looking statements for which CenterState claims the protection of the safe harbor provisions contained in the Private Securities Litigation Reform Act of 1995 (the “Act”), notwithstanding that such statements are not specifically identified as such. In addition, certain statements may be contained in CenterState’s future filings with the SEC, in press releases and in oral and written statements made by CenterState or with CenterState’s approval that are not statements of historical fact and that constitute forward-looking statements within the meaning of the Act. Examples of forward-looking statements include, but are not limited to: (a) projections of revenues, expenses, income or loss, earnings or loss per share, the payment or nonpayment of dividends, capital structure and other financial items; (b) statements of CenterState’s plans, objectives and expectations or those of its management or Board of Directors, including those relating to the pending merger with National Commerce Corporation (“NCC”); (c) statements of future economic performance; and (d) statements of assumptions underlying such statements. Words such as “believes,” “anticipates,” “expects,” “intends,” “targeted,” “continue,” “remain,” “will,” “should,” “may” and other similar expressions are intended to identify forward-looking statements but are not the exclusive means of identifying such statements. Forward-looking statements are subject to various risks and uncertainties, including those risks and uncertainties described under the heading “Risk Factors” in CenterState’s Annual Report on Form 10-K for the year ended December 31, 2017, and described in any subsequent reports that CenterState has filed with the SEC. With respect to the pending merger with NCC, these risks include, among others: (1) the risk that the cost savings and any revenue synergies from the merger may not be realized or take longer than anticipated to be realized; (2) disruption from the merger with customers, suppliers, employees or other business partners; (3) the occurrence of any event, change or other circumstances that could give rise to the termination of the merger agreement; (4) the risk of successful integration of NCC’s businesses into CenterState; (5) the failure to obtain required governmental approvals of the merger; (6) the failure to obtain the necessary shareholder or stockholder approvals, as applicable, in connection with the merger; (7) the amount of the costs, fees, expenses and charges related to the merger; (8) reputational risk and the reaction of each company’s customers, suppliers, employees or other business partners to the merger; (9) the failure of the closing conditions in the merger agreement to be satisfied, or any unexpected delay in closing the merger; (10) the risk that the integration of NCC’s operations into the operations of CenterState will be materially delayed or will be more costly or difficult than expected; (11) the possibility that the merger may be more expensive to complete than anticipated, including as a result of unexpected factors or events; and (12) general competitive, economic, political and market conditions. There are or will be important factors that could cause actual outcomes or results to differ materially from those indicated in forward-looking statements, and these forward-looking statements should not be relied upon as predictions of future events. CenterState undertakes no obligation to update any forward-looking statements or to make any other forward-looking statements, whether as a result of new information, future events or otherwise. In that respect, CenterState cautions readers not to place undue reliance on any such forward-looking statements, which speak only as of the date made.
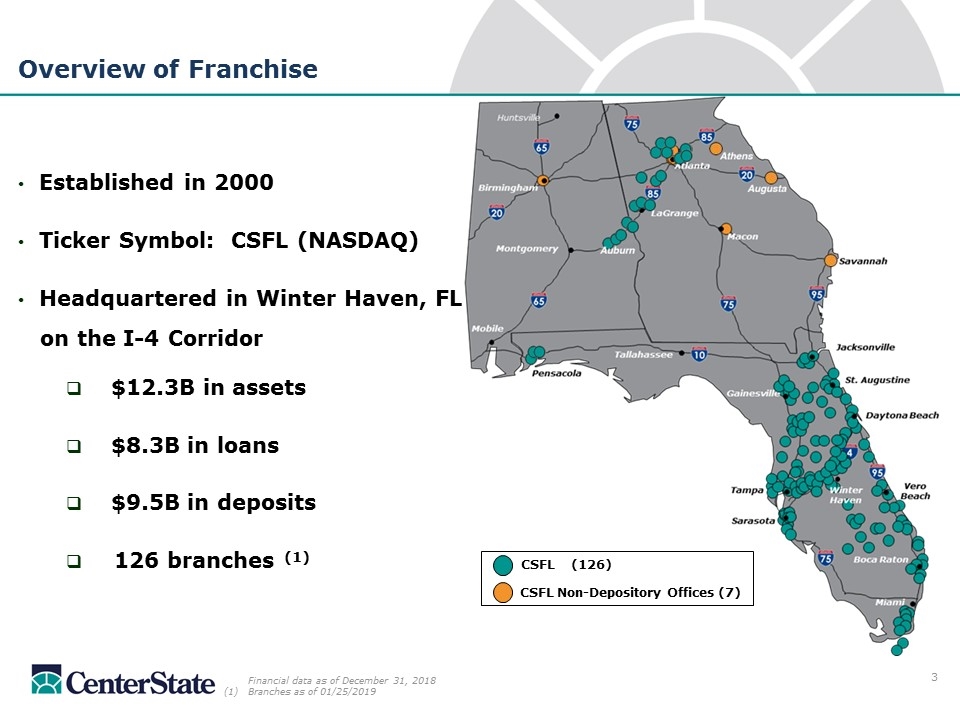
Established in 2000 Ticker Symbol: CSFL (NASDAQ) Headquartered in Winter Haven, FL on the I-4 Corridor $12.3B in assets $8.3B in loans $9.5B in deposits 126 branches (1) Overview of Franchise Financial data as of December 31, 2018 (1)Branches as of 01/25/2019 CSFL (126) CSFL Non-Depository Offices (7) 3
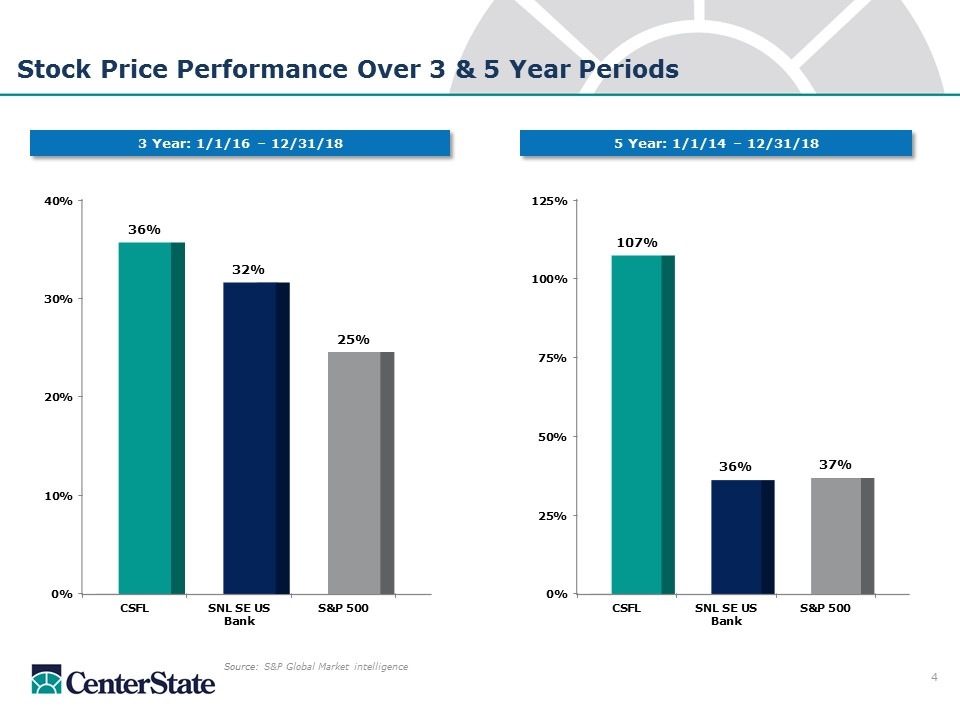
Stock Price Performance Over 3 & 5 Year Periods Source: S&P Global Market intelligence 3 Year: 1/1/16 – 12/31/18 5 Year: 1/1/14 – 12/31/18

Superior Growth Markets
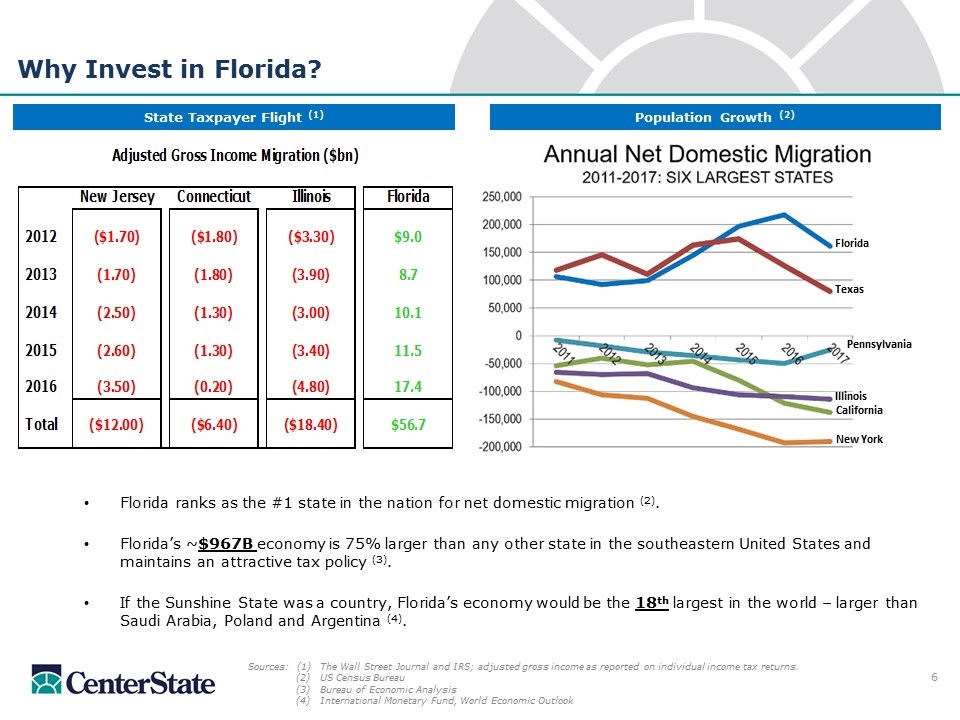
Florida ranks as the #1 state in the nation for net domestic migration (2). Florida’s ~$967B economy is 75% larger than any other state in the southeastern United States and maintains an attractive tax policy (3). If the Sunshine State was a country, Florida’s economy would be the 18th largest in the world – larger than Saudi Arabia, Poland and Argentina (4). Why Invest in Florida? Sources:(1) The Wall Street Journal and IRS; adjusted gross income as reported on individual income tax returns. (2)US Census Bureau (3)Bureau of Economic Analysis (4)International Monetary Fund, World Economic Outlook Population Growth (2) State Taxpayer Flight (1) Florida Texas Pennsylvania Illinois California New York
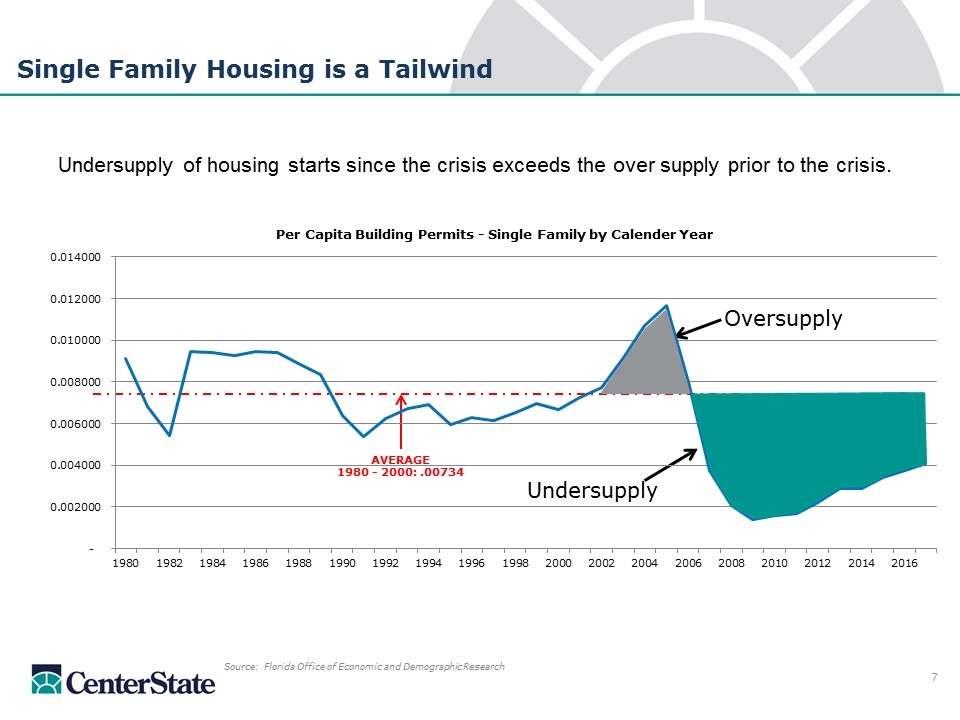
AVERAGE 1980 - 2000: .00734 Single Family Housing is a Tailwind Undersupply of housing starts since the crisis exceeds the over supply prior to the crisis. Source: Florida Office of Economic and Demographic Research Oversupply Undersupply
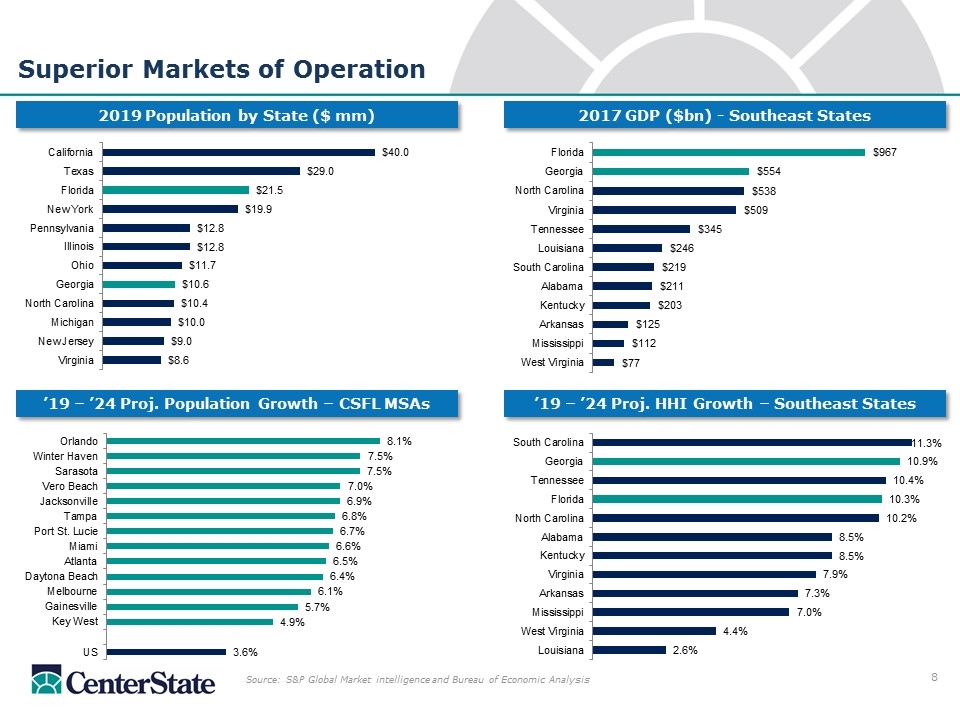
Source: S&P Global Market intelligence and Bureau of Economic Analysis Superior Markets of Operation 2019 Population by State ($ mm) 2017 GDP ($bn) - Southeast States ’19 – ’24 Proj. HHI Growth – Southeast States ’19 – ’24 Proj. Population Growth – CSFL MSAs
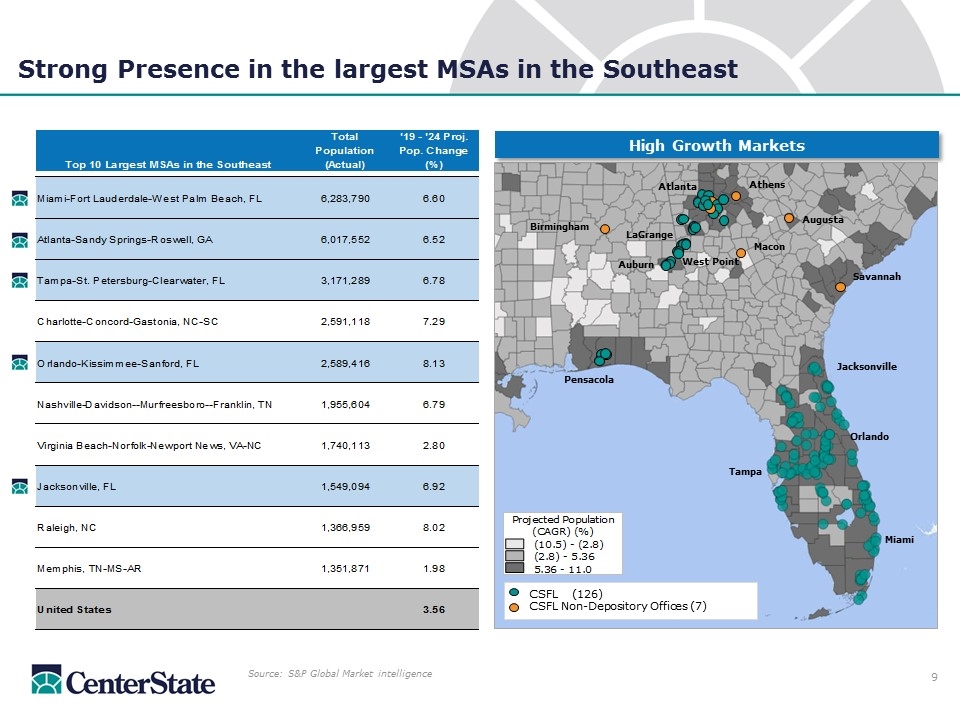
Strong Presence in the largest MSAs in the Southeast Source: S&P Global Market intelligence Jacksonville Orlando Miami Pensacola Atlanta LaGrange Auburn Tampa High Growth Markets West Point Macon Birmingham CSFL (126) CSFL Non-Depository Offices (7) Savannah Augusta Athens
Capital Management
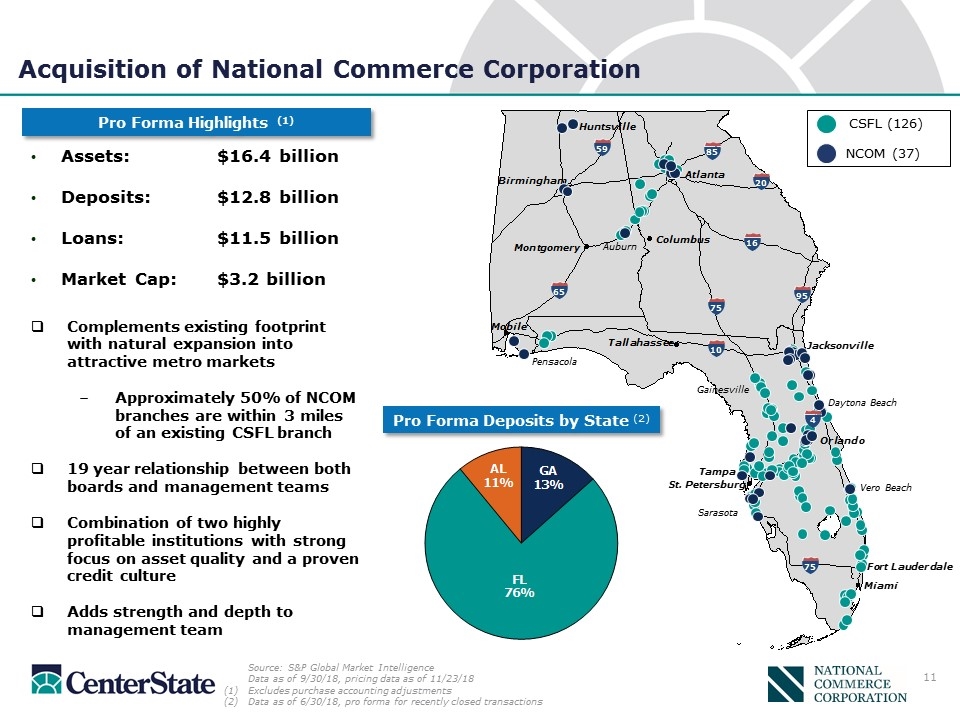
Acquisition of National Commerce Corporation Assets: $16.4 billion Deposits: $12.8 billion Loans: $11.5 billion Market Cap: $3.2 billion Pro Forma Highlights (1) CSFL (126) NCOM (37) Complements existing footprint with natural expansion into attractive metro markets Approximately 50% of NCOM branches are within 3 miles of an existing CSFL branch 19 year relationship between both boards and management teams Combination of two highly profitable institutions with strong focus on asset quality and a proven credit culture Adds strength and depth to management team Pro Forma Deposits by State (2) Auburn Sarasota Vero Beach Daytona Beach 85 20 95 16 65 59 75 10 75 4 Pensacola Gainesville Source: S&P Global Market Intelligence Data as of 9/30/18, pricing data as of 11/23/18 Excludes purchase accounting adjustments Data as of 6/30/18, pro forma for recently closed transactions
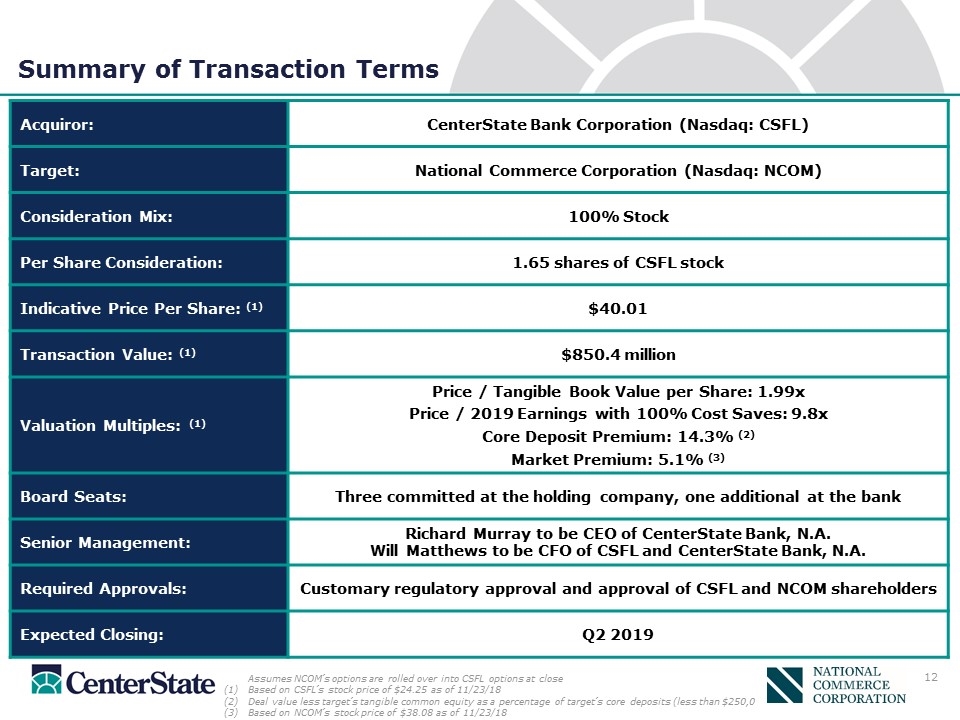
Summary of Transaction Terms Acquiror: CenterState Bank Corporation (Nasdaq: CSFL) Target: National Commerce Corporation (Nasdaq: NCOM) Consideration Mix: 100% Stock Per Share Consideration: 1.65 shares of CSFL stock Indicative Price Per Share: (1) $40.01 Transaction Value: (1) $850.4 million Valuation Multiples: (1) Price / Tangible Book Value per Share: 1.99x Price / 2019 Earnings with 100% Cost Saves: 9.8x Core Deposit Premium: 14.3% (2) Market Premium: 5.1% (3) Board Seats: Three committed at the holding company, one additional at the bank Senior Management: Richard Murray to be CEO of CenterState Bank, N.A. Will Matthews to be CFO of CSFL and CenterState Bank, N.A. Required Approvals: Customary regulatory approval and approval of CSFL and NCOM shareholders Expected Closing: Q2 2019 Assumes NCOM’s options are rolled over into CSFL options at close Based on CSFL’s stock price of $24.25 as of 11/23/18 Deal value less target’s tangible common equity as a percentage of target’s core deposits (less than $250,000) Based on NCOM’s stock price of $38.08 as of 11/23/18
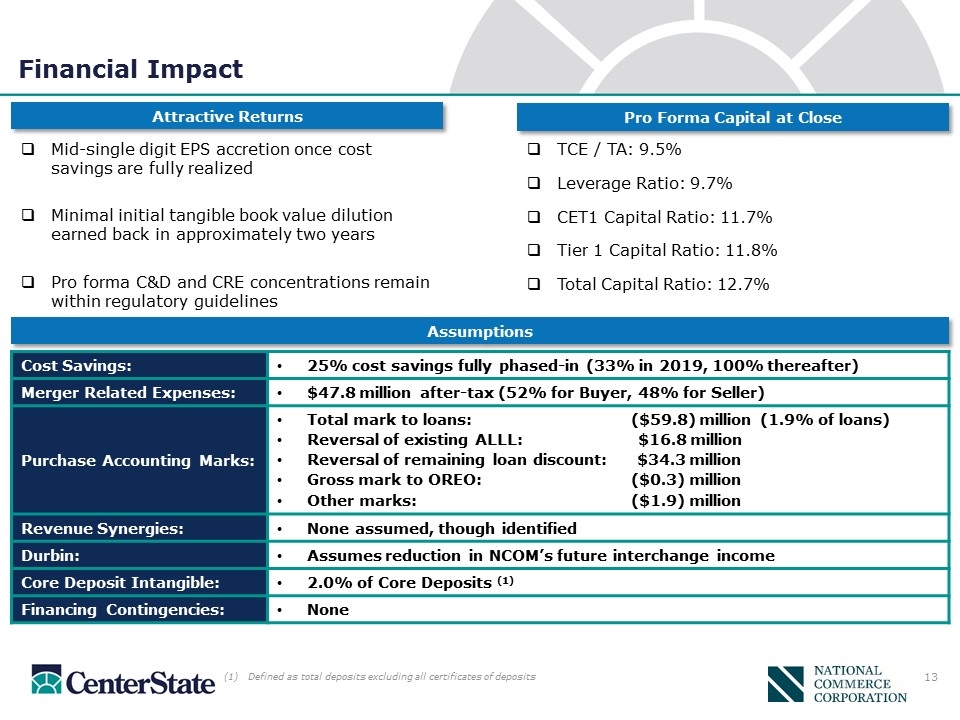
Financial Impact Cost Savings: 25% cost savings fully phased-in (33% in 2019, 100% thereafter) Merger Related Expenses: $47.8 million after-tax (52% for Buyer, 48% for Seller) Purchase Accounting Marks: Total mark to loans:($59.8) million (1.9% of loans) Reversal of existing ALLL:$16.8 million Reversal of remaining loan discount: $34.3 million Gross mark to OREO:($0.3) million Other marks:($1.9) million Revenue Synergies: None assumed, though identified Durbin: Assumes reduction in NCOM’s future interchange income Core Deposit Intangible: 2.0% of Core Deposits (1) Financing Contingencies: None Defined as total deposits excluding all certificates of deposits Pro Forma Capital at Close Attractive Returns Assumptions Mid-single digit EPS accretion once cost savings are fully realized Minimal initial tangible book value dilution earned back in approximately two years Pro forma C&D and CRE concentrations remain within regulatory guidelines TCE / TA: 9.5% Leverage Ratio: 9.7% CET1 Capital Ratio: 11.7% Tier 1 Capital Ratio: 11.8% Total Capital Ratio: 12.7% 13
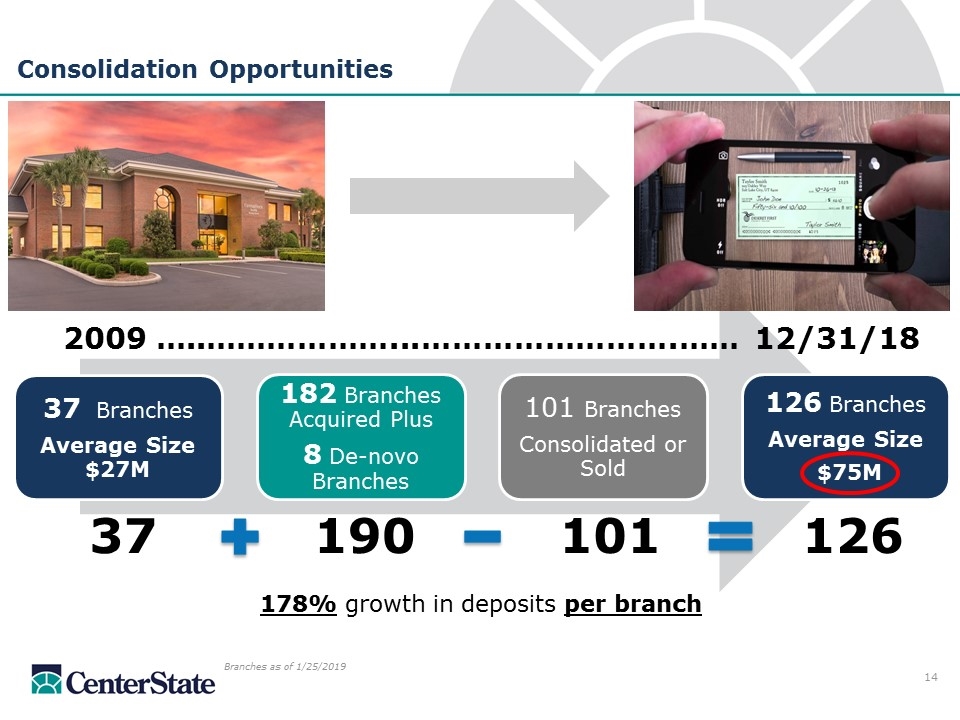
Consolidation Opportunities 178% growth in deposits per branch 37 190 101 126 2009 …..………………...…………………….…… 12/31/18 Branches as of 1/25/2019 37 Branches Average Size $27M 182 Branches Acquired Plus 8 De-novo Branches 101 Branches Consolidated or Sold 126 Branches Average Size $75M
Operating Performance
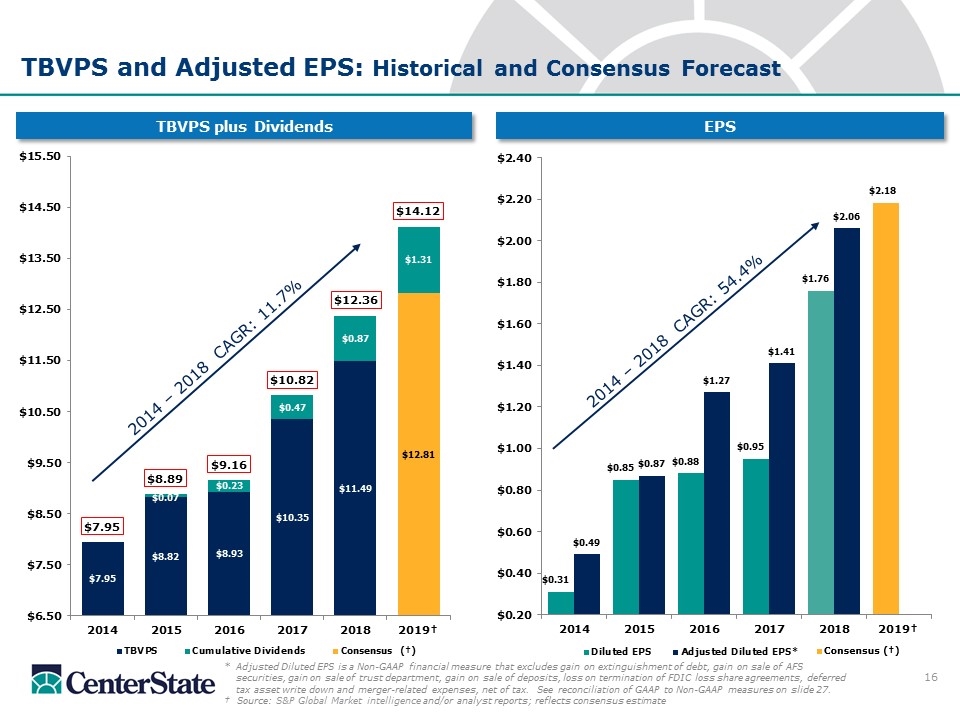
TBVPS and Adjusted EPS: Historical and Consensus Forecast *Adjusted Diluted EPS is a Non-GAAP financial measure that excludes gain on extinguishment of debt, gain on sale of AFS securities, gain on sale of trust department, gain on sale of deposits, loss on termination of FDIC loss share agreements, deferred tax asset write down and merger-related expenses, net of tax. See reconciliation of GAAP to Non-GAAP measures on slide 27. † Source: S&P Global Market intelligence and/or analyst reports; reflects consensus estimate TBVPS plus Dividends EPS 2014 – 2018 CAGR: 54.4% 2014 – 2018 CAGR: 11.7%
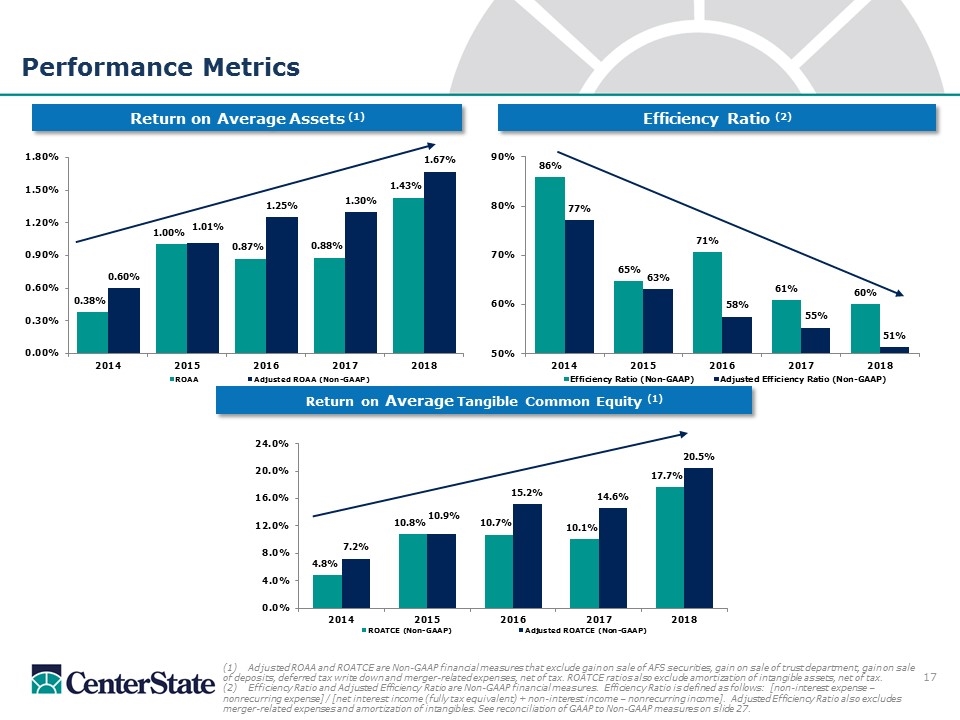
Efficiency Ratio (2) Performance Metrics (1) Adjusted ROAA and ROATCE are Non-GAAP financial measures that exclude gain on sale of AFS securities, gain on sale of trust department, gain on sale of deposits, deferred tax write down and merger-related expenses, net of tax. ROATCE ratios also exclude amortization of intangible assets, net of tax. (2) Efficiency Ratio and Adjusted Efficiency Ratio are Non-GAAP financial measures. Efficiency Ratio is defined as follows: [non-interest expense – nonrecurring expense] / [net interest income (fully tax equivalent) + non-interest income – nonrecurring income]. Adjusted Efficiency Ratio also excludes merger-related expenses and amortization of intangibles. See reconciliation of GAAP to Non-GAAP measures on slide 27. Return on Average Tangible Common Equity (1) Return on Average Assets (1)
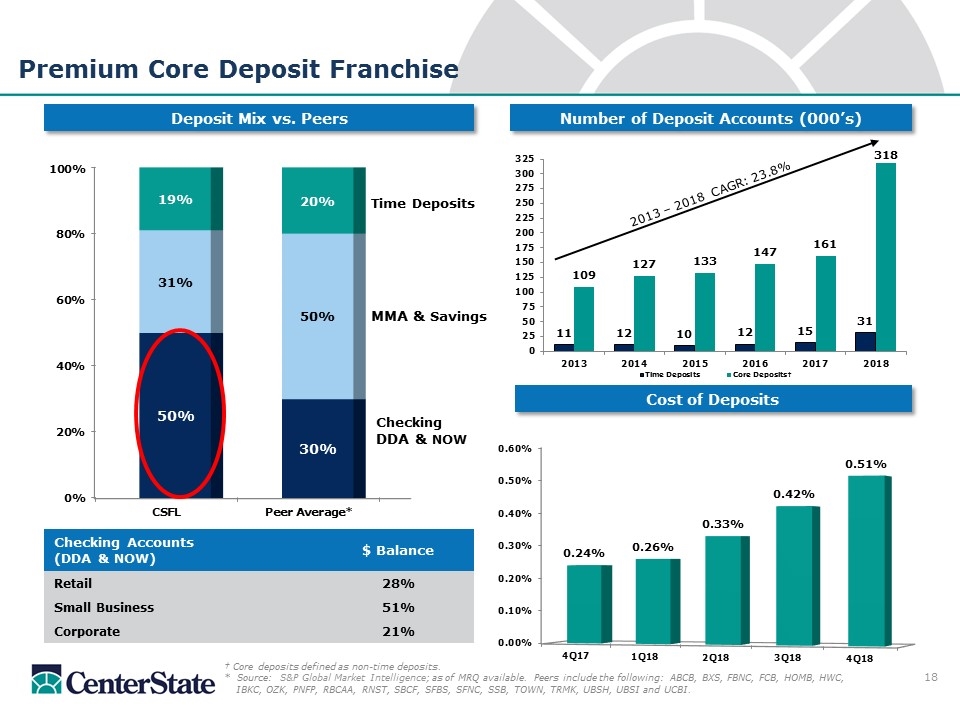
Number of Deposit Accounts (000’s) Premium Core Deposit Franchise Cost of Deposits Deposit Mix vs. Peers † Core deposits defined as non-time deposits. * Source: S&P Global Market Intelligence; as of MRQ available. Peers include the following: ABCB, BXS, FBNC, FCB, HOMB, HWC, IBKC, OZK, PNFP, RBCAA, RNST, SBCF, SFBS, SFNC, SSB, TOWN, TRMK, UBSH, UBSI and UCBI. MMA & Savings Time Deposits Checking Accounts (DDA & NOW) $ Balance Retail 28% Small Business 51% Corporate 21% Checking DDA & NOW 2013 – 2018 CAGR: 23.8%
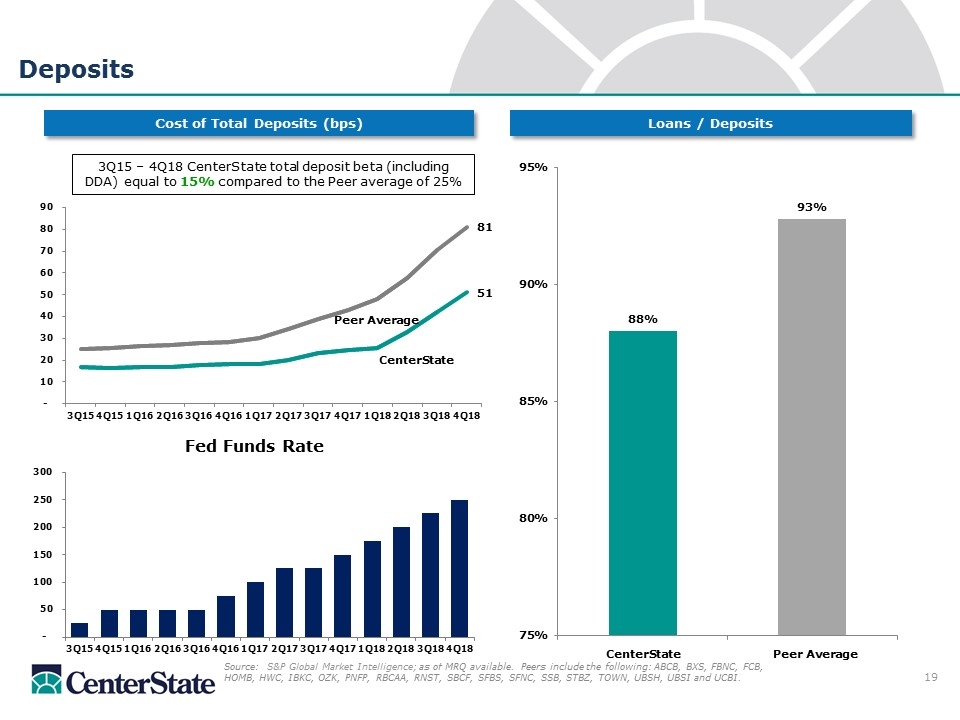
Deposits Loans / Deposits Cost of Total Deposits (bps) 3Q15 – 4Q18 CenterState total deposit beta (including DDA) equal to 15% compared to the Peer average of 25% CenterState Peer Average Source: S&P Global Market Intelligence; as of MRQ available. Peers include the following: ABCB, BXS, FBNC, FCB, HOMB, HWC, IBKC, OZK, PNFP, RBCAA, RNST, SBCF, SFBS, SFNC, SSB, STBZ, TOWN, UBSH, UBSI and UCBI. Peer Average CenterState
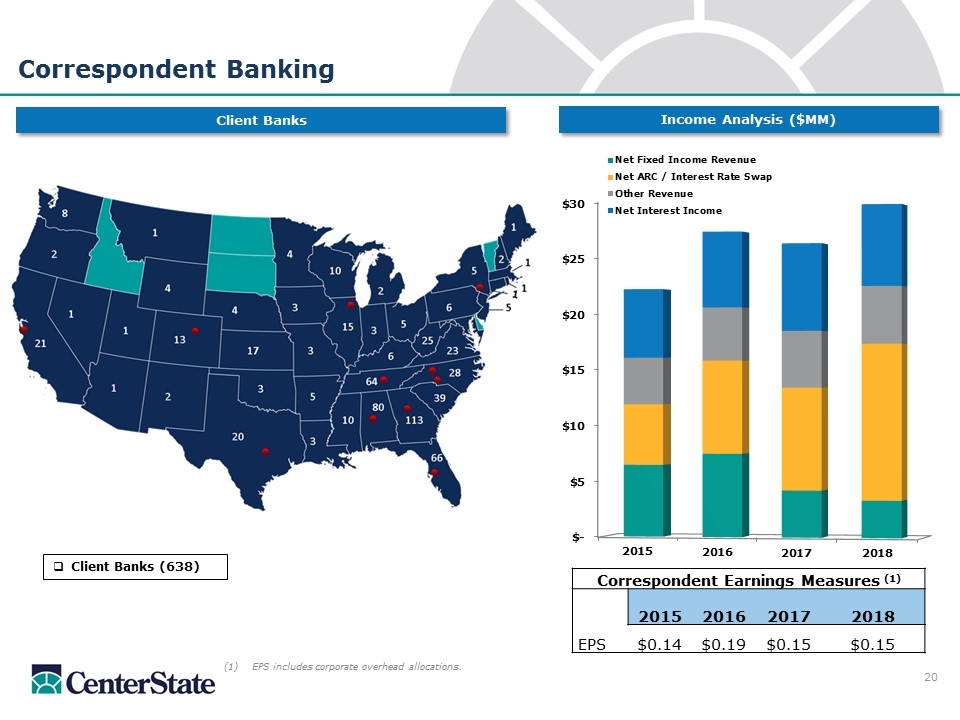
Client Banks (638) (1) EPS includes corporate overhead allocations. Correspondent Banking Income Analysis ($MM) Client Banks Correspondent Earnings Measures (1) 2015 2016 2017 2018 EPS $0.14 $0.19 $0.15 $0.15
CenterState is among the largest banking companies headquartered in Florida by assets, market capitalization, deposit market share and branch footprint(1). CenterState’s markets are some of the strongest markets in the Southeastern U.S. with new entry into Atlanta, the largest GDP MSA in Southeastern U.S. Combined with NCOM, projected to form a $16 billion high-performing franchise, expanding deposit market share and branch footprint in Southeastern U.S. NCOM provides additional depth and experience to the management team with a strong cultural fit. Investment Thesis Source: S&P Global Market Intelligence (1)Data as of MRQ; deposit market share data as of 6/30/18. Note: Community bank defined as institutions with total assets less than $20.0 billion

Supplemental
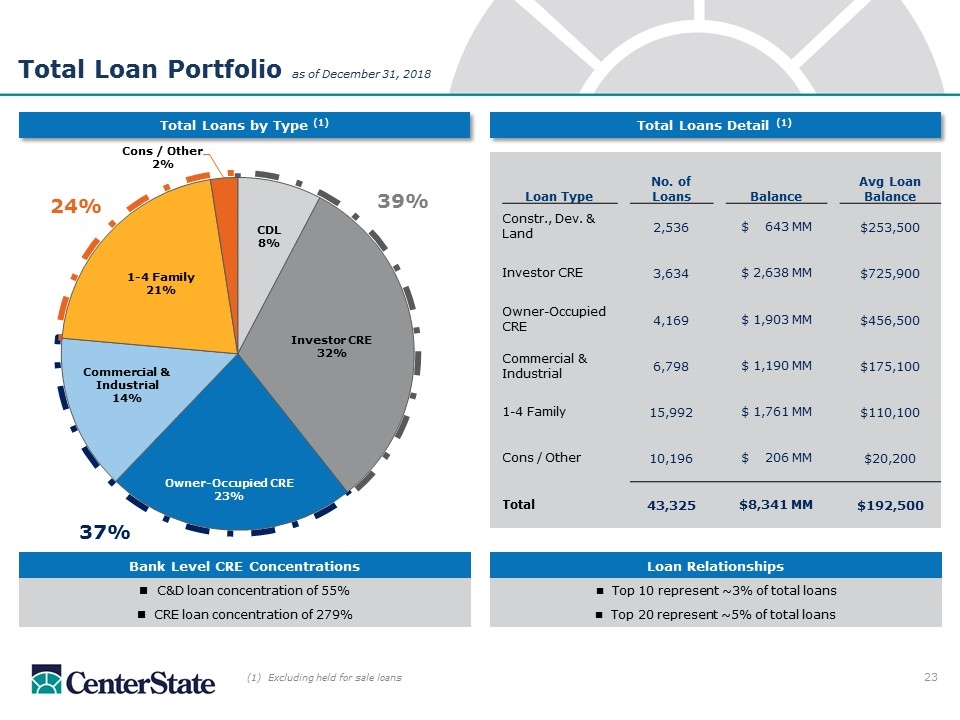
Total Loan Portfolio as of December 31, 2018 Total Loans by Type (1) Total Loans Detail (1) (1) Excluding held for sale loans Loan Relationships n Top 10 represent ~3% of total loans n Top 20 represent ~5% of total loans Bank Level CRE Concentrations C&D loan concentration of 55% CRE loan concentration of 279% 39% 37% 24% Loan Type No. of Loans Balance Avg Loan Balance Constr., Dev. & Land 2,536 $ 643 MM $253,500 Investor CRE 3,634 $ 2,638 MM $725,900 Owner-Occupied CRE 4,169 $ 1,903 MM $456,500 Commercial & Industrial 6,798 $ 1,190 MM $175,100 1-4 Family 15,992 $ 1,761 MM $110,100 Cons / Other 10,196 $ 206 MM $20,200 Total 43,325 $8,341 MM $192,500
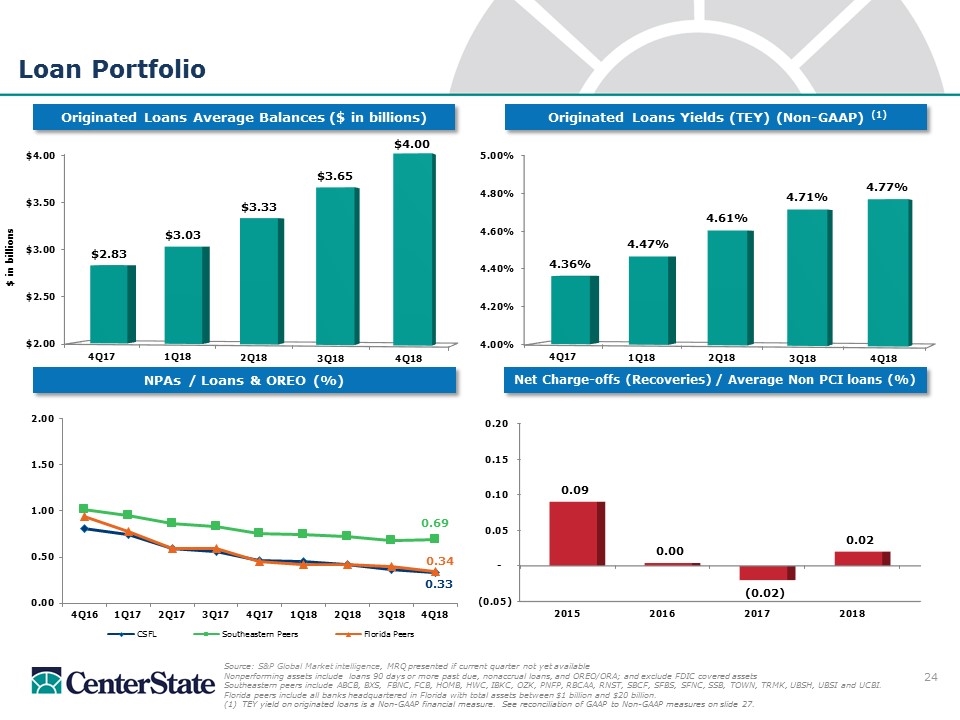
Loan Portfolio Originated Loans Yields (TEY) (Non-GAAP) (1) Originated Loans Average Balances ($ in billions) Source: S&P Global Market intelligence, MRQ presented if current quarter not yet available Nonperforming assets include loans 90 days or more past due, nonaccrual loans, and OREO/ORA; and exclude FDIC covered assets Southeastern peers include ABCB, BXS, FBNC, FCB, HOMB, HWC, IBKC, OZK, PNFP, RBCAA, RNST, SBCF, SFBS, SFNC, SSB, TOWN, TRMK, UBSH, UBSI and UCBI. Florida peers include all banks headquartered in Florida with total assets between $1 billion and $20 billion. (1) TEY yield on originated loans is a Non-GAAP financial measure. See reconciliation of GAAP to Non-GAAP measures on slide 27. NPAs / Loans & OREO (%) Net Charge-offs (Recoveries) / Average Non PCI loans (%)
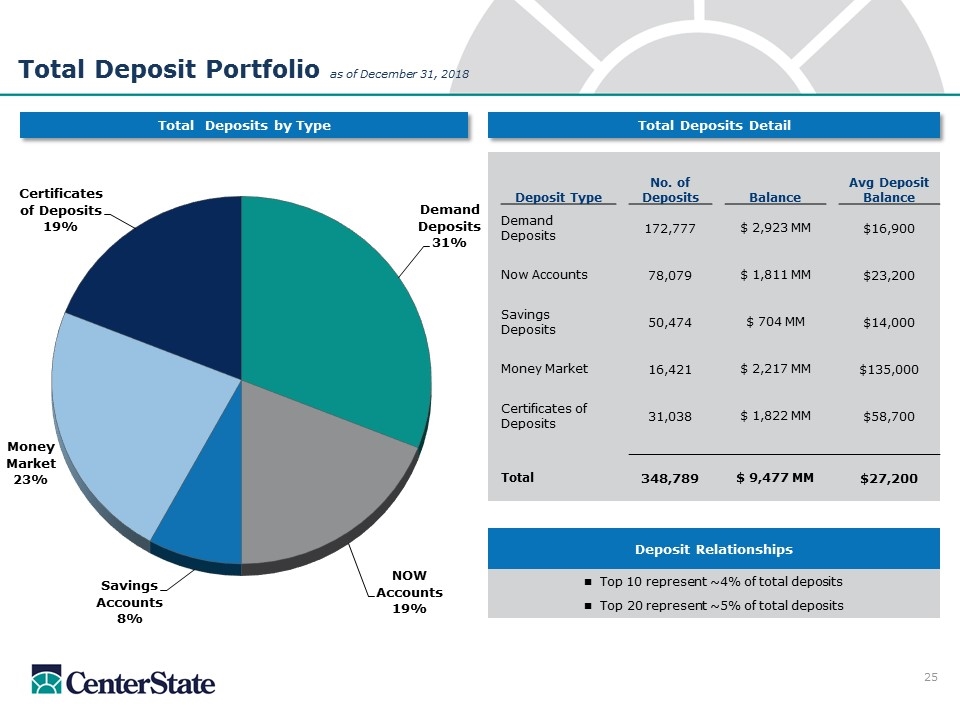
Deposit Relationships n Top 10 represent ~4% of total deposits n Top 20 represent ~5% of total deposits Total Deposits by Type Total Deposits Detail 23 Total Deposit Portfolio as of December 31, 2018 Deposit Type No. of Deposits Balance Avg Deposit Balance Demand Deposits 172,777 $ 2,923 MM $16,900 Now Accounts 78,079 $ 1,811 MM $23,200 Savings Deposits 50,474 $ 704 MM $14,000 Money Market 16,421 $ 2,217 MM $135,000 Certificates of Deposits 31,038 $ 1,822 MM $58,700 Total 348,789 $ 9,477 MM $27,200
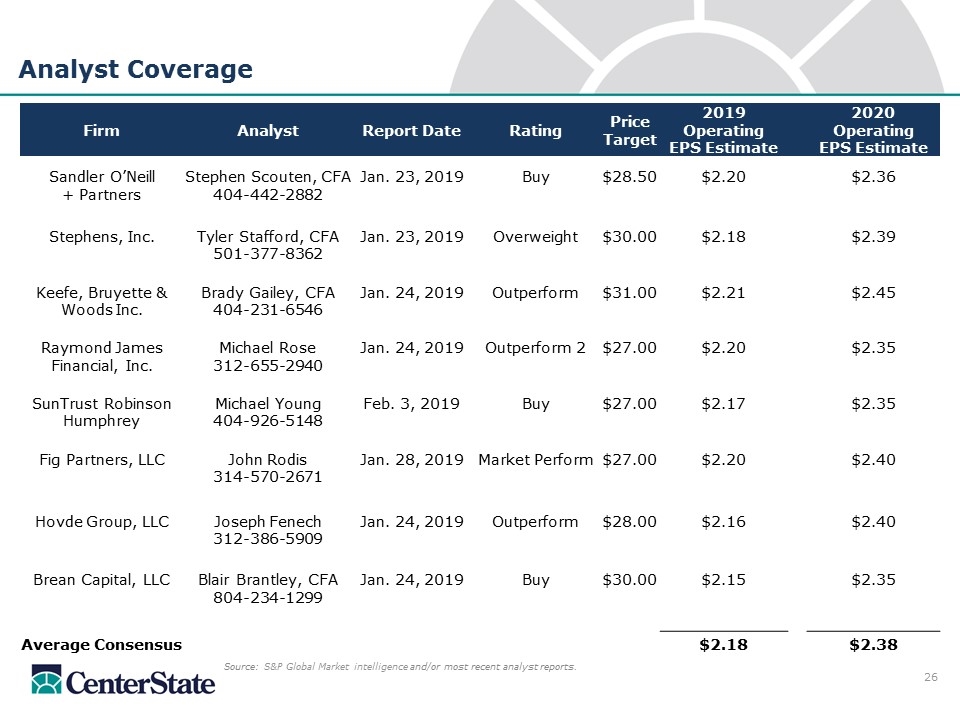
Analyst Coverage Source: S&P Global Market intelligence and/or most recent analyst reports. Firm Analyst Report Date Rating Price Target 2019 Operating EPS Estimate 2020 Operating EPS Estimate Sandler O’Neill Stephen Scouten, CFA Jan. 23, 2019 Buy $28.50 $2.20 $2.36 + Partners 404-442-2882 Stephens, Inc. Tyler Stafford, CFA Jan. 23, 2019 Overweight $30.00 $2.18 $2.39 501-377-8362 Keefe, Bruyette & Brady Gailey, CFA Jan. 24, 2019 Outperform $31.00 $2.21 $2.45 Woods Inc. 404-231-6546 Raymond James Michael Rose Jan. 24, 2019 Outperform 2 $27.00 $2.20 $2.35 Financial, Inc. 312-655-2940 SunTrust Robinson Michael Young Feb. 3, 2019 Buy $27.00 $2.17 $2.35 Humphrey 404-926-5148 Fig Partners, LLC John Rodis Jan. 28, 2019 Market Perform $27.00 $2.20 $2.40 314-570-2671 Hovde Group, LLC Joseph Fenech Jan. 24, 2019 Outperform $28.00 $2.16 $2.40 312-386-5909 Brean Capital, LLC Blair Brantley, CFA Jan. 24, 2019 Buy $30.00 $2.15 $2.35 804-234-1299 Average Consensus $2.18 $2.38
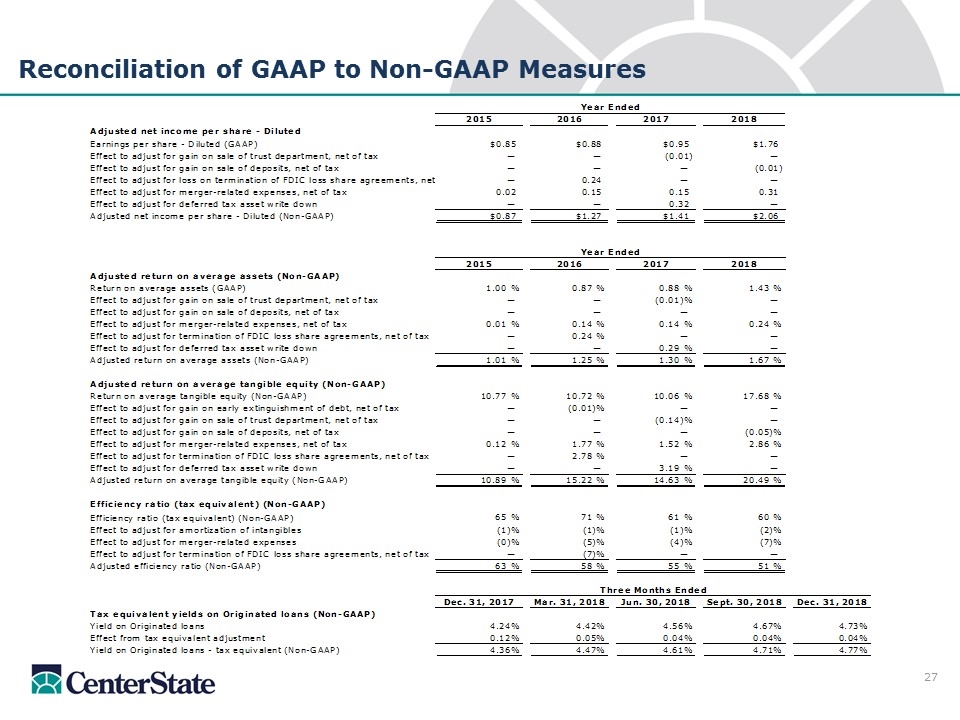
Reconciliation of GAAP to Non-GAAP Measures
CenterState has filed a registration statement on Form S-4 (No. 333-229159) with the Securities and Exchange Commission to register the shares of CenterState's common stock that will be issued to NCC's shareholders in connection with the transaction. The registration statement includes a joint proxy statement/prospectus of CenterState and NCC and a prospectus of CenterState. A definitive joint proxy statement/prospectus is being submitted to the shareholders of CenterState and the stockholders of NCC in connection with the proposed merger transaction involving CenterState and NCC. INVESTORS AND SECURITY HOLDERS ARE URGED TO READ THE REGISTRATION STATEMENT, AND JOINT PROXY/PROSPECTUS WHEN IT BECOMES AVAILABLE (AND ANY OTHER DOCUMENTS FILED WITH THE SECURITIES AND EXCHANGE COMMISSION IN CONNECTION WITH THE TRANSACTION OR INCORPORATED BY REFERENCE INTO THE JOINT PROXY/PROSPECTUS) BECAUSE SUCH DOCUMENTS WILL CONTAIN IMPORTANT INFORMATION REGARDING THE PROPOSED MERGER TRANSACTION. Investors and security holders may obtain free copies of these documents and other documents filed with the Securities and Exchange Commission on its website at www.sec.gov. Investors and security holders may also obtain free copies of the documents filed with the Securities and Exchange Commission by CenterState on its website at www.centerstatebanks.com and by NCC on its website at www.nationalbankofcommerce.com. This presentation does not constitute an offer to sell or the solicitation of an offer to buy any securities or a solicitation of any vote or approval. Before making any voting or investment decision, investors and security holders of CenterState and NCC are urged to read carefully the entire registration statement and joint proxy statement/prospectus available, including any amendments thereto, because they contain important information about the proposed transaction. Free copies of these documents may be obtained as described above. CenterState, NCC and certain of their directors and executive officers may be deemed participants in the solicitation of proxies from NCC stockholders and from CenterState shareholders in connection with the Merger. Information regarding the directors and executive officers of CenterState and NCC and other persons who may be deemed participants in the solicitation of the stockholders of NCC or the shareholders of CenterState in connection with the Merger will be included in the joint proxy statement/prospectus for NCOM’s special meeting of stockholders and CenterState special meeting of shareholders, which will be filed by CenterState with the SEC. Information about the directors and officers of CenterState and their ownership of CenterState common stock can also be found in CenterState’s definitive proxy statement in connection with its 2018 annual meeting of shareholders, as filed with the SEC on March 12, 2018, and other documents subsequently filed by CenterState with the SEC. Information about the directors and officers of NCC and their ownership of NCC common stock can also be found in NCC’s definitive proxy statement in connection with its 2018 annual meeting of stockholders, as filed with the SEC on April 20, 2018, and other documents subsequently filed by NCC with the SEC. Additional information regarding the interests of such participants will be included in the joint proxy statement/prospectus and other relevant documents regarding the Merger filed with the SEC when they become available. Additional Information
Investor Contacts Ernie Pinner John Corbett Executive Chairman President & Chief Executive Officer epinner@centerstatebank.com jcorbett@centerstatebank.com Steve Young Jennifer Idell Chief Operating Officer Chief Financial Officer syoung@centerstatebank.com jidell@centerstatebank.com Phone Number 863-293-4710


