Annual Shareholders’ Meeting April 25, 2019 Exhibit 99.1
Forward Looking Statements Information in this presentation, other than statements of historical facts, may constitute forward-looking statements, within the meaning of the Private Securities Litigation Reform Act of 1995. These statements include, but are not limited to, CenterState’s plans, objectives, expectations and intentions, and other statements that are not historical facts. Forward-looking statements may be identified by terminology such as “may,” “will,” “should,” “scheduled,” “plans,” “intends,” “anticipates,” “expects,” “believes,” estimates,” “potential,” or “continue” or negative of such terms or other comparable terminology. All forward-looking statements are subject to risks, uncertainties and other facts that may cause the actual results, performance or achievements of CenterState to differ materially from any results expressed or implied by such forward-looking statements. Such factors include, among others, the impact on failing to implement our business strategy, including our growth and acquisition strategy, including the merger with National Commerce Corporation and its integration; any litigation that has been or might be filed in connection with the merger; the ability to successfully integrate our acquisitions; additional capital requirements due to our growth plans; the impact of an increase in our asset size to over $10 billion; the risks of changes in interest rates and the level and composition of deposits; loan demand, the credit and other risks in our loan portfolio and the values of loan collateral; the impact of us not being able to manage our risk; the impact on a loss of management or other experienced employees; the impact if we failed to maintain our culture and attract and retain skilled people; the risk of changes in technology and customer preferences; the impact of any material failure or breach in our infrastructure or the infrastructure of third parties on which we rely including as a result of cyber-attacks; or material regulatory liability in areas such as BSA or consumer protection; reputational risks from such failures or liabilities or other events; legislative and regulatory changes; general competitive, political, legal, economic and market conditions and developments; financial market conditions and the results of financing efforts; changes in commodity prices and interest rates; weather, natural disasters and other catastrophic events; and other factors discussed in our filings with the Securities and Exchange Commission under the Exchange Act. Additional factors that could cause results to differ materially from those contemplated by forward-looking statements can be found in CenterState’s Annual Report on Form 10-K for the year ended December 31, 2018, and otherwise in our SEC reports and filings, which are available in the “Investor Relations” section of CenterState’s website, http://www.centerstatebanks.com. Forward-looking statements speak only as of the date they are made. You should not expect us to update any forward-looking statements. 2
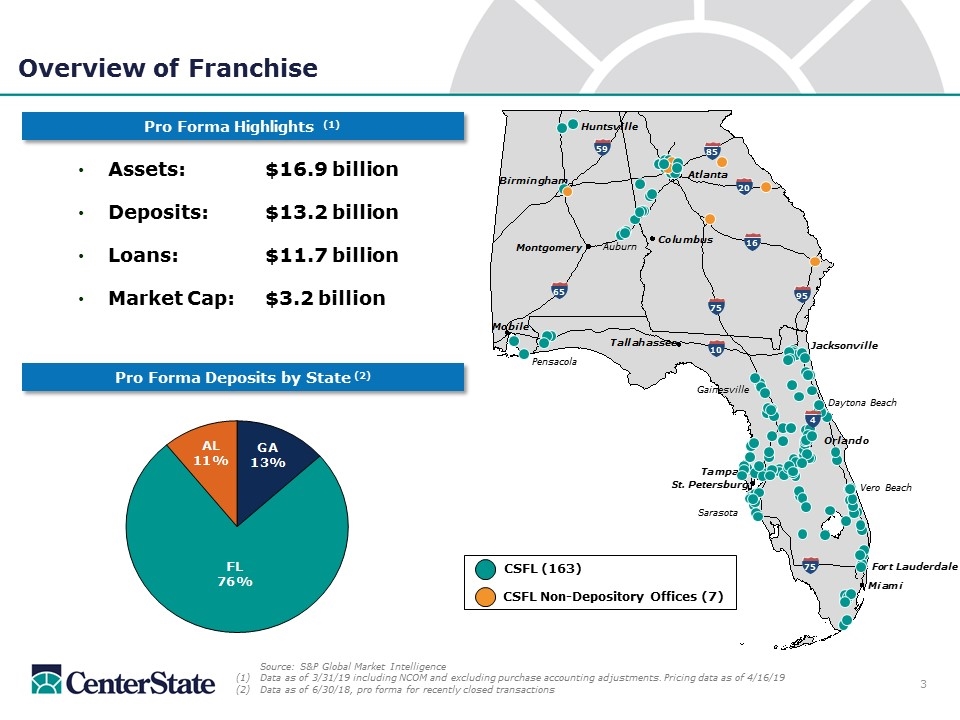
Overview of Franchise Assets: $16.9 billion Deposits: $13.2 billion Loans: $11.7 billion Market Cap: $3.2 billion Pro Forma Highlights (1) Source: S&P Global Market Intelligence Data as of 3/31/19 including NCOM and excluding purchase accounting adjustments. Pricing data as of 4/16/19 Data as of 6/30/18, pro forma for recently closed transactions Auburn Sarasota Vero Beach Daytona Beach 85 20 95 16 65 59 75 10 75 4 Pensacola Gainesville CSFL (163) CSFL Non-Depository Offices (7) Pro Forma Deposits by State (2) 3
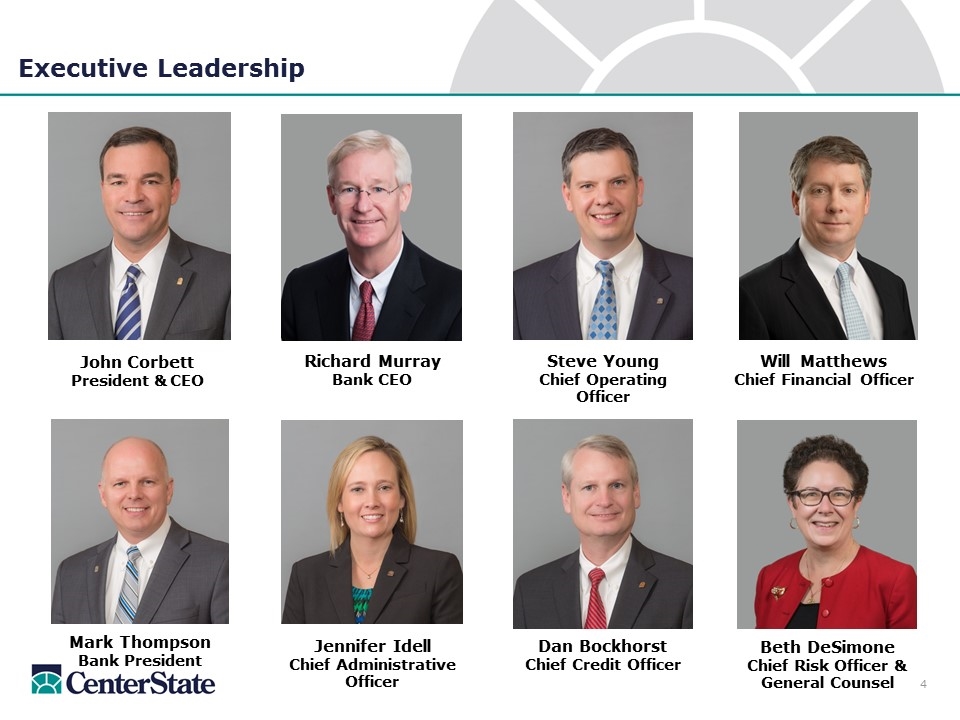
Executive Leadership John Corbett President & CEO Richard Murray Bank CEO Steve Young Chief Operating Officer Will Matthews Chief Financial Officer Dan Bockhorst Chief Credit Officer Jennifer Idell Chief Administrative Officer Beth DeSimone Chief Risk Officer & General Counsel Mark Thompson Bank President
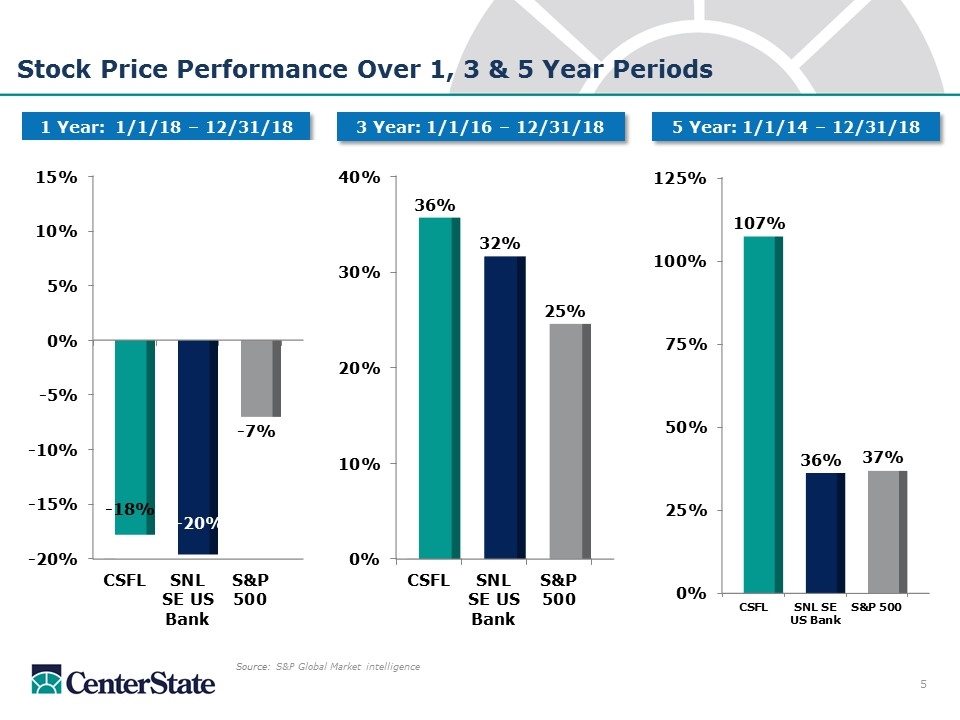
Stock Price Performance Over 1, 3 & 5 Year Periods Source: S&P Global Market intelligence 1 Year: 1/1/18 – 12/31/18 3 Year: 1/1/16 – 12/31/18 5 Year: 1/1/14 – 12/31/18 5
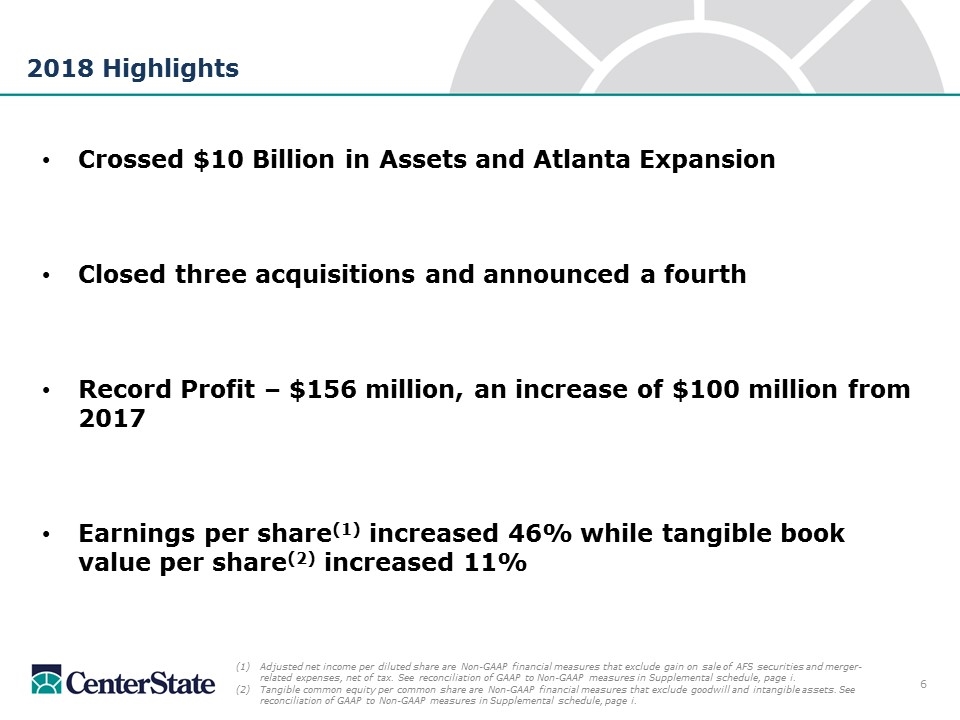
2018 Highlights Crossed $10 Billion in Assets and Atlanta Expansion Closed three acquisitions and announced a fourth Record Profit – $156 million, an increase of $100 million from 2017 Earnings per share(1) increased 46% while tangible book value per share(2) increased 11% 6 Adjusted net income per diluted share are Non-GAAP financial measures that exclude gain on sale of AFS securities and merger-related expenses, net of tax. See reconciliation of GAAP to Non-GAAP measures in Supplemental schedule, page i. Tangible common equity per common share are Non-GAAP financial measures that exclude goodwill and intangible assets. See reconciliation of GAAP to Non-GAAP measures in Supplemental schedule, page i.
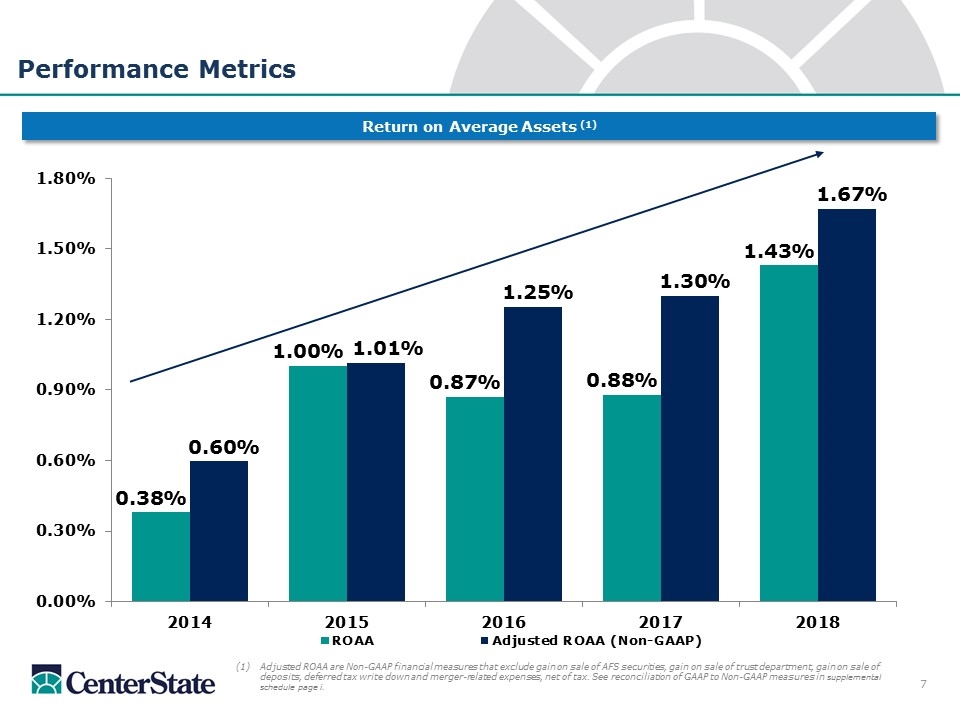
Performance Metrics Return on Average Assets (1) Adjusted ROAA are Non-GAAP financial measures that exclude gain on sale of AFS securities, gain on sale of trust department, gain on sale of deposits, deferred tax write down and merger-related expenses, net of tax. See reconciliation of GAAP to Non-GAAP measures in supplemental schedule page i. 7

Performance Metrics (continued) Efficiency Ratio (2) 8 (2) Efficiency Ratio and Adjusted Efficiency Ratio are Non-GAAP financial measures. Efficiency Ratio is defined as follows: [non-interest expense – nonrecurring expense] / [net interest income (fully tax equivalent) + non-interest income – nonrecurring income]. Adjusted Efficiency Ratio also excludes merger-related expenses and amortization of intangibles. See reconciliation of GAAP to Non-GAAP measures in Supplemental schedule page i.
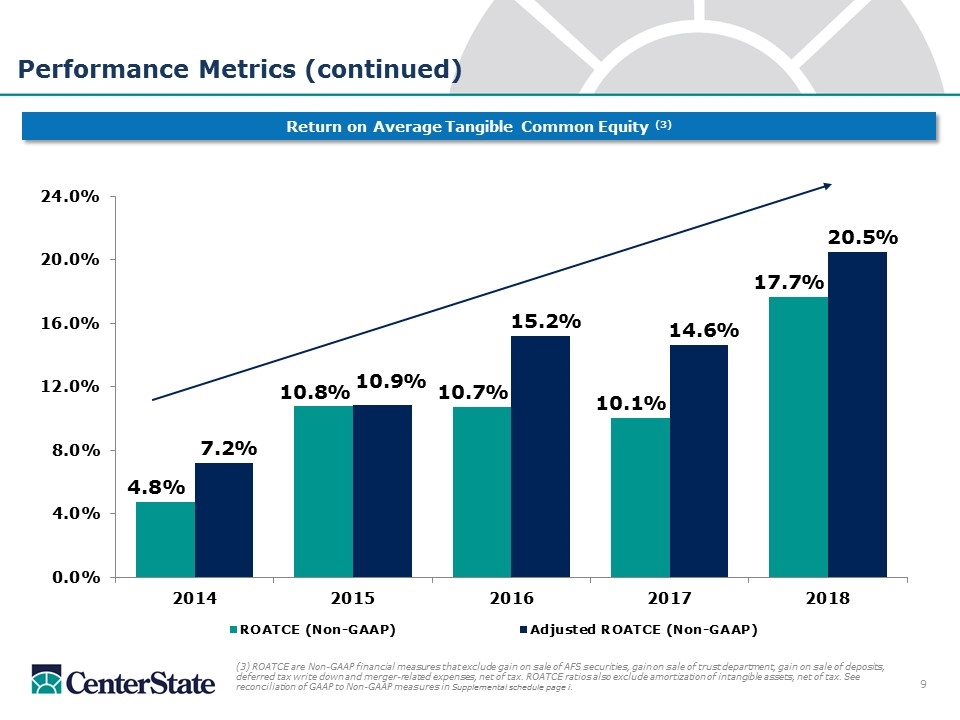
Performance Metrics (continued) Return on Average Tangible Common Equity (3) (3) ROATCE are Non-GAAP financial measures that exclude gain on sale of AFS securities, gain on sale of trust department, gain on sale of deposits, deferred tax write down and merger-related expenses, net of tax. ROATCE ratios also exclude amortization of intangible assets, net of tax. See reconciliation of GAAP to Non-GAAP measures in Supplemental schedule page i. 9
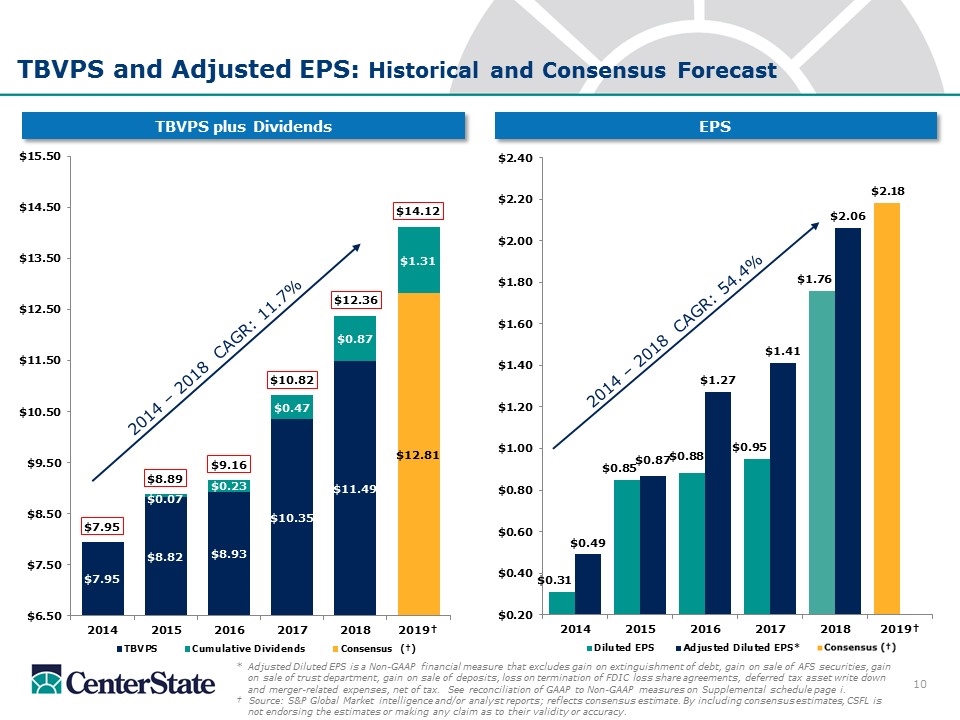
TBVPS and Adjusted EPS: Historical and Consensus Forecast *Adjusted Diluted EPS is a Non-GAAP financial measure that excludes gain on extinguishment of debt, gain on sale of AFS securities, gain on sale of trust department, gain on sale of deposits, loss on termination of FDIC loss share agreements, deferred tax asset write down and merger-related expenses, net of tax. See reconciliation of GAAP to Non-GAAP measures on Supplemental schedule page i. † Source: S&P Global Market intelligence and/or analyst reports; reflects consensus estimate. By including consensus estimates, CSFL is not endorsing the estimates or making any claim as to their validity or accuracy. TBVPS plus Dividends EPS 2014 – 2018 CAGR: 54.4% 2014 – 2018 CAGR: 11.7% 10
A Decade Has Passed 11
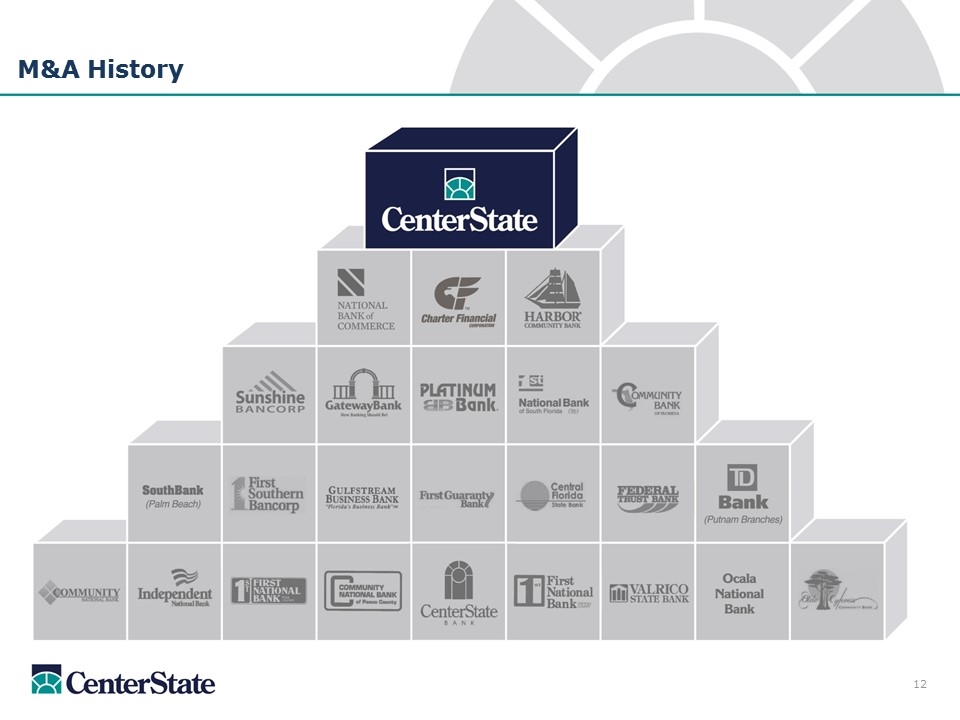
M&A History 12
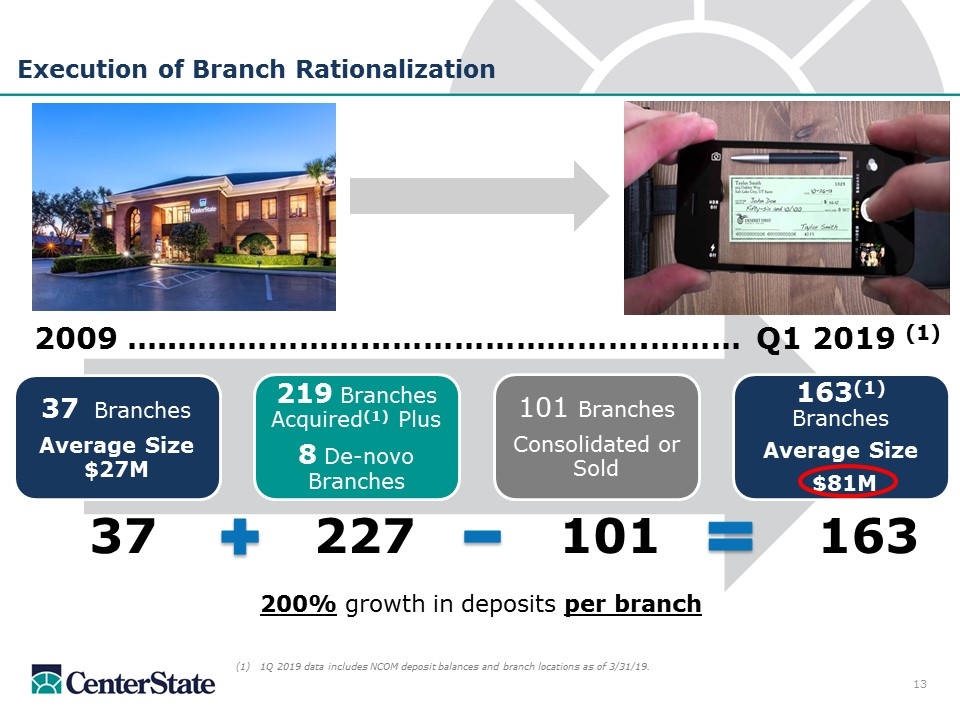
Execution of Branch Rationalization 200% growth in deposits per branch 37 227 101 163 2009 …..………………...…………………….……… Q1 2019 (1) 13 1Q 2019 data includes NCOM deposit balances and branch locations as of 3/31/19. 37 Branches Average Size $27M 219 Branches Acquired (1) Plus 8 De-novo Branches 101 Branches Consolidated or Sold 163 (1) Branches Average Size $81M
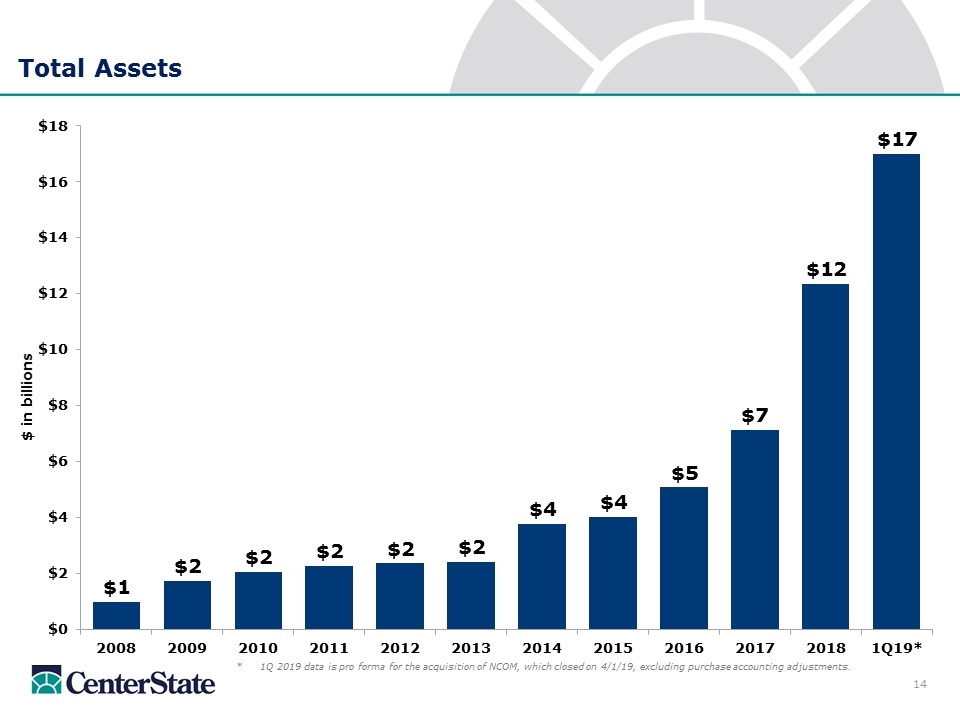
Total Assets *1Q 2019 data is pro forma for the acquisition of NCOM, which closed on 4/1/19, excluding purchase accounting adjustments. $ in billions 14
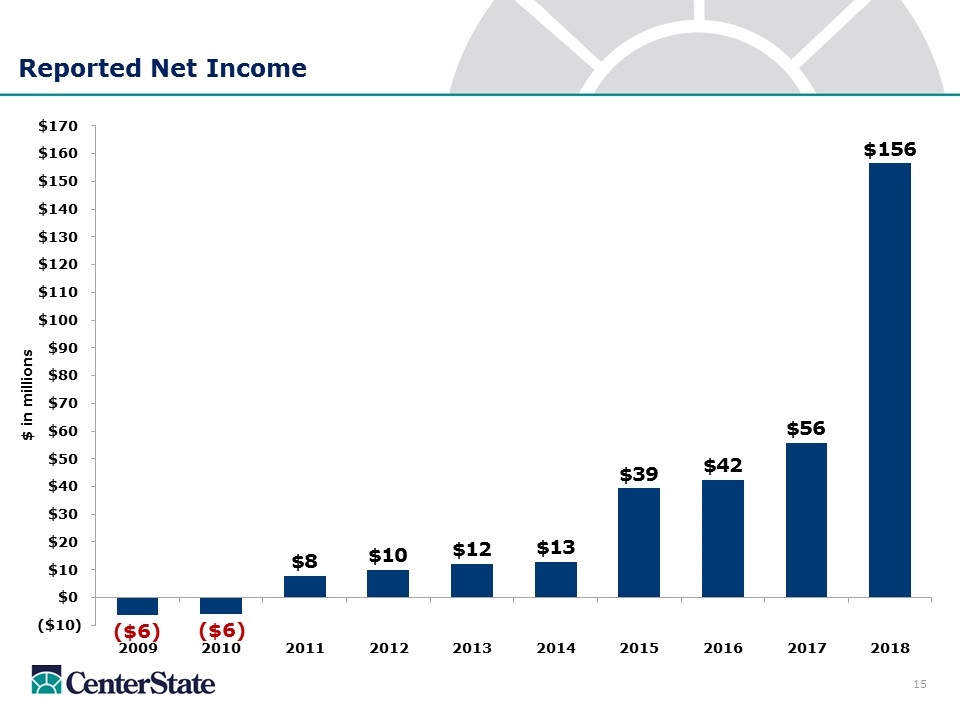
Reported Net Income $ in millions 15
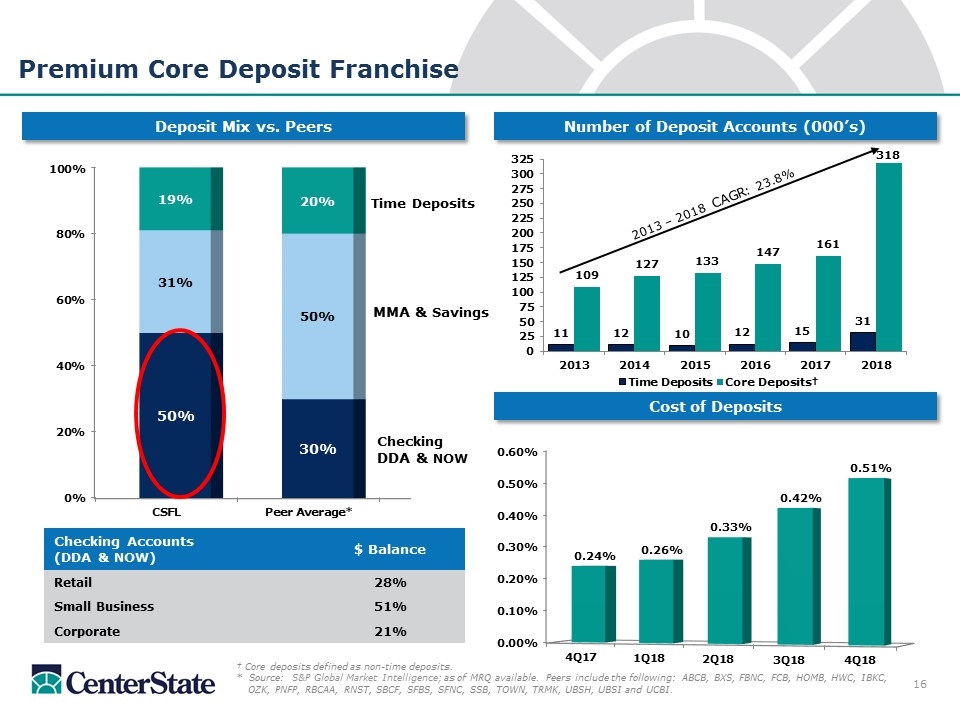
Number of Deposit Accounts (000’s) Premium Core Deposit Franchise Cost of Deposits Deposit Mix vs. Peers † Core deposits defined as non-time deposits. * Source: S&P Global Market Intelligence; as of MRQ available. Peers include the following: ABCB, BXS, FBNC, FCB, HOMB, HWC, IBKC, OZK, PNFP, RBCAA, RNST, SBCF, SFBS, SFNC, SSB, TOWN, TRMK, UBSH, UBSI and UCBI. MMA & Savings Time Deposits Checking Accounts (DDA & NOW) $ Balance Retail 28% Small Business 51% Corporate 21% Checking DDA & NOW 2013 – 2018 CAGR: 23.8% 16
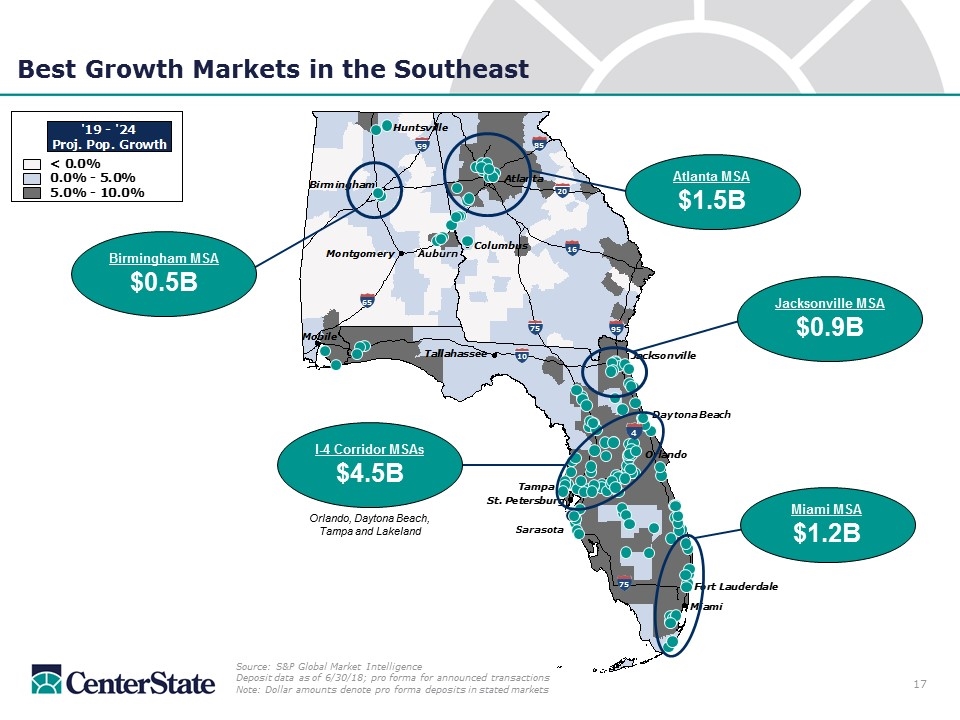
Best Growth Markets in the Southeast Auburn Sarasota Daytona Beach Source: S&P Global Market Intelligence Deposit data as of 6/30/18; pro forma for announced transactions Note: Dollar amounts denote pro forma deposits in stated markets 20 95 16 65 59 75 10 75 85 Atlanta MSA $1.5B Jacksonville MSA $0.9B Miami MSA $1.2B Birmingham MSA $0.5B I-4 Corridor MSAs $4.5B Orlando, Daytona Beach, Tampa and Lakeland 4 17
Summary and Investment Thesis CenterState is among the largest community banks headquartered in the Southeast by assets, market capitalization, deposit market share and branch footprint(1). CenterState is positioned in the premier growth markets in the Southeast. A premium core deposit franchise with a strong checking account base will outperform peers through a cycle. Continued compounded growth in tangible book value per share plus dividends and earnings per share creates long-term shareholder value. Source: S&P Global Market Intelligence (1)Data as of MRQ; deposit market share data as of 6/30/18 18

Supplemental
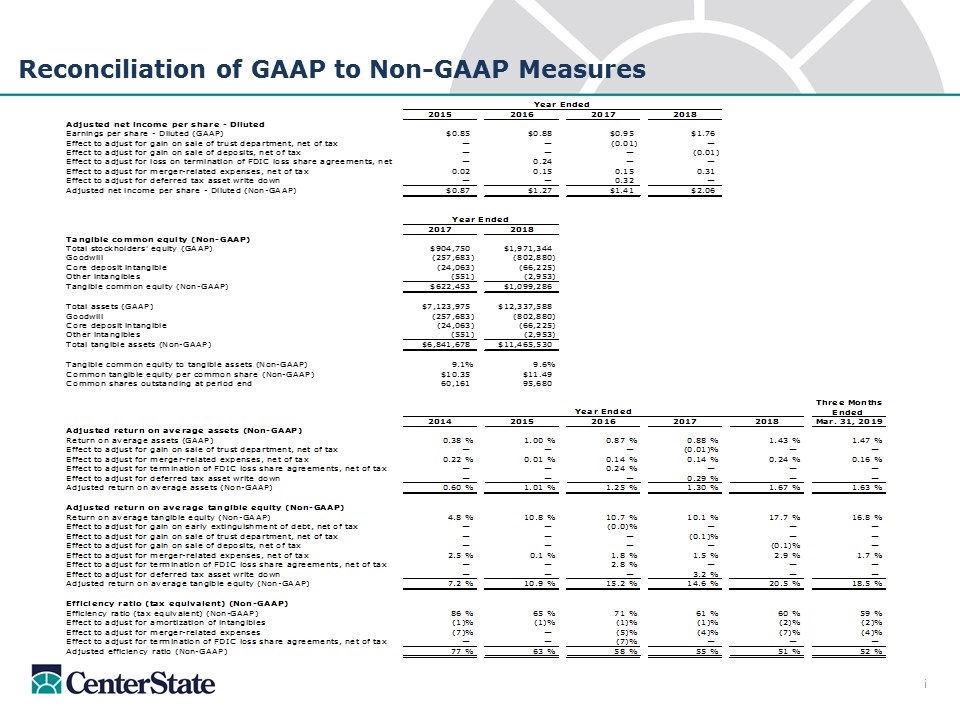
Reconciliation of GAAP to Non-GAAP Measures i


