UNITED STATES
SECURITIES AND EXCHANGE COMMISSION
Washington, D. C. 20549
Form 10-Q
(Mark One)
☒ | QUARTERLY REPORT PURSUANT TO SECTION 13 OR 15(d) OF THE SECURITIES EXCHANGE ACT OF 1934 |
For the quarterly period ended June 30, 2019
OR
☐ | TRANSITION REPORT PURSUANT TO SECTION 13 OR 15(d) OF THE SECURITIES EXCHANGE ACT OF 1934 |
For the transition period from to
Commission file number 000-32017
CENTERSTATE BANK CORPORATION
(Exact Name of Registrant as Specified in Its Charter)
Florida | | 59-3606741 |
(State or Other Jurisdiction
of Incorporation or Organization) | | (I.R.S. Employer
Identification No.) |
1101 First Street South, Suite 202
Winter Haven, Florida 33880
(Address of Principal Executive Offices)
(863) 293-4710
(Issuer’s Telephone Number, Including Area Code)
Indicate by check mark whether the registrant (1) has filed all reports required to be filed by Section 13 or 15(d) of the Securities Exchange Act of 1934 during the preceding 12 months (or for such shorter period that the registrant was required to file such reports), and (2) has been subject to such filing requirements for the past 90 days. Yes ☒ No ☐
Indicate by check mark whether the registrant has submitted electronically every Interactive Data File required to be submitted pursuant to Rule 405 of Regulation S-T (§ 232.405 of this chapter) during the preceding 12 months (or for such shorter period that the registrant was required to submit such files). Yes ☒ No ☐
Indicate by check mark whether the registrant is a large accelerated filer, an accelerated filer, a non-accelerated filer, smaller reporting company, or an emerging growth company. See the definitions of “large accelerated filer,” “accelerated filer,” “smaller reporting company,” and “emerging growth company” in Rule 12b-2 of the Exchange Act.
Large accelerated filer | | ☒ | | Accelerated filer | | ☐ |
| | | |
Non-accelerated filer | | ☐ | | Small reporting company | | ☐ |
| | | | | | |
Emerging growth company | | ☐ | | | | |
If an emerging growth company, indicate by check mark if the registrant has elected not to use the extended transition period for complying with any new or revised financial accounting standards provided pursuant to Section 13(a) of the Exchange Act. ☐
Indicate by check mark whether the registrant is a shell company (as defined in Rule 12b-2 of the Exchange Act). Yes ☐ No ☒
Securities registered pursuant to Section 12 (b) of the Act:
| | |
Title of each class | Trading Symbol(s) | Name of each exchange on which registered |
Common stock | CSFL | NASDAQ |
APPLICABLE ONLY TO CORPORATE ISSUERS:
Indicate the number of shares outstanding of each of the issuer’s classes of common stock, as of the latest practicable date:
| Common stock, par value $.01 per share | | | | 129,026,344 shares | |
(class) | | Outstanding at July 30, 2019 |
CENTERSTATE BANK CORPORATION AND SUBSIDIARIES
INDEX
2
CenterState Bank Corporation and Subsidiaries
CONDENSED CONSOLIDATED BALANCE SHEETS (unaudited)
(in thousands of dollars, except per share data)
| | June 30, 2019 | | December 31, 2018 |
ASSETS | | | | |
Cash and due from banks | | $226,422 | | $107,007 |
Deposits in other financial institutions (restricted cash) | | 173,530 | | 28,345 |
Federal funds sold and FRB deposits | | 437,386 | | 231,981 |
Cash and cash equivalents | | 837,338 | | 367,333 |
Trading securities, at fair value | | 651 | | 1,737 |
Available for sale debt securities, at fair value | | 1,792,757 | | 1,727,348 |
Held to maturity debt securities (fair value of $214,631 and $212,179 | | | | |
at June 30, 2019 and December 31, 2018, respectively) | | 210,756 | | 216,833 |
Loans held for sale (see Note 6) | | 95,108 | | 40,399 |
Loans, excluding purchased credit impaired | | 11,555,458 | | 8,181,533 |
Purchased credit impaired loans | | 157,303 | | 158,971 |
Allowance for loan losses | | (40,653) | | (39,770) |
Net Loans | | 11,672,108 | | 8,300,734 |
Bank premises and equipment, net | | 289,892 | | 227,454 |
Right-of-use lease assets | | 35,082 | | — |
Accrued interest receivable | | 43,856 | | 33,143 |
FHLB, FRB and other stock, at cost | | 75,325 | | 79,584 |
Goodwill | | 1,204,417 | | 802,880 |
Core deposit intangible, net | | 99,200 | | 66,225 |
Other intangible assets, net | | 4,620 | | 2,953 |
Bank owned life insurance | | 326,689 | | 267,820 |
Other repossessed real estate owned | | 5,881 | | 2,909 |
Deferred income tax asset, net | | 44,637 | | 51,462 |
Bank property held for sale | | 31,679 | | 25,080 |
Interest rate swap derivatives, at fair value | | 229,735 | | 92,475 |
Prepaid expense and other assets | | 36,866 | | 31,219 |
TOTAL ASSETS | | $17,036,597 | | $12,337,588 |
| | | | |
LIABILITIES AND EQUITY | | | | |
Deposits: | | | | |
Demand - non-interest bearing | | $3,990,883 | | $2,923,640 |
Demand - interest bearing | | 2,493,870 | | 1,811,006 |
Savings and money market accounts | | 4,294,149 | | 2,920,730 |
Time deposits | | 2,433,183 | | 1,821,960 |
Total deposits | | 13,212,085 | | 9,477,336 |
| | | | |
Securities sold under agreement to repurchase | | 78,277 | | 57,772 |
Federal funds purchased | | 276,963 | | 294,360 |
Other borrowed funds | | 199,727 | | 361,000 |
Corporate debentures | | 32,591 | | 32,415 |
Accrued interest payable | | 4,661 | | 2,627 |
Interest rate swap derivatives, at fair value | | 231,735 | | 92,892 |
Operating lease liabilities | | 35,136 | | — |
Payables and accrued expenses | | 74,910 | | 47,842 |
Total liabilities | | 14,146,085 | | 10,366,244 |
| | | | |
Common stockholders' equity: | | | | |
Common stock, $.01 par value: 200,000,000 shares authorized; 129,006,471 and | | | | |
95,679,596 shares issued and outstanding at June 30, 2019 | | | | |
and December 31, 2018, respectively | | 1,290 | | 957 |
Additional paid-in capital | | 2,496,105 | | 1,699,031 |
Retained earnings | | 367,108 | | 293,777 |
Accumulated other comprehensive income (loss) | | 13,874 | | (22,421) |
Total common stockholders' equity | | 2,878,377 | | 1,971,344 |
Noncontrolling interest | | 12,135 | | — |
Total equity | | 2,890,512 | | 1,971,344 |
| | | | |
TOTAL LIABILITIES AND EQUITY | | $17,036,597 | | $12,337,588 |
See notes to the accompanying condensed consolidated financial statements
3
CenterState Bank Corporation and Subsidiaries
CONDENSED CONSOLIDATED STATEMENTS OF INCOME AND COMPREHENSIVE INCOME (unaudited)
(in thousands of dollars, except per share data)
| | Three months ended June 30, | | Six months ended June 30, |
| | 2019 | | 2018 | | 2019 | | 2018 |
Interest income: | | | | | | | | |
Loans | | $167,676 | | $97,642 | | $283,961 | | $187,572 |
Investment securities: | | | | | | | | |
Taxable | | 12,740 | | 10,325 | | 25,026 | | 20,744 |
Tax-exempt | | 1,713 | | 1,559 | | 3,429 | | 3,116 |
Federal funds sold and other | | 3,124 | | 1,103 | | 5,119 | | 2,356 |
| | 185,253 | | 110,629 | | 317,535 | | 213,788 |
Interest expense: | | | | | | | | |
Deposits | | 23,037 | | 6,668 | | 36,360 | | 11,804 |
Securities sold under agreement to repurchase | | 299 | | 138 | | 535 | | 260 |
Federal funds purchased and other borrowings | | 2,679 | | 2,771 | | 6,657 | | 5,190 |
Corporate debentures | | 557 | | 523 | | 1,127 | | 987 |
| | 26,572 | | 10,100 | | 44,679 | | 18,241 |
| | | | | | | | |
Net interest income | | 158,681 | | 100,529 | | 272,856 | | 195,547 |
Provision for loan losses | | 2,792 | | 2,933 | | 3,845 | | 4,233 |
Net interest income after loan loss provision | | 155,889 | | 97,596 | | 269,011 | | 191,314 |
| | | | | | | | |
Non-interest income: | | | | | | | | |
Correspondent banking capital markets revenue | | 10,362 | | 6,008 | | 18,334 | | 12,898 |
Other correspondent banking related revenue | | 1,172 | | 1,068 | | 2,200 | | 2,301 |
Mortgage banking revenue | | 6,803 | | 2,616 | | 10,996 | | 5,218 |
Small business administration loans revenue | | 1,252 | | 1,027 | | 1,940 | | 2,015 |
Service charges on deposit accounts | | 7,507 | | 4,861 | | 14,185 | | 9,695 |
Debit, prepaid, ATM and merchant card related fees | | 6,376 | | 3,498 | | 11,394 | | 7,225 |
Wealth management related revenue | | 875 | | 640 | | 1,482 | | 1,256 |
Bank owned life insurance income | | 2,070 | | 1,374 | | 3,696 | | 2,768 |
Net (loss) gain on sale of securities available for sale debt securities | | (5) | | — | | 12 | | (22) |
Other non-interest income | | 1,531 | | 1,497 | | 3,004 | | 2,273 |
Total other income | | 37,943 | | 22,589 | | 67,243 | | 45,627 |
See notes to the accompanying condensed consolidated financial statements
4
CenterState Bank Corporation and Subsidiaries
CONDENSED CONSOLIDATED STATEMENTS OF INCOME AND COMPREHENSIVE INCOME (unaudited)
(in thousands of dollars, except per share data)
| | Three months ended June 30, | | Six months ended June 30, |
| | 2019 | | 2018 | | 2019 | | 2018 |
Non-interest expense: | | | | | | | | |
Salaries, wages and employee benefits | | 67,516 | | 40,683 | | 115,909 | | 82,576 |
Occupancy expense | | 7,752 | | 4,968 | | 13,354 | | 9,836 |
Depreciation of premises and equipment | | 3,550 | | 2,322 | | 6,400 | | 4,597 |
Supplies, stationary and printing | | 822 | | 558 | | 1,570 | | 1,094 |
Marketing expenses | | 1,797 | | 1,425 | | 3,817 | | 2,839 |
Data processing expense | | 5,525 | | 3,453 | | 9,181 | | 7,958 |
Legal, audit and other professional fees | | 2,106 | | 1,332 | | 3,548 | | 2,263 |
Amortization of intangibles | | 4,435 | | 2,240 | | 7,249 | | 4,549 |
Postage and delivery | | 963 | | 746 | | 1,888 | | 1,434 |
ATM and debit card and merchant card related expenses | | 1,304 | | 860 | | 2,757 | | 1,624 |
Bank regulatory expenses | | 2,074 | | 1,209 | | 3,690 | | 2,219 |
Gain on sale of repossessed real estate (“OREO”) | | (63) | | (745) | | (16) | | (899) |
Valuation write down of repossessed real estate (“OREO”) | | 57 | | 107 | | 165 | | 294 |
(Gain) loss on repossessed assets other than real estate | | (84) | | (6) | | (71) | | 19 |
Foreclosure related expenses | | 850 | | 676 | | 1,411 | | 1,235 |
Merger related expenses | | 15,739 | | 14,140 | | 22,104 | | 22,849 |
Impairment on bank property held for sale | | 315 | | 891 | | 422 | | 2,340 |
Other expenses | | 7,331 | | 4,753 | | 13,084 | | 8,781 |
Total other expenses | | 121,989 | | 79,612 | | 206,462 | | 155,608 |
| | | | | | | | |
Income before provision for income taxes | | 71,843 | | 40,573 | | 129,792 | | 81,333 |
Provision for income taxes | | 16,721 | | 8,410 | | 30,027 | | 13,534 |
Net income | | 55,122 | | 32,163 | | 99,765 | | 67,799 |
Earnings attributable to noncontrolling interest | | 599 | | — | | 599 | | — |
Net income attributable to CenterState Bank Corporation | | $54,523 | | $32,163 | | $99,166 | | $67,799 |
| | | | | | | | |
Net income | | $55,122 | | $32,163 | | $99,765 | | $67,799 |
Other comprehensive gain (loss) income, net of tax: | | | | | | | | |
Unrealized available for sale debt securities holding gain (loss), net of | | | | | | | | |
income taxes of $5,109, ($1,713), $12,423, and ($7,994), respectively | | 15,039 | | (5,046) | | 36,610 | | (23,545) |
Unrealized interest rate swap holding loss, net of | | | | | | | | |
income taxes of ($104), $0, ($104), and $0, respectively | | (306) | | — | | (306) | | — |
Less: reclassified adjustments for loss (gain) included in net income, | | | | | | | | |
net income tax (benefit) expense of $(1), $0, $3, and $(6), respectively | | 4 | | — | | (9) | | 16 |
| | | | | | | | |
Net change in accumulated other comprehensive income (loss) | | $14,737 | | $(5,046) | | $36,295 | | $(23,529) |
| | | | | | | | |
Total comprehensive income | | $69,859 | | $27,117 | | $136,060 | | $44,270 |
Comprehensive income attributable to noncontrolling interest | | 599 | | — | | 599 | | — |
Total comprehensive income attributable to CenterState Bank Corporation | | $69,260 | | $27,117 | | $135,461 | | $44,270 |
| | | | | | | | |
Earnings per share: | | | | | | | | |
Basic | | $0.42 | | $0.38 | | $0.88 | | $0.81 |
Diluted | | $0.42 | | $0.38 | | $0.87 | | $0.80 |
Common shares used in the calculation of earnings per share: | | | | | | | | |
Basic (1) | | 129,847,591 | | 83,870,055 | | 112,888,441 | | 83,506,916 |
Diluted (1) | | 130,767,562 | | 85,006,892 | | 113,704,565 | | 84,893,852 |
(1)Excludes participating shares
See notes to the accompanying condensed consolidated financial statements
5
CenterState Bank Corporation and Subsidiaries
CONDENSED CONSOLIDATED STATEMENTS OF CHANGES IN EQUITY
For the three months ended June 30, 2019 and 2018 (unaudited)
(in thousands of dollars, except per share data)
| | | | | | | | | | Accumulated | | | | |
| | Number of | | | | Additional | | | | other | | | | |
| | common | | Common | | paid in | | Retained | | comprehensive | | Noncontrolling | | Total |
| | shares | | stock | | capital | | earnings | | income (loss) | | interest | | equity |
Balances at April 01, 2018 | | 83,757,950 | | $837 | | $1,341,986 | | $200,511 | | $(25,488) | | $ — | | $1,517,846 |
| | | | | | | | | | | | | | |
Net income | | | | | | | | 32,163 | | | | | | 32,163 |
Unrealized holding loss on | | | | | | | | | | | | | | |
available for sale securities, net of | | | | | | | | | | | | | | |
deferred income tax of $1,713 | | | | | | | | | | (5,046) | | | | (5,046) |
| | | | | | | | | | | | | | |
Dividends paid - common ($0.10 per share) | | | | | | | | (8,404) | | | | | | (8,404) |
Stock grants issued | | 10,583 | | — | | — | | | | | | | | — |
Stock based compensation expense | | | | | | 1,009 | | | | | | | | 1,009 |
Stock options exercised | | 352,466 | | 4 | | 2,694 | | | | | | | | 2,698 |
Stock repurchase | | (578) | | — | | (18) | | | | | | | | (18) |
Balances at June 30, 2018 | | 84,120,421 | | $841 | | $1,345,671 | | $224,270 | | $(30,534) | | $ — | | $1,540,248 |
| | | | | | | | | | | | | | |
| | | | | | | | | | | | | | |
Balances at April 01, 2019 | | 95,913,307 | | $959 | | $1,701,047 | | $326,409 | | $(863) | | $ — | | $2,027,552 |
| | | | | | | | | | | | | | |
Net income | | | | | | | | 54,523 | | | | 599 | | 55,122 |
Unrealized holding gain on | | | | | | | | | | | | | | |
available for sale securities, net of | | | | | | | | | | | | | | |
deferred income tax of $5,108 | | | | | | | | | | 15,043 | | | | 15,043 |
Unrealized holding loss on | | | | | | | | | | | | | | |
interest rate swaps, net of | | | | | | | | | | | | | | |
deferred income tax of $104 | | | | | | | | | | (306) | | | | (306) |
Cumulative adjustment pursuant to adoption | | | | | | | | | | | | | | |
of ASU 842 (Note 11) | | | | | | | | 371 | | | | | | 371 |
Dividends paid - common ($0.11 per share) | | | | | | | | (14,195) | | | | | | (14,195) |
Stock grants issued | | 11,304 | | — | | — | | | | | | | | — |
Stock based compensation expense | | | | | | 1,286 | | | | | | | | 1,286 |
Stock options exercised | | 95,332 | | 1 | | 1,057 | | | | | | | | 1,058 |
Stock repurchase | | (1,681,440) | | (17) | | (38,614) | | | | | | | | (38,631) |
Stock issued pursuant to NCOM acquisition | | 34,667,968 | | 347 | | 825,097 | | | | | | | | 825,444 |
Stock options acquired and converted | | | | | | | | | | | | | | |
pursuant to NCOM acquisition | | | | | | 6,232 | | | | | | | | 6,232 |
Noncontrolling interest from NCOM acquisition | | | | | | | | | | | | 12,002 | | 12,002 |
Distributions paid to noncontrolling interest | | | | | | | | | | | | (466) | | (466) |
Balances at June 30, 2019 | | 129,006,471 | | $1,290 | | $2,496,105 | | $367,108 | | $13,874 | | $12,135 | | $2,890,512 |
See notes to the accompanying condensed consolidated financial statements
6
CenterState Bank Corporation and Subsidiaries
CONDENSED CONSOLIDATED STATEMENTS OF CHANGES IN EQUITY
For the six months ended June 30, 2019 and 2018 (unaudited)
(in thousands of dollars, except per share data)
| | | | | | | | | | Accumulated | | | | |
| | Number of | | | | Additional | | | | other | | | | |
| | common | | Common | | paid in | | Retained | | comprehensive | | Noncontrolling | | Total |
| | shares | | stock | | capital | | earnings | | income (loss) | | interest | | equity |
Balances at January 1, 2018 | | 60,161,334 | | $602 | | $737,905 | | $173,248 | | $(7,005) | | $ — | | $904,750 |
| | | | | | | | | | | | | | |
Net income | | | | | | | | 67,799 | | | | | | 67,799 |
Unrealized holding loss on | | | | | | | | | | | | | | |
available for sale securities, net of | | | | | | | | | | | | | | |
deferred income tax of $7,988 | | | | | | | | | | (23,529) | | | | (23,529) |
| | | | | | | | | | | | | | |
Dividends paid - common ($0.20 per share) | | | | | | | | (16,777) | | | | | | (16,777) |
Stock grants issued | | 195,151 | | 2 | | (2) | | | | | | | | — |
Stock based compensation expense | | | | | | 2,000 | | | | | | | | 2,000 |
Stock options exercised | | 1,699,158 | | 17 | | 13,837 | | | | | | | | 13,854 |
Stock repurchase | | (37,506) | | (1) | | (997) | | | | | | | | (998) |
Stock issued pursuant to Sunshine acquisition | | 7,050,645 | | 70 | | 181,343 | | | | | | | | 181,413 |
Stock options acquired and converted | | | | | | | | | | | | | | |
pursuant to Sunshine acquisition | | | | | | 6,432 | | | | | | | | 6,432 |
Stock issued pursuant to HCBF acquisition | | 15,051,639 | | 151 | | 387,128 | | | | | | | | 387,279 |
Stock options acquired and converted | | | | | | | | | | | | | | |
pursuant to HCBF acquisition | | | | | | 18,025 | | | | | | | | 18,025 |
Balances at June 30, 2018 | | 84,120,421 | | $841 | | $1,345,671 | | $224,270 | | $(30,534) | | $ — | | $1,540,248 |
| | | | | | | | | | | | | | |
| | | | | | | | | | | | | | |
Balances at January 01, 2019 | | 95,679,596 | | $957 | | $1,699,031 | | $293,777 | | $(22,421) | | $ — | | $1,971,344 |
| | | | | | | | | | | | | | |
Net income | | | | | | | | 99,166 | | | | 599 | | 99,765 |
Unrealized holding gain on | | | | | | | | | | | | | | |
available for sale securities, net of | | | | | | | | | | | | | | |
deferred income tax of $12,426 | | | | | | | | | | 36,601 | | | | 36,601 |
Unrealized holding loss on | | | | | | | | | | | | | | |
interest rate swaps, net of | | | | | | | | | | | | | | |
deferred income tax of $104 | | | | | | | | | | (306) | | | | (306) |
Cumulative adjustment pursuant to adoption | | | | | | | | | | | | | | |
of ASU 842 (Note 11) | | | | | | | | (1,093) | | | | | | (1,093) |
Dividends paid - common ($0.22 per share) | | | | | | | | (24,742) | | | | | | (24,742) |
Stock grants issued | | 144,222 | | 1 | | (1) | | | | | | | | — |
Stock based compensation expense | | | | | | 2,504 | | | | | | | | 2,504 |
Stock options exercised | | 212,096 | | 2 | | 2,255 | | | | | | | | 2,257 |
Stock repurchase | | (1,697,411) | | (17) | | (39,013) | | | | | | | | (39,030) |
Stock issued pursuant to NCOM acquisition | | 34,667,968 | | 347 | | 825,097 | | | | | | | | 825,444 |
Stock options acquired and converted | | | | | | | | | | | | | | |
pursuant to NCOM acquisition | | | | | | 6,232 | | | | | | | | 6,232 |
Noncontrolling interest from NCOM acquisition | | | | | | | | | | | | 12,002 | | 12,002 |
Distributions paid to noncontrolling interest | | | | | | | | | | | | (466) | | (466) |
Balances at June 30, 2019 | | 129,006,471 | | $1,290 | | $2,496,105 | | $367,108 | | $13,874 | | $12,135 | | $2,890,512 |
See notes to the accompanying condensed consolidated financial statements
7
CenterState Bank Corporation and Subsidiaries
CONDENSED CONSOLIDATED STATEMENTS OF CASH FLOWS (unaudited)
(in thousands of dollars, except per share data)
| | Six months ended June 30, |
| | 2019 | | 2018 |
Cash flows from operating activities: | | | | |
Net income | | $99,765 | | $67,799 |
Adjustments to reconcile net income to net cash provided by operating activities: | | | | |
Provision for loan losses | | 3,845 | | 4,233 |
Depreciation of premises and equipment | | 6,400 | | 4,597 |
Accretion of purchase accounting adjustments | | (28,373) | | (27,114) |
Net amortization of investment securities | | 5,164 | | 6,284 |
Net deferred loan origination fees | | 1,663 | | 73 |
Loss on sale of securities available for sale debt securities | | (12) | | 22 |
Trading securities revenue | | (54) | | (22) |
Purchases of trading securities | | (70,028) | | (187,179) |
Proceeds from sale of trading securities | | 71,168 | | 192,130 |
Repossessed real estate owned valuation write down | | 165 | | 294 |
Gain on sale of repossessed real estate owned | | (16) | | (899) |
(Gain) loss on repossessed assets other than real estate | | (71) | | 19 |
Gain on sale of residential loans held for sale | | (10,664) | | (3,944) |
Residential loans originated and held for sale | | (392,135) | | (150,316) |
Proceeds from sale of residential loans held for sale | | 363,619 | | 144,387 |
Net change in fair value of residential loans held for sale | | (941) | | (722) |
Gain on disposal of and or sale of fixed assets | | (11) | | (10) |
Gain on disposal of bank property held for sale | | (1,079) | | (1,090) |
Impairment on bank property held for sale | | 422 | | 2,340 |
Gain on sale of small business administration loans | | (1,940) | | (2,015) |
Small business administration loans originated for sale | | (21,059) | | (19,686) |
Proceeds from sale of small business administration loans | | 22,999 | | 21,701 |
Deferred income taxes | | 11,160 | | 10,586 |
Tax deduction in excess of book deduction for stock awards | | (508) | | (5,840) |
Stock based compensation expense | | 2,504 | | 2,000 |
Bank owned life insurance income | | (3,696) | | (2,768) |
Net cash from changes in: | | | | |
Net changes in accrued interest receivable, prepaid expenses, and other assets | | 23,911 | | 48,483 |
Net change in accrued interest payable, accrued expense, and other liabilities | | (21,417) | | 8,451 |
Net cash provided by operating activities | | $60,781 | | $111,794 |
See notes to the accompanying condensed consolidated financial statements
8
CenterState Bank Corporation and Subsidiaries
CONDENSED CONSOLIDATED STATEMENTS OF CASH FLOWS (unaudited)
(in thousands of dollars, except per share data)
(continued)
| | Six months ended June 30, |
| | 2019 | | 2018 |
Cash flows from investing activities: | | | | |
Available for sale debt securities: | | | | |
Purchases of investment securities | | $(3,282) | | $(89,216) |
Purchases of mortgage-backed securities | | (73,781) | | (228,327) |
Proceeds from pay-downs of mortgage-backed securities | | 125,824 | | 102,257 |
Proceeds from sales of investment securities | | 44,300 | | 58,768 |
Proceeds from sales of mortgage-backed securities | | 64,177 | | 305,384 |
Proceeds from called investment securities | | — | | 1,045 |
Proceeds from maturities of investment securities | | 295 | | — |
Held to maturity debt securities: | | | | |
Proceeds from pay-downs of mortgage-backed securities | | 5,498 | | 7,867 |
Purchases of FHLB, FRB and other stock | | (15,342) | | (12,723) |
Proceeds from sales of FHLB, FRB and other stock | | 36,677 | | 18,819 |
Net increase in loans | | (20,931) | | (227,620) |
Purchases of premises and equipment, net | | (10,239) | | (10,666) |
Proceeds from sale of repossessed real estate | | 3,635 | | 6,938 |
Proceeds from sale of fixed assets | | 1 | | 11 |
Proceeds from sale of bank property held for sale | | 11,889 | | 8,409 |
Net cash from bank acquisitions | | 268,504 | | 81,293 |
Net cash provided by investing activities | | $437,225 | | $22,239 |
Cash flows from financing activities: | | | | |
Net increase in deposits | | 249,758 | | 188,083 |
Net increase (decrease) in securities sold under agreement to repurchase | | 1,672 | | (634) |
Net decrease in federal funds purchased | | (17,397) | | (97,278) |
Net decrease in other borrowings | | (200,000) | | (107,920) |
Net decrease in payable to shareholders for acquisitions | | (53) | | (18) |
Stock options exercised | | 2,257 | | 13,854 |
Stock repurchased | | (39,030) | | (998) |
Dividends paid | | (24,742) | | (16,777) |
Cash distribution paid to noncontrolling interest | | (466) | | — |
Net cash used in financing activities | | $(28,001) | | $(21,688) |
| | | | |
Net increase in cash and cash equivalents | | 470,005 | | 112,345 |
Cash and cash equivalents, beginning of period | | 367,333 | | 280,619 |
Cash and cash equivalents, end of period | | $837,338 | | $392,964 |
| | | | |
Supplemental Information | | | | |
Transfer of loans to other real estate owned | | $5,881 | | $2,578 |
Transfers of bank property to held for sale | | 6,450 | | 3,502 |
New operating right-of-use assets | | 35,617 | | — |
| | | | |
Cash paid during the period for: | | | | |
Interest | | $44,288 | | $18,912 |
Income taxes | | 21,671 | | 9,693 |
See notes to the accompanying condensed consolidated financial statements
9
CenterState Bank Corporation and Subsidiaries
NOTES TO CONDENSED CONSOLIDATED FINANCIAL STATEMENTS (unaudited)
(in thousands of dollars, except per share data)
NOTE 1: Nature of operations and basis of presentation
The consolidated financial statements include the accounts of CenterState Bank Corporation (the “Parent Company,” “Company” or “CSFL”), and its wholly owned subsidiary bank, CenterState Bank, N.A. (“CenterState” or “Bank”), and non-bank subsidiaries, R4ALL, Inc., CSFL Insurance Corp. and National Commerce Risk Management, Inc. The Company operates as one of the largest community bank franchises headquartered in the state of Florida. The Bank provides traditional retail, commercial, mortgage, wealth management and SBA services throughout its Florida, Georgia and Alabama branch network and customer relationships in neighboring states.
The Bank, headquartered in Winter Haven, Florida, also operates a correspondent banking and capital markets division, of which the majority of its bond salesmen, traders and operational personnel are primarily housed in facilities located in Birmingham, Alabama and Atlanta, Georgia. This division’s primary revenue generating activities are related to its capital markets division, which includes commissions earned on fixed income security sales, fees from hedging services, loan brokerage fees and consulting fees for services related to these activities; and its correspondent banking division, which includes spread income earned on correspondent bank deposits (i.e. federal funds purchased) and correspondent bank checking account deposits and fees from safe-keeping activities, bond accounting services for correspondents, asset/liability consulting related activities, international wires, and other clearing and corporate checking account services. The customer base includes small to medium size financial institutions primarily located in the Southeastern United States, although clients are located across the United States. The Bank also controls CBI Holding Company, LLC (“CBI”), which in turn owns Corporate Billing, LLC (“Corporate Billing”), a transaction-based finance company headquartered in Decatur, Alabama that provides factoring, invoicing, collection and accounts receivable management services to transportation companies and automotive parts and service providers nationwide.
R4ALL, Inc. manages troubled loans purchased from the Bank to their eventual disposition. CSFL Insurance Corp. is a captive insurance subsidiary pursuant to Section 831(b) of the U.S. Tax Code. National Commerce Risk Management, Inc., acquired from the National Commerce Corporation (“NCOM”) transaction, is also a captive insurance subsidiary pursuant to Section 831(b) of the U.S. Tax Code.
The accompanying unaudited condensed consolidated financial statements have been prepared in accordance with accounting principles generally accepted in the United States of America for interim financial statements and with the instructions to Form 10-Q. Accordingly, they do not include all of the information and footnotes required by accounting principles generally accepted in the United States of America for complete financial statements. These statements should be read in conjunction with the consolidated financial statements included in the Annual Report on Form 10-K for the year ended December 31, 2018. In the Company’s opinion, all adjustments, consisting primarily of normal recurring adjustments, necessary for a fair presentation of the results for the interim periods have been made. The results of operations of the three and six-month ended June 30, 2019 are not necessarily indicative of the results expected for the full year.
Some items in the prior period financial statements were reclassified to conform to the current presentation. Reclassifications had no effect on prior period net income or shareholders’ equity.
NOTE 2: Common stock outstanding and earnings per share data
The two-class method is used in the calculation of basic and diluted earnings per share. Under the two-class method, earnings available to common shareholders for the period are allocated between common shareholders and participating securities according to dividends declared (or accumulated) and participation rights in undistributed earnings. There were no anti-dilutive stock options for the three and six-month periods ending June 30, 2019 and 2018. The following table presents the factors used in the earnings per share computations for the periods indicated.
10
CenterState Bank Corporation and Subsidiaries
NOTES TO CONDENSED CONSOLIDATED FINANCIAL STATEMENTS (unaudited)
(in thousands of dollars, except per share data)
| | | | | | | | | |
| | Three months ended June 30, | | Six months ended June 30, |
| | 2019 | | 2018 | | 2019 | | 2018 | |
Basic | | | | | | | | | |
Net income available to common shareholders | | $54,523 | | $32,163 | | $99,166 | | $67,799 | |
Less: Earnings allocated to participating securities | | (21) | | (26) | | (44) | | (56) | |
Net income allocated to common shareholders | | $54,502 | | $32,137 | | $99,122 | | $67,743 | |
| | | | | | | | | |
Weighted average common shares outstanding | | | | | | | | | |
including participating securities | | 129,897,191 | | 83,938,755 | | 112,938,041 | | 83,575,831 | |
Less: Participating securities (1) | | (49,600) | | (68,700) | | (49,600) | | (68,915) | |
Average shares | | 129,847,591 | | 83,870,055 | | 112,888,441 | | 83,506,916 | |
Basic earnings per common share | | $0.42 | | $0.38 | | $0.88 | | $0.81 | |
| | | | | | | | | |
Diluted | | | | | | | | | |
Net income available to common shareholders | | $54,502 | | $32,137 | | $99,122 | | $67,743 | |
Weighted average common shares outstanding for | | | | | | | | | |
basic earnings per common share | | 129,847,591 | | 83,870,055 | | 112,888,441 | | 83,506,916 | |
Add: Dilutive effects of stock based compensation awards and warrants | | 919,971 | | 1,136,837 | | 816,124 | | 1,386,936 | |
Average shares and dilutive potential common shares | | 130,767,562 | | 85,006,892 | | 113,704,565 | | 84,893,852 | |
Diluted earnings per common share | | $0.42 | | $0.38 | | $0.87 | | $0.80 | |
| (1) | Participating securities are restricted stock awards whereby the stock certificates have been issued, are included in outstanding shares, receive dividends and can be voted, but have not vested. |
NOTE 3: Fair value
Generally accepted accounting principles establish a fair value hierarchy which requires an entity to maximize the use of observable inputs and minimize the use of unobservable inputs when measuring fair value. The standard describes three levels of inputs that may be used to measure fair value:
Level 1: Quoted prices (unadjusted) for identical assets or liabilities in active markets that the entity has the ability to access as of the measurement date.
Level 2: Significant other observable inputs other than Level 1 prices such as quoted prices for similar assets or liabilities; quoted prices in markets that are not active; or other inputs that are observable or can be corroborated by observable market data.
Level 3: Significant unobservable inputs that reflect a reporting entity’s own assumptions about the assumptions that market participants would use in pricing an asset or liability.
The fair values of available for sale debt securities are determined by obtaining quoted prices on nationally recognized securities exchanges (Level 1 inputs) or matrix pricing, which is a mathematical technique widely used in the industry to value debt securities without relying exclusively on quoted prices for the specific securities but rather by relying on the securities’ relationship to other benchmark quoted securities (Level 2 inputs). The fair values of corporate debt securities are calculated using market indicators such as broker quotes (Level 2).
The fair values of trading securities are determined as follows: (1) for those securities that have traded prior to the date of the consolidated balance sheet but have not settled (date of sale) until after such date, the sales price is used as the fair value; and, (2) for those securities which have not traded as of the date of the consolidated balance sheet, the fair value was determined by broker price indications of similar or same securities.
The Company accounts for mortgage loans held for sale under the fair value option with changes in fair value recognized in current period earnings. These loans are intended for sale and the Company believes that the fair value is the best indicator of the resolution of these loans (Level 2). In conjunction with the fair value election on loans held for sale, Mortgage banking uses derivative forward sales contracts and interest rate lock commitments on residential mortgage loans. Fair values of these mortgage derivatives are estimated based on changes in market prices for mortgage forward trades and mortgage interest rates (Level 2) and estimated pull through percentages from the date the interest on the loan is locked (Level 3).
The Company has the rights to service a portfolio of Fannie Mae and other government guaranteed loans sold on a servicing retained basis. Mortgage servicing assets are measured at fair value when the loan is sold and subsequently measured at fair value on a recurring basis utilizing Level 2 inputs. Management uses a model operated and maintained by a third party to calculate the present
11
CenterState Bank Corporation and Subsidiaries
NOTES TO CONDENSED CONSOLIDATED FINANCIAL STATEMENTS (unaudited)
(in thousands of dollars, except per share data)
value of future cash flows using the third party's market-based assumptions. The future cash flows for each asset are based on the asset's unique characteristics and the third party's market-based assumptions for prepayment speeds, default and voluntary prepayments. Adjustments to fair value are recorded as a component of Mortgage Banking Revenue in the Consolidated Statements of Income and Comprehensive Income.
The fair value of interest rate swap derivatives is based on valuation models using observable market data as of the measurement date (Level 2). The derivatives are traded in an over-the-counter market where quoted market prices are not always available. Therefore, fair values of derivatives are determined using quantitative models that utilize multiple market inputs. The inputs will vary based on the type of derivative, but could include interest rates, prices and indices to generate continuous yield or pricing curves, prepayment rates, and volatility factors to value the position. The majority of market inputs are actively quoted and can be validated through external sources, including brokers, market transactions and third-party pricing services.
The fair value of impaired loans with specific valuation allowance for loan losses and other real estate owned is based on recent real estate appraisals. For residential real estate impaired loans and other real estate owned, appraised values are based on the comparative sales approach. For commercial and commercial real estate impaired loans, and other real estate owned, appraisers may use either a single valuation approach or a combination of approaches such as comparative sales, cost or the income approach. A significant unobservable input in the income approach is the estimated income capitalization rate for a given piece of collateral. At June 30, 2019, the range of capitalization rates utilized to determine the fair value of the underlying collateral ranged from 5% to 12%. Adjustments to appraisals may be made by the appraiser to reflect local market conditions or other economic factors and may result in changes in the fair value of a given asset over time. As such, the fair value of impaired loans, other real estate owned and bank property held for sale are considered a Level 3 in the fair value hierarchy.
12
CenterState Bank Corporation and Subsidiaries
NOTES TO CONDENSED CONSOLIDATED FINANCIAL STATEMENTS (unaudited)
(in thousands of dollars, except per share data)
Assets and liabilities measured at fair value on a recurring basis are summarized below.
| | | | Fair value measurements using |
| | | | Quoted prices | | Significant | | |
| | | | in active | | other | | Significant |
| | | | markets for | | observable | | unobservable |
| | Carrying | | identical assets | | inputs | | inputs |
| | value | | (Level 1) | | (Level 2) | | (Level 3) |
at June 30,2019 | | | | | | | | |
Assets: | | | | | | | | |
Trading securities | | $651 | | — | | $651 | | — |
Available for sale debt securities | | | | | | | | |
Corporate debt securities | | 5,654 | | — | | 5,654 | | — |
Obligations of U.S. government sponsored entities and agencies | | 37,177 | | — | | 37,177 | | — |
Mortgage-backed securities | | 1,657,646 | | — | | 1,657,646 | | — |
Municipal securities | | 92,280 | | — | | 92,280 | | — |
Loans held for sale, at fair value | | 95,108 | | — | | 95,108 | | — |
Mortgage servicing assets | | 1,475 | | — | | 1,475 | | — |
Mortgage banking derivatives | | 2,198 | | — | | 19 | | 2,179 |
Interest rate swap derivatives | | 229,735 | | — | | 229,735 | | — |
| | | | | | | | |
Liabilities: | | | | | | | | |
Mortgage banking derivatives | | 566 | | — | | 547 | | 19 |
Interest rate swap derivatives | | 231,735 | | — | | 231,735 | | — |
| | | | | | | | |
at December 31,2018 | | | | | | | | |
Assets: | | | | | | | | |
Trading securities | | $1,737 | | — | | $1,737 | | — |
Available for sale debt securities | | | | | | | | |
Corporate debt securities | | 6,427 | | — | | 6,427 | | — |
Obligations of U.S. government sponsored entities and agencies | | 37,868 | | — | | 37,868 | | — |
Mortgage-backed securities | | 1,594,275 | | — | | 1,594,275 | | — |
Municipal securities | | 88,778 | | — | | 88,778 | | — |
Loans held for sale, at fair value | | 40,399 | | — | | 40,399 | | — |
Mortgage servicing assets | | 1,565 | | — | | 1,565 | | — |
Mortgage banking derivatives | | 783 | | — | | — | | 783 |
Interest rate swap derivatives | | 92,475 | | — | | 92,475 | | — |
| | | | | | | | |
Liabilities: | | | | | | | | |
Mortgage banking derivatives | | 169 | | — | | 164 | | 5 |
Interest rate swap derivatives | | 92,892 | | — | | 92,892 | | — |
13
CenterState Bank Corporation and Subsidiaries
NOTES TO CONDENSED CONSOLIDATED FINANCIAL STATEMENTS (unaudited)
(in thousands of dollars, except per share data)
Assets and liabilities measured at fair value on a non-recurring basis are summarized below.
| | | | Fair value measurements using |
| | | | Quoted prices | | Significant | | |
| | | | in active | | other | | Significant |
| | | | markets for | | observable | | unobservable |
| | Carrying | | identical assets | | inputs | | inputs |
| | value | | (Level 1) | | (Level 2) | | (Level 3) |
at June 30,2019 | | | | | | | | |
Assets: | | | | | | | | |
Impaired loans | | | | | | | | |
Residential real estate | | $1,604 | | — | | — | | $1,604 |
Commercial real estate | | 6,259 | | — | | — | | 6,259 |
Land, land development and construction | | 49 | | — | | — | | 49 |
Commercial | | 2,042 | | — | | — | | 2,042 |
Consumer | | 30 | | — | | — | | 30 |
Other real estate owned | | | | | | | | |
Residential real estate | | — | | — | | — | | — |
Commercial real estate | | — | | — | | — | | — |
Land, land development and construction | | 367 | | — | | — | | 367 |
Bank property held for sale | | 3,960 | | — | | — | | 3,960 |
| | | | | | | | |
at December 31,2018 | | | | | | | | |
Assets: | | | | | | | | |
Impaired loans | | | | | | | | |
Residential real estate | | $1,811 | | — | | — | | $1,811 |
Commercial real estate | | 5,614 | | — | | — | | 5,614 |
Land, land development and construction | | 90 | | — | | — | | 90 |
Commercial | | 1,274 | | — | | — | | 1,274 |
Consumer | | 40 | | — | | — | | 40 |
Other real estate owned | | | | | | | | |
Residential real estate | | — | | — | | — | | — |
Commercial real estate | | — | | — | | — | | — |
Land, land development and construction | | 867 | | — | | — | | 867 |
Bank property held for sale | | 5,805 | | — | | — | | 5,805 |
Impaired loans measured at fair value had a recorded investment of $11,724, with a valuation allowance of $1,740 at June 30, 2019, and a recorded investment of $8,829, with a valuation allowance of $1,463 at December 31, 2018. The Company recorded a provision for loan loss expense of $492, $275, $1,056 and $353 on impaired loans carried at fair value during the three and six-month periods ending June 30, 2019 and 2018, respectively.
Other real estate owned had a decline in fair value of $57, $107, $165 and $294 during the three and six-month periods ending June 30, 2019 and 2018, respectively. Changes in fair value were recorded directly to current earnings through non-interest expense.
Bank property held for sale represents certain branch office buildings which the Company has closed and consolidated with other existing branches. The real estate was transferred out of the Bank Premises and Equipment category into Bank Property Held for Sale at the lower of amortized cost or fair value less estimated costs to sell. The fair values were based upon appraisals. The Company recognized an impairment charge of $315, $891, $422 and $2,340 during the three and six-month periods ending June 30, 2019 and 2018, respectively, related to bank properties held for sale.
Fair Value of Financial Instruments:
The methods and assumptions, not previously presented, used to estimate fair value are described as follows:
Cash and Cash Equivalents: The carrying amounts of cash and cash equivalents approximate fair values and are classified as Level 1.
FHLB, FRB and Other Stock: It is not practical to determine the fair value of FHLB, FRB and other stock due to restrictions placed on their transferability.
Investment securities held to maturity: The fair values of securities held to maturity are determined by obtaining quoted prices on nationally recognized securities exchanges (Level 1 inputs) or matrix pricing, which is a mathematical technique widely used in the
14
CenterState Bank Corporation and Subsidiaries
NOTES TO CONDENSED CONSOLIDATED FINANCIAL STATEMENTS (unaudited)
(in thousands of dollars, except per share data)
industry to value debt securities without relying exclusively on quoted prices for the specific securities but rather by relying on the securities’ relationship to other benchmark quoted securities (Level 2 inputs).
Loans, net: For performing loans, the fair value is determined based on a discounted cash flow analysis (income approach). The discounted cash flow was based on contractual maturity of the loan and market indications of rates, prepayment speeds, defaults and credit risk resulting in Level 3 classification. For non-performing loans, the fair value is determined based on the estimated values of the underlying collateral or individual analysis of receipts (asset approach) resulting in Level 3 classification.
Accrued Interest Receivable: The carrying amount of accrued interest receivable approximates fair value and is classified as Level 2 for accrued interest receivable related to investment securities and Level 3 for accrued interest receivable related to loans.
Deposits: The fair values disclosed for demand deposits (e.g., interest and non-interest checking, savings, and money market accounts) are, by definition, equal to the amount payable on demand at the reporting date (i.e., their carrying amount) resulting in Level 1 classification. Fair values for fixed rate certificates of deposit are estimated using a discounted cash flows calculation that applies interest rates currently being offered on certificates to a schedule of aggregated expected monthly maturities on time deposits resulting in a Level 2 classification.
Short-term Borrowings: The carrying amounts of federal funds purchased, borrowings under repurchase agreements, and other short-term borrowings, generally maturing within ninety days, approximate their fair values resulting in a Level 2 classification.
Corporate Debentures: The fair values of the Company’s corporate debentures are estimated using discounted cash flow analyses based on the current borrowing rates for similar types of borrowing arrangements resulting in a Level 3 classification.
Accrued Interest Payable: The carrying amount of accrued interest payable approximates fair value resulting in a Level 2 classification.
Off-balance Sheet Instruments: The fair value of off-balance-sheet items is not considered material.
The following table presents the carry amounts and estimated fair values of the Company’s financial instruments:
| | | | Fair value measurements | | |
| | Carrying amount | | Level 1 | | Level 2 | | Level 3 | | Total |
at June 30,2019 | | | | | | | | | | |
Financial assets: | | | | | | | | | | |
Cash and cash equivalents | | $837,338 | | $837,338 | | $ — | | $ — | | $837,338 |
Trading securities | | 651 | | — | | 651 | | — | | 651 |
Available for sale debt securities | | 1,792,757 | | — | | 1,792,757 | | — | | 1,792,757 |
Held to maturity debt securities | | 210,756 | | — | | 214,631 | | — | | 214,631 |
Loans held for sale, at fair value | | 95,108 | | — | | 95,108 | | — | | 95,108 |
Loans, net | | 11,672,108 | | — | | — | | 11,653,849 | | 11,653,849 |
Mortgage servicing assets | | 1,475 | | — | | 1,475 | | — | | 1,475 |
Mortgage banking derivatives | | 2,198 | | — | | 19 | | 2,179 | | 2,198 |
Interest rate swap derivatives | | 229,735 | | — | | 229,735 | | — | | 229,735 |
Accrued interest receivable | | 43,856 | | — | | 8,733 | | 35,123 | | 43,856 |
| | | | | | | | | | |
Financial liabilities: | | | | | | | | | | |
Deposits - without stated maturities | | $10,778,902 | | $10,778,902 | | $ — | | $ — | | $10,778,902 |
Deposits - with stated maturities | | 2,433,183 | | — | | 2,445,556 | | — | | 2,445,556 |
Securities sold under agreement to repurchase | | 78,277 | | — | | 78,277 | | — | | 78,277 |
Federal funds purchased and other borrowings | | 476,690 | | — | | 476,690 | | — | | 476,690 |
Corporate debentures | | 32,591 | | — | | — | | 28,463 | | 28,463 |
Mortgage banking derivatives | | 566 | | — | | 547 | | 19 | | 566 |
Interest rate swap derivatives | | 231,735 | | — | | 231,735 | | — | | 231,735 |
Accrued interest payable | | 4,661 | | — | | 4,661 | | — | | 4,661 |
15
CenterState Bank Corporation and Subsidiaries
NOTES TO CONDENSED CONSOLIDATED FINANCIAL STATEMENTS (unaudited)
(in thousands of dollars, except per share data)
| | | | Fair value measurements | | |
| | Carrying amount | | Level 1 | | Level 2 | | Level 3 | | Total |
at December 31,2018 | | | | | | | | | | |
Financial assets: | | | | | | | | | | |
Cash and cash equivalents | | $367,333 | | $367,333 | | $ — | | $ — | | $367,333 |
Trading securities | | 1,737 | | — | | 1,737 | | — | | 1,737 |
Available for sale debt securities | | 1,727,348 | | — | | 1,727,348 | | — | | 1,727,348 |
Held to maturity debt securities | | 216,833 | | — | | 212,179 | | — | | 212,179 |
Loans held for sale, at fair value | | 40,399 | | — | | 40,399 | | — | | 40,399 |
Loans, net | | 8,300,734 | | — | | — | | 8,342,220 | | 8,342,220 |
Mortgage servicing assets | | 1,565 | | — | | 1,565 | | — | | 1,565 |
Mortgage banking derivatives | | 783 | | — | | — | | 783 | | 783 |
Interest rate swap derivatives | | 92,475 | | — | | 92,475 | | — | | 92,475 |
Accrued interest receivable | | 33,143 | | — | | 8,355 | | 24,788 | | 33,143 |
| | | | | | | | | | |
Financial liabilities: | | | | | | | | | | |
Deposits - without stated maturities | | $7,655,376 | | $7,655,376 | | $ — | | $ — | | $7,655,376 |
Deposits - with stated maturities | | 1,821,960 | | — | | 1,827,299 | | — | | 1,827,299 |
Securities sold under agreement to repurchase | | 57,772 | | — | | 57,772 | | — | | 57,772 |
Federal funds purchased and other borrowings | | 655,360 | | — | | 655,360 | | — | | 655,360 |
Corporate debentures | | 32,415 | | — | | — | | 28,621 | | 28,621 |
Mortgage banking derivatives | | 169 | | — | | 164 | | 5 | | 169 |
Interest rate swap derivatives | | 92,892 | | — | | 92,892 | | — | | 92,892 |
Accrued interest payable | | 2,627 | | — | | 2,627 | | — | | 2,627 |
NOTE 4: Reportable segments
The Company’s reportable segments represent the distinct product lines the Company offers and are viewed separately for strategic planning purposes by management. The table below is a reconciliation of the reportable segment revenues, expenses, and profit to the Company’s consolidated total for the three and six-month periods ending June 30, 2019 and 2018.
| Three-month period ending June 30, 2019 |
| | | | Correspondent | | Corporate | | | | |
| | Commercial | | banking and | | overhead | | | | |
| | and retail | | capital markets | | and | | Elimination | | |
| | banking | | division | | administration | | entries | | Total |
Interest income | | $180,672 | | $4,581 | | $ — | | $ — | | $185,253 |
Interest expense | | (22,666) | | (2,697) | | (1,209) | | — | | (26,572) |
Net interest income (expense) | | 158,006 | | 1,884 | | (1,209) | | — | | 158,681 |
Provision for loan losses | | (2,762) | | (30) | | — | | — | | (2,792) |
Non-interest income | | 26,409 | | 11,534 | | — | | — | | 37,943 |
Non-interest expense | | (114,106) | | (6,683) | | (1,200) | | — | | (121,989) |
Net income (loss) before taxes | | 67,547 | | 6,705 | | (2,409) | | — | | 71,843 |
Income tax (provision) benefit | | (15,741) | | (1,699) | | 719 | | — | | (16,721) |
Net income (loss) | | 51,806 | | 5,006 | | (1,690) | | — | | 55,122 |
Earnings attributable to noncontrolling interest | | (599) | | — | | — | | — | | (599) |
Net income (loss) attributable to CenterState Bank Corporation | | $51,207 | | $5,006 | | $(1,690) | | $ — | | $54,523 |
Total assets | | $16,464,806 | | $566,514 | | $2,975,710 | | $(2,970,433) | | $17,036,597 |
16
CenterState Bank Corporation and Subsidiaries
NOTES TO CONDENSED CONSOLIDATED FINANCIAL STATEMENTS (unaudited)
(in thousands of dollars, except per share data)
| | Six-month period ending June 30, 2019 |
| | | | Correspondent | | Corporate | | | | |
| | Commercial | | banking and | | overhead | | | | |
| | and retail | | capital markets | | and | | Elimination | | |
| | banking | | division | | administration | | entries | | Total |
Interest income | | $308,504 | | $9,031 | | $ — | | $ — | | $317,535 |
Interest expense | | (37,517) | | (5,246) | | (1,916) | | — | | (44,679) |
Net interest income (expense) | | 270,987 | | 3,785 | | (1,916) | | — | | 272,856 |
Provision for loan losses | | (3,777) | | (68) | | — | | — | | (3,845) |
Non-interest income | | 46,709 | | 20,534 | | — | | — | | 67,243 |
Non-interest expense | | (191,687) | | (12,396) | | (2,379) | | — | | (206,462) |
Net income (loss) before taxes | | 122,232 | | 11,855 | | (4,295) | | — | | 129,792 |
Income tax (provision) benefit | | (28,431) | | (3,004) | | 1,408 | | — | | (30,027) |
Net income (loss) | | 93,801 | | 8,851 | | (2,887) | | — | | 99,765 |
Earnings attributable to noncontrolling interest | | (599) | | — | | — | | — | | (599) |
Net income (loss) attributable to CenterState Bank Corporation | | $93,202 | | $8,851 | | $(2,887) | | $ — | | $99,166 |
Total assets | | $16,464,806 | | $566,514 | | $2,975,710 | | $(2,970,433) | | $17,036,597 |
| | Three-month period ending June 30, 2018 |
| | | | Correspondent | | Corporate | | | | |
| | Commercial | | banking and | | overhead | | | | |
| | and retail | | capital markets | | and | | Elimination | | |
| | banking | | division | | administration | | entries | | Total |
Interest income | | $107,172 | | $3,457 | | $ — | | $ — | | $110,629 |
Interest expense | | (7,490) | | (1,657) | | (953) | | — | | (10,100) |
Net interest income (expense) | | 99,682 | | 1,800 | | (953) | | — | | 100,529 |
Provision for loan losses | | (2,912) | | (21) | | — | | — | | (2,933) |
Non-interest income | | 15,505 | | 7,076 | | 8 | | — | | 22,589 |
Non-interest expense | | (73,285) | | (4,884) | | (1,443) | | — | | (79,612) |
Net income (loss) before taxes | | 38,990 | | 3,971 | | (2,388) | | — | | 40,573 |
Income tax (provision) benefit | | (9,267) | | (1,006) | | 1,863 | | — | | (8,410) |
Net income (loss) attributable to CenterState Bank Corporation | | $29,723 | | $2,965 | | $(525) | | $ — | | $32,163 |
Total assets | | $9,963,206 | | $564,133 | | $1,607,900 | | $(1,598,516) | | $10,536,723 |
| | Six-month period ending June 30, 2018 |
| | | | Correspondent | | Corporate | | | | |
| | Commercial | | banking and | | overhead | | | | |
| | and retail | | capital markets | | and | | Elimination | | |
| | banking | | division | | administration | | entries | | Total |
Interest income | | $207,087 | | $6,701 | | $ — | | $ — | | $213,788 |
Interest expense | | (13,697) | | (2,729) | | (1,815) | | — | | (18,241) |
Net interest income (expense) | | 193,390 | | 3,972 | | (1,815) | | — | | 195,547 |
Provision for loan losses | | (4,074) | | (159) | | — | | — | | (4,233) |
Non-interest income | | 30,420 | | 15,199 | | 8 | | — | | 45,627 |
Non-interest expense | | (143,282) | | (10,494) | | (1,832) | | — | | (155,608) |
Net income (loss) before taxes | | 76,454 | | 8,518 | | (3,639) | | — | | 81,333 |
Income tax (provision) benefit | | (17,499) | | (2,158) | | 6,123 | | — | | (13,534) |
Net income attributable to CenterState Bank Corporation | | $58,955 | | $6,360 | | $2,484 | | $ — | | $67,799 |
Total assets | | $9,963,206 | | $564,133 | | $1,607,900 | | $(1,598,516) | | $10,536,723 |
Commercial and retail banking: The Company’s primary business is commercial and retail banking. Currently, the Company operates primarily through the Bank providing traditional retail, commercial, mortgage, wealth management and SBA services throughout its Florida, Georgia and Alabama branch network and customer relationships in neighboring states.
Correspondent banking and capital markets division: Operating as a division of our subsidiary bank, its primary revenue generating activities are related to the capital markets division which includes commissions earned on fixed income security sales, fees from hedging services, loan brokerage fees and consulting fees for services related to these activities. Income generated related to the
17
CenterState Bank Corporation and Subsidiaries
NOTES TO CONDENSED CONSOLIDATED FINANCIAL STATEMENTS (unaudited)
(in thousands of dollars, except per share data)
correspondent banking services includes spread income earned on correspondent bank deposits (i.e. federal funds purchased) and fees generated from safe-keeping activities, bond accounting services, asset/liability consulting services, international wires, clearing and corporate checking account services and other correspondent banking related services. The fees derived from the correspondent banking services are less volatile than those generated through the capital markets group. The customer base includes small to medium size financial institutions primarily located in Southeastern United States.
Corporate overhead and administration: Corporate overhead and administration is comprised primarily of compensation and benefits for certain members of management, interest on parent company debt, office occupancy and depreciation of parent company facilities, merger related costs and other expenses.
NOTE 5: Investment securities
Available for Sale Debt Securities
All of the mortgage-backed securities (“MBS”) listed below are residential Fannie Mae, Freddie Mac and Ginnie Mae MBSs. The fair value of available for sale debt securities and the related gross unrealized gains and losses recognized in accumulated other comprehensive income (loss) were as follows:
| | June 30, 2019 |
| | | | Gross | | Gross | | |
| | Amortized | | Unrealized | | Unrealized | | Fair |
| | Cost | | Gains | | Losses | | Value |
Corporate debt securities | | $5,505 | | $149 | | $ — | | $5,654 |
Obligations of U.S. government sponsored entities and agencies | | 37,445 | | 15 | | 283 | | 37,177 |
Mortgage-backed securities | | 1,643,074 | | 19,301 | | 4,729 | | 1,657,646 |
Municipal securities | | 87,738 | | 4,542 | | — | | 92,280 |
Total available for sale debt securities | | $1,773,762 | | $24,007 | | $5,012 | | $1,792,757 |
| | December 31, 2018 |
| | | | Gross | | Gross | | |
| | Amortized | | Unrealized | | Unrealized | | Fair |
| | Cost | | Gains | | Losses | | Value |
Corporate debt securities | | $6,265 | | $162 | | $ — | | $6,427 |
Obligations of U.S. government sponsored entities and agencies | | 38,794 | | 7 | | 933 | | 37,868 |
Mortgage-backed securities | | 1,623,906 | | 3,792 | | 33,423 | | 1,594,275 |
Municipal securities | | 88,415 | | 698 | | 335 | | 88,778 |
Total available for sale debt securities | | $1,757,380 | | $4,659 | | $34,691 | | $1,727,348 |
The cost of securities sold is determined using the specific identification method. All of the securities sold during the second quarter of 2019 were collateralized loan obligation securities (“CLOs”) acquired through the NCOM acquisition. The CLOs were marked to fair value at acquisition and subsequently sold resulting in a loss of $5.The securities sold during the first quarter of 2018 include some securities acquired through the acquisitions of Sunshine Bancorp, Inc. (“Sunshine”) and HCBF Holding Company, Inc. (“Harbor”) on January 1, 2018. These acquired securities were marked to fair value and subsequently sold after the acquisition date, and no gain or loss was recognized from the sale of these securities. Sales of available for sale debt securities for the six-month ended June 30, 2019 and 2018 were as follows:
For the six months ended: | | June 30, 2019 | | June 30, 2018 |
Proceeds | | $108,477 | | $364,152 |
Gross gains | | 646 | | 68 |
Gross losses | | 634 | | 90 |
The tax provision related to these net realized gain and loss were $3 and ($6), respectively.
18
CenterState Bank Corporation and Subsidiaries
NOTES TO CONDENSED CONSOLIDATED FINANCIAL STATEMENTS (unaudited)
(in thousands of dollars, except per share data)
The fair value of available for sale debt securities at June 30, 2019 by contractual maturity were as follows. Securities not due at a single maturity date, primarily mortgage-backed securities, are shown separately.
| | Fair | | Amortized |
Investment securities available for sale: | | Value | | Cost |
Due one year or less | | $525 | | $525 |
Due after one year through five years | | 9,001 | | 8,872 |
Due after five years through ten years | | 28,026 | | 27,459 |
Due after ten years through thirty years | | 97,559 | | 93,832 |
Mortgage-backed securities | | 1,657,646 | | 1,643,074 |
Total available for sale debt securities | | $1,792,757 | | $1,773,762 |
Available for sale debt securities pledged at June 30, 2019 and December 31, 2018 had a carrying amount (estimated fair value) of $909,669 and $961,721 respectively. These securities were pledged primarily to increase borrowing capacity at the FHLB, secure public deposits and repurchase agreements.
At June 30, 2019 and December 31, 2018, there were no holdings of securities of any one issuer, other than mortgage-backed securities issued by U.S. Government sponsored entities, in an amount greater than 10% of stockholders’ equity.
The following tables show the Company’s available for sale debt investments’ gross unrealized losses and fair value, aggregated by investment category and length of time that individual securities have been in a continuous unrealized loss position, at June 30, 2019 and December 31, 2018.
| | June 30, 2019 |
| | Less than 12 months | | 12 months or more | | Total |
| | Fair | | Unrealized | | Fair | | Unrealized | | Fair | | Unrealized |
| | Value | | Losses | | Value | | Losses | | Value | | Losses |
Obligations of U.S. government sponsored entities and agencies | | $2,731 | | $10 | | $20,219 | | $273 | | $22,950 | | $283 |
Mortgage-backed securities | | — | | — | | 512,428 | | 4,729 | | 512,428 | | 4,729 |
Total temporarily impaired available for sale debt securities | | $2,731 | | $10 | | $532,647 | | $5,002 | | $535,378 | | $5,012 |
| | December 31, 2018 |
| | Less than 12 months | | 12 months or more | | Total |
| | Fair | | Unrealized | | Fair | | Unrealized | | Fair | | Unrealized |
| | Value | | Losses | | Value | | Losses | | Value | | Losses |
Obligations of U.S. government sponsored entities and agencies | | $25,104 | | $332 | | $9,398 | | $601 | | $34,502 | | $933 |
Mortgage-backed securities | | 647,923 | | 10,782 | | 635,172 | | 22,641 | | 1,283,095 | | 33,423 |
Total temporarily impaired available for sale debt securities | | $673,027 | | $11,114 | | $644,570 | | $23,242 | | $1,317,597 | | $34,356 |
Obligations of U.S. government sponsored entities and agencies: Obligations of U.S. government-sponsored entities and agencies are mainly comprised of pools of securities issued by the Small Business Administration (“SBA”). Because the decline in fair value is attributable to changes in interest rates and illiquidity, and not credit quality, and because the Company does not have the intent to sell these securities and it is likely that it will not be required to sell the securities before their anticipated recovery, the Company does not consider these securities to be other-than-temporarily impaired at June 30, 2019.
Mortgage-backed securities: At June 30, 2019, 100% of the mortgage-backed securities held by the Company were issued by U.S. government-sponsored entities and agencies, primarily Fannie Mae, Freddie Mac, and Ginnie Mae, institutions which the government has affirmed its commitment to support. Because the decline in fair value is attributable to changes in interest rates and illiquidity, and not credit quality, and because the Company does not have the intent to sell these mortgage-backed securities and it is likely that it will not be required to sell the securities before their anticipated recovery, the Company does not consider these securities to be other-than-temporarily impaired at June 30, 2019.
19
CenterState Bank Corporation and Subsidiaries
NOTES TO CONDENSED CONSOLIDATED FINANCIAL STATEMENTS (unaudited)
(in thousands of dollars, except per share data)
Held to Maturity Debt Securities
The following reflects the fair value of held-to-maturity securities and the related gross unrecognized gains and losses as of June 30, 2019 and December 31, 2018.
| | June 30, 2019 |
| | | | Gross | | Gross | | |
| | Amortized | | Unrecognized | | Unrecognized | | Fair |
| | Cost | | Gains | | Losses | | Value |
Mortgage-backed securities | | $79,160 | | $16 | | $483 | | $78,693 |
Municipal securities | | 131,596 | | 4,352 | | 10 | | 135,938 |
Total held to maturity debt securities | | $210,756 | | $4,368 | | $493 | | $214,631 |
| | December 31, 2018 |
| | | | Gross | | Gross | | |
| | Amortized | | Unrecognized | | Unrecognized | | Fair |
| | Cost | | Gains | | Losses | | Value |
Mortgage-backed securities | | $84,983 | | $ — | | $2,462 | | $82,521 |
Municipal securities | | 131,850 | | 799 | | 2,991 | | 129,658 |
Total held to maturity debt securities | | $216,833 | | $799 | | $5,453 | | $212,179 |
Held to maturity securities pledged at June 30, 2019 and December 31, 2018 had a carrying amount of $102,338 and $103,710 respectively. These securities were pledged primarily to secure public deposits and repurchase agreements.
At June 30, 2019, there were no holdings of held to maturity securities of any one issuer, other than the U.S. Government and its agencies, in an amount greater than 10% of stockholders’ equity.
The fair value and amortized cost of held to maturity securities at June 30, 2019 by contractual maturity were as follows. Mortgage-backed securities are not due at a single maturity date and are shown separately.
| | Fair | | Amortized |
Held to maturity debt securities | | Value | | Cost |
Due after five years through ten years | | $2,072 | | $2,038 |
Due after ten years through thirty years | | 133,866 | | 129,558 |
Mortgage-backed securities | | 78,693 | | 79,160 |
Total held to maturity debt securities | | $214,631 | | $210,756 |
20
CenterState Bank Corporation and Subsidiaries
NOTES TO CONDENSED CONSOLIDATED FINANCIAL STATEMENTS (unaudited)
(in thousands of dollars, except per share data)
The following table shows the Company’s held to maturity debt investments’ gross unrecognized losses and fair value, aggregated by investment category and length of time the individual securities have been in a continuous unrecognized loss position, at June 30, 2019 and December 31, 2018.
| | June 30, 2019 |
| | Less than 12 months | | 12 months or more | | Total |
| | Fair | | Unrecognized | | Fair | | Unrecognized | | Fair | | Unrecognized |
| | Value | | Losses | | Value | | Losses | | Value | | Losses |
Mortgage-backed securities | | $ — | | $ — | | $71,798 | | $483 | | $71,798 | | $483 |
Municipal securities | | — | | — | | 1,990 | | 10 | | 1,990 | | 10 |
Total temporarily impaired held to maturity debt securities | | $ — | | $ — | | $73,788 | | $493 | | $73,788 | | $493 |
| | December 31, 2018 |
| | Less than 12 months | | 12 months or more | | Total |
| | Fair | | Unrecognized | | Fair | | Unrecognized | | Fair | | Unrecognized |
| | Value | | Losses | | Value | | Losses | | Value | | Losses |
Mortgage-backed securities | | $ — | | $ — | | $82,521 | | $2,462 | | $82,521 | | $2,462 |
Municipal securities | | 22,560 | | 203 | | 47,807 | | 2,788 | | 70,367 | | 2,991 |
Total temporarily impaired held to maturity debt securities | | $22,560 | | $203 | | $130,328 | | $5,250 | | $152,888 | | $5,453 |
Mortgage-backed securities: At June 30, 2019, 100% of the mortgage-backed securities held by the Company were issued by U.S. government-sponsored entities and agencies, primarily Fannie Mae, Freddie Mac, and Ginnie Mae, institutions which the government has affirmed its commitment to support. Because the decline in fair value is attributable to changes in interest rates and illiquidity, and not credit quality, and because the Company does not have the intent to sell these mortgage-backed securities and it is likely that it will not be required to sell the securities before their anticipated recovery, the Company does not consider these securities to be other-than-temporarily impaired at June 30, 2019.
Municipal securities: Unrealized losses on municipal securities have not been recognized into income because the issuers bonds are of high quality, and because management does not intend to sell these investments or more likely than not will not be required to sell these investments before their anticipated recovery. The fair value is expected to recover as the securities approach maturity.
NOTE 6: Loans Held for Sale
The Company accounts for loans held for sale under the fair value option with changes in fair value recognized in current period earnings. At the date of funding of the loan, the funded amount of the loan, the relative derivative asset or liability of the associated interest rate lock commitment, less direct costs, becomes the initial recorded investment in the loan held for sale. Such amount approximates the fair value of the loan. Net gains from changes in estimated fair value of mortgage loans held for sale were $941 and $722 for the six-month periods ended June 30, 2019 and 2018, respectively. The total unpaid principal balance of loans held for sale was $94,167 and $39,318 at June 30, 2019 and December 31, 2018, respectively. No loans held for sale at June 30, 2019 or at December 31, 2018 were past due or on nonaccrual.
21
CenterState Bank Corporation and Subsidiaries
NOTES TO CONDENSED CONSOLIDATED FINANCIAL STATEMENTS (unaudited)
(in thousands of dollars, except per share data)
The table below summarizes the activity in mortgage loans held for sale during the three and six-month periods ending June 30, 2019 and 2018.
| | Three-month periods ended | | Six-month periods ended |
| | June 30, 2019 | | June 30, 2018 | | June 30, 2019 | | June 30, 2018 |
Beginning balance | | $49,474 | | $28,485 | | $40,399 | | $19,647 |
Effect from acquisitions | | 14,588 | | — | | 14,588 | | 6,124 |
Loans originated | | 257,383 | | 92,218 | | 392,135 | | 150,316 |
Proceeds from sales | | (233,962) | | (87,066) | | (363,619) | | (144,387) |
Net change in fair value | | 937 | | 359 | | 941 | | 722 |
Net realized gain on sales | | 6,688 | | 2,370 | | 10,664 | | 3,944 |
Ending balance | | $95,108 | | $36,366 | | $95,108 | | $36,366 |
As loans are closed, they are typically sold at prices specified in the forward contracts. Gains or losses may arise if the yields of the loans delivered vary from those specified in the forward contracts. Derivative mortgage loan commitments, or interest rate locks, are also utilized and relate to the origination of a mortgage that will be held for sale upon funding. The Company uses these derivative financial instruments on its loans held for sale to manage interest rate risk and not for speculative purposes. The table below summarizes the main components of Mortgage Banking Revenue during the three and six-month periods ending June 30, 2019 and 2018. The Mortgage Banking Revenue amounts are reported in the Company’s Consolidated Statements of Income and Comprehensive Income.
| | Three-month periods ended | | Six-month periods ended |
| | June 30, 2019 | | June 30, 2018 | | June 30, 2019 | | June 30, 2018 |
Servicing fees and commissions | | $96 | | $20 | | $188 | | $20 |
Gain on sale of loans held for sale | | 6,688 | | 2,370 | | 10,664 | | 3,944 |
Unrealized gain on loans held for sale | | 937 | | 359 | | 941 | | 722 |
Gain (loss) on mortgage derivatives | | 52 | | (107) | | 609 | | 558 |
Loss on mortgage hedge | | (703) | | (26) | | (1,106) | | (26) |
Loss on mortgage servicing assets | | (267) | | — | | (300) | | — |
Mortgage banking revenue | | $6,803 | | $2,616 | | $10,996 | | $5,218 |
The table below summarizes the notional amounts for interest rate lock commitments, best efforts forward trades and MBS forward trades pertaining to loans held for sale at June 30, 2019 and 2018.
| Notional at |
| June 30, 2019 | | June 30, 2018 |
Interest rate lock commitments | $160,461 | | $33,306 |
Best efforts forward trades | 129,738 | | 52,614 |
MBS forward trades | 110,500 | | 14,250 |
Total derivative instruments | $400,699 | | $100,170 |
Mortgage banking derivatives used in the ordinary course of business consist of forward sales contracts and interest rate lock commitments on residential mortgage loans. Forward sales contracts represent future commitments to deliver loans at a specified price and by a specified date and are used to manage interest rate risk on loan commitments and mortgage loans held for sale. Rate lock commitments represent commitments to fund loans at a specific rate and by a specified expiration date. These derivatives involve underlying items, such as interest rates, and are designed to mitigate risk. Notional amounts are amounts on which calculations and payments are based, but which do not represent credit exposure, as credit exposure is limited to the amounts required to be received or paid.
22
CenterState Bank Corporation and Subsidiaries
NOTES TO CONDENSED CONSOLIDATED FINANCIAL STATEMENTS (unaudited)
(in thousands of dollars, except per share data)
NOTE 7: Loans
The following table sets forth information concerning the loan portfolio by collateral types as of the dates indicated.
| | June 30, 2019 | | December 31, 2018 |
Loans excluding PCI loans | | | | |
Real estate loans | | | | |
Residential | | $2,481,717 | | $1,702,114 |
Commercial | | 6,062,203 | | 4,454,098 |
Land, development and construction | | 1,051,307 | | 635,562 |
Total real estate | | 9,595,227 | | 6,791,774 |
Commercial, industrial and factored receivables | | 1,709,019 | | 1,183,380 |
Consumer and other loans | | 246,856 | | 203,686 |
Loans before unearned fees and deferred cost | | 11,551,102 | | 8,178,840 |
Net unearned fees and costs | | 4,356 | | 2,693 |
Total loans excluding PCI loans | | 11,555,458 | | 8,181,533 |
PCI loans (note 1) | | | | |
Real estate loans | | | | |
Residential | | 54,607 | | 58,804 |
Commercial | | 91,176 | | 87,336 |
Land, development and construction | | 6,225 | | 7,028 |
Total real estate | | 152,008 | | 153,168 |
Commercial and industrial | | 5,102 | | 5,594 |
Consumer and other loans | | 193 | | 209 |
Total PCI loans | | 157,303 | | 158,971 |
Total loans | | 11,712,761 | | 8,340,504 |
Allowance for loan losses for loans that are not PCI loans | | (40,455) | | (39,579) |
Allowance for loan losses for PCI loans | | (198) | | (191) |
Total loans, net of allowance for loan losses | | $11,672,108 | | $8,300,734 |
| note 1: | Purchased credit impaired (“PCI”) loans are being accounted for pursuant to ASC Topic 310-30. | |
23
CenterState Bank Corporation and Subsidiaries
NOTES TO CONDENSED CONSOLIDATED FINANCIAL STATEMENTS (unaudited)
(in thousands of dollars, except per share data)
The table below set forth the activity in the allowance for loan losses for the periods presented.
| | Allowance for loan losses for loans that are not PCI loans | | Allowance for loan losses on PCI loans | | Total |
Three-month ended June 30, 2019 | | | | | | |
Balance at beginning of period | | $39,861 | | $191 | | $40,052 |
Loans charged-off | | (3,325) | | — | | (3,325) |
Recoveries of loans previously charged-off | | 1,134 | | — | | 1,134 |
Net charge-offs | | (2,191) | | — | | (2,191) |
Provision for loan losses | | 2,785 | | 7 | | 2,792 |
Balance at end of period | | $40,455 | | $198 | | $40,653 |
| | | | | | |
Three-month ended June 30, 2018 | | | | | | |
Balance at beginning of period | | $34,154 | | $275 | | $34,429 |
Loans charged-off | | (589) | | — | | (589) |
Recoveries of loans previously charged-off | | 711 | | — | | 711 |
Net recoveries | | 122 | | — | | 122 |
Provision for loan losses | | 2,933 | | — | | 2,933 |
Balance at end of period | | $37,209 | | $275 | | $37,484 |
| | | | | | |
| | | | | | |
| | Allowance for loan losses for loans that are not PCI loans | | Allowance for loan losses on PCI loans | | Total |
Six-month ended June 30, 2019 | | | | | | |
Balance at beginning of period | | $39,579 | | $191 | | $39,770 |
Loans charged-off | | (4,772) | | — | | (4,772) |
Recoveries of loans previously charged-off | | 1,810 | | — | | 1,810 |
Net charge-offs | | (2,962) | | — | | (2,962) |
Provision for loan losses | | 3,838 | | 7 | | 3,845 |
Balance at end of period | | $40,455 | | $198 | | $40,653 |
| | | | | | |
Six-month ended June 30, 2018 | | | | | | |
Balance at beginning of period | | $32,530 | | $295 | | $32,825 |
Loans charged-off | | (992) | | — | | (992) |
Recoveries of loans previously charged-off | | 1,343 | | 75 | | 1,418 |
Net recoveries | | 351 | | 75 | | 426 |
Provision for loan losses | | 4,328 | | (95) | | 4,233 |
Balance at end of period | | $37,209 | | $275 | | $37,484 |
24
CenterState Bank Corporation and Subsidiaries
NOTES TO CONDENSED CONSOLIDATED FINANCIAL STATEMENTS (unaudited)
(in thousands of dollars, except per share data)
The following tables present the activity in the allowance for loan losses by portfolio segment for the periods presented.
| Real Estate Loans | | | | | | |
| | Residential | | Commercial | | Land, develop., constr. | | Comm. & industrial | | Factored commercial receivables | | Consumer & other | | Total |
Allowance for loan losses for loans that are not PCI loans: | | | | | | |
Three-month ended June 30, 2019 | | | | | | | | | | | | | | |
Beginning of the period | | $5,448 | | $22,247 | | $2,220 | | $6,930 | | $ — | | $3,016 | | $39,861 |
Charge-offs | | (418) | | (4) | | — | | (1,257) | | (516) | | (1,130) | | (3,325) |
Recoveries | | 275 | | 66 | | 1 | | 92 | | 530 | | 170 | | 1,134 |
Provision for loan losses | | 424 | | (1,372) | | 269 | | 1,577 | | 586 | | 1,301 | | 2,785 |
Balance at end of period | | $5,729 | | $20,937 | | $2,490 | | $7,342 | | $600 | | $3,357 | | $40,455 |
| | | | | | | | | | | | | | |
Three-month ended June 30, 2018 | | | | | | | | | | | | | | |
Beginning of the period | | $5,747 | | $20,975 | | $1,294 | | $4,501 | | $ — | | $1,637 | | $34,154 |
Charge-offs | | — | | — | | — | | (221) | | — | | (368) | | (589) |
Recoveries | | 364 | | 169 | | 1 | | 56 | | — | | 121 | | 711 |
Provision for loan losses | | (264) | | 777 | | 334 | | 1,076 | | — | | 1,010 | | 2,933 |
Balance at end of period | | $5,847 | | $21,921 | | $1,629 | | $5,412 | | $ — | | $2,400 | | $37,209 |
| | | | | | | | | | | | | | |
| | | | | | | | | | | | | | |
| | Real Estate Loans | | | | | | |
| | Residential | | Commercial | | Land, develop., constr. | | Comm. & industrial | | Factored commercial receivables | | Consumer & other | | Total |
Allowance for loan losses for loans that are PCI loans: | | | | | | | | |
Three-month ended June 30, 2019 | | | | | | | | | | | | | | |
Beginning of the period | | $ — | | $ — | | $177 | | $ — | | $ — | | $14 | | $191 |
Charge-offs | | — | | — | | — | | — | | — | | — | | — |
Recoveries | | — | | — | | — | | — | | — | | — | | — |
Provision for loan losses | | 7 | | — | | — | | — | | — | | — | | 7 |
Balance at end of period | | $7 | | $ — | | $177 | | $ — | | $ — | | $14 | | $198 |
| | | | | | | | | | | | | | |
Three-month ended June 30, 2018 | | | | | | | | | | | | | | |
Beginning of the period | | $ — | | $59 | | $202 | | $ — | | $ — | | $14 | | $275 |
Charge-offs | | — | | — | | — | | — | | — | | — | | — |
Recoveries | | — | | — | | — | | — | | — | | — | | — |
Provision for loan losses | | — | | — | | — | | — | | — | | — | | — |
Balance at end of period | | $ — | | $59 | | $202 | | $ — | | $ — | | $14 | | $275 |
25
CenterState Bank Corporation and Subsidiaries
NOTES TO CONDENSED CONSOLIDATED FINANCIAL STATEMENTS (unaudited)
(in thousands of dollars, except per share data)
| | Real Estate Loans | | | | | | | | |
| | Residential | | Commercial | | Land, develop., constr. | | Comm. & industrial | | Factored commercial receivables | | Consumer & other | | Total |
Allowance for loan losses for loans that are not PCI loans: | | | | | | | | | | | | |
Six-month ended June 30, 2019 | | | | | | | | | | | | | | |
Beginning of the period | | $5,518 | | $22,978 | | $1,781 | | $6,414 | | $ — | | $2,888 | | $39,579 |
Charge-offs | | (619) | | (4) | | (31) | | (1,921) | | (516) | | (1,681) | | (4,772) |
Recoveries | | 417 | | 218 | | 84 | | 247 | | 530 | | 314 | | 1,810 |
Provision for loan losses | | 413 | | (2,255) | | 656 | | 2,602 | | 586 | | 1,836 | | 3,838 |
Balance at end of period | | $5,729 | | $20,937 | | $2,490 | | $7,342 | | $600 | | $3,357 | | $40,455 |
| | | | | | | | | | | | | | |
Six-month ended June 30, 2018 | | | | | | | | | | | | | | |
Beginning of the period | | $6,003 | | $19,304 | | $1,179 | | $4,130 | | $ — | | $1,914 | | $32,530 |
Charge-offs | | (136) | | — | | — | | (228) | | — | | (628) | | (992) |
Recoveries | | 638 | | 456 | | 1 | | 62 | | — | | 186 | | 1,343 |
Provision for loan losses | | (658) | | 2,161 | | 449 | | 1,448 | | — | | 928 | | 4,328 |
Balance at end of period | | $5,847 | | $21,921 | | $1,629 | | $5,412 | | $ — | | $2,400 | | $37,209 |
| | | | | | | | | | | | | | |
| | | | | | | | | | | | | | |
| | Real Estate Loans | | | | | | | | |
| | Residential | | Commercial | | Land, develop., constr. | | Comm. & industrial | | Factored commercial receivables | | Consumer & other | | Total |
Allowance for loan losses for loans that are PCI loans: | | | | | | | | | | | | |
Six-month ended June 30, 2019 | | | | | | | | | | | | | | |
Beginning of the period | | $ — | | $ — | | $177 | | $ — | | $ — | | $14 | | $191 |
Charge-offs | | — | | — | | — | | — | | — | | — | | — |
Recoveries | | — | | — | | — | | — | | — | | — | | — |
Provision for loan losses | | 7 | | — | | — | | — | | — | | — | | 7 |
Balance at end of period | | $7 | | $ — | | $177 | | $ — | | $ — | | $14 | | $198 |
| | | | | | | | | | | | | | |
Six-month ended June 30, 2018 | | | | | | | | | | | | | | |
Beginning of the period | | $ — | | $59 | | $222 | | $ — | | $ — | | $14 | | $295 |
Charge-offs | | — | | — | | — | | — | | — | | — | | — |
Recoveries | | — | | — | | — | | 75 | | — | | — | | 75 |
Provision for loan losses | | — | | — | | (20) | | (75) | | — | | — | | (95) |
Balance at end of period | | $ — | | $59 | | $202 | | $ — | | $ — | | $14 | | $275 |
26
CenterState Bank Corporation and Subsidiaries
NOTES TO CONDENSED CONSOLIDATED FINANCIAL STATEMENTS (unaudited)
(in thousands of dollars, except per share data)
The following tables present the balance in the allowance for loan losses and the recorded investment in loans by portfolio segment and based on impairment method as of June 30, 2019 and December 31, 2018. Accrued interest receivable and unearned loan fees and costs are not included in the recorded investment because they are not material.
| | Real Estate Loans | | | | | | |
| | Residential | | Commercial | | Land, develop., constr. | | Comm., industrial & factored receivables | | Consumer & other | | Total |
As of June 30, 2019 | | | | | | | | | | | | |
Allowance for loan losses: | | | | | | | | | | | | |
Ending allowance balance attributable to loans: | | | | | | | | | | |
Individually evaluated for impairment | | $292 | | $322 | | $ — | | $1,234 | | $ — | | $1,848 |
Collectively evaluated for impairment | | 5,437 | | 20,615 | | 2,490 | | 6,708 | | 3,357 | | 38,607 |
Purchased credit impaired | | 7 | | — | | 177 | | — | | 14 | | 198 |
Total ending allowance balance | | $5,736 | | $20,937 | | $2,667 | | $7,942 | | $3,371 | | $40,653 |
| | | | | | | | | | | | |
Loans: | | | | | | | | | | | | |
Individually evaluated for impairment | | $5,563 | | $7,478 | | $72 | | $3,957 | | $131 | | $17,201 |
Collectively evaluated for impairment | | 2,476,154 | | 6,054,725 | | 1,051,235 | | 1,705,062 | | 246,725 | | 11,533,901 |
Purchased credit impaired | | 54,607 | | 91,176 | | 6,225 | | 5,102 | | 193 | | 157,303 |
Total ending loan balances | | $2,536,324 | | $6,153,379 | | $1,057,532 | | $1,714,121 | | $247,049 | | $11,708,405 |
| | | | | | | | | | | | |
| | Real Estate Loans | | | | | | |
| | Residential | | Commercial | | Land, develop., constr. | | Comm. & industrial | | Consumer & other | | Total |
As of December 31, 2018 | | | | | | | | | | | | |
Allowance for loan losses: | | | | | | | | | | | | |
Ending allowance balance attributable to loans: | | | | | | | | | | | | |
Individually evaluated for impairment | | $331 | | $250 | | $ — | | $1,034 | | $1 | | $1,616 |
Collectively evaluated for impairment | | 5,187 | | 22,728 | | 1,781 | | 5,380 | | 2,887 | | 37,963 |
Purchased credit impaired | | — | | — | | 177 | | — | | 14 | | 191 |
Total ending allowance balance | | $5,518 | | $22,978 | | $1,958 | | $6,414 | | $2,902 | | $39,770 |
| | | | | | | | | | | | |
Loans: | | | | | | | | | | | | |
Individually evaluated for impairment | | $6,234 | | $7,496 | | $117 | | $1,708 | | $145 | | $15,700 |
Collectively evaluated for impairment | | 1,695,880 | | 4,446,602 | | 635,445 | | 1,181,672 | | 203,541 | | 8,163,140 |
Purchased credit impaired | | 58,804 | | 87,336 | | 7,028 | | 5,594 | | 209 | | 158,971 |
Total ending loan balances | | $1,760,918 | | $4,541,434 | | $642,590 | | $1,188,974 | | $203,895 | | $8,337,811 |
The table below summarizes impaired loan data for the periods presented.
| | June 30, 2019 | | December 31, 2018 |
Performing TDRs (these are not included in nonperforming loans ("NPLs")) | | $8,683 | | $8,475 |
Nonperforming TDRs (these are included in NPLs) | | 1,437 | | 1,002 |
Total TDRs (these are included in impaired loans) | | 10,120 | | 9,477 |
Impaired loans that are not TDRs | | 7,081 | | 6,223 |
Total impaired loans | | $17,201 | | $15,700 |
27
CenterState Bank Corporation and Subsidiaries
NOTES TO CONDENSED CONSOLIDATED FINANCIAL STATEMENTS (unaudited)
(in thousands of dollars, except per share data)
Troubled Debt Restructurings:
In certain situations, it is common to restructure or modify the terms of troubled loans (i.e. troubled debt restructure or “TDRs”). In those circumstances, it may be beneficial to restructure the terms of a loan and work with the borrower for the benefit of both parties, versus forcing the property into foreclosure and having to dispose of it in a distressed sale. When the terms of a loan have been modified, usually the monthly payment and/or interest rate is reduced for generally twelve to twenty-four months. The Company has not forgiven any material principal amounts on any loan modifications to date.
TDRs as of June 30, 2019 and December 31, 2018 quantified by loan type classified separately as accrual (performing loans) and non-accrual (non-performing loans) are presented in the tables below.
| | Accruing | | Non-Accrual | | Total |
As of June 30, 2019 | | | | | | |
Real estate loans: | | | | | | |
Residential | | $5,205 | | $479 | | $5,684 |
Commercial | | 2,076 | | 156 | | 2,232 |
Land, development, construction | | 72 | | — | | 72 |
Total real estate loans | | 7,353 | | 635 | | 7,988 |
Commercial and industrial | | 1,198 | | 802 | | 2,000 |
Consumer and other | | 132 | | — | | 132 |
Total TDRs | | $8,683 | | $1,437 | | $10,120 |
| | | | | | |
| | | | | | |
| | Accruing | | Non-Accrual | | Total |
As of December 31, 2018 | | | | | | |
Real estate loans: | | | | | | |
Residential | | $5,848 | | $386 | | $6,234 |
Commercial | | 1,837 | | 566 | | 2,403 |
Land, development, construction | | 77 | | 41 | | 118 |
Total real estate loans | | 7,762 | | 993 | | 8,755 |
Commercial and industrial | | 577 | | — | | 577 |
Consumer and other | | 136 | | 9 | | 145 |
Total TDRs | | $8,475 | | $1,002 | | $9,477 |
The Company’s policy is to return non-accrual TDR loans to accrual status when all the principal and interest amounts contractually due, pursuant to its modified terms, are brought current and future payments are reasonably assured. Our policy also considers the payment history of the borrower, but is not dependent upon a specific number of payments. The Company recorded a provision for loan loss expense of $126 and $157 and partial charge offs of $42 and $50 on the TDR loans described above during the three and six-month periods ending June 30, 2019, respectively. The Company recorded a provision for loan loss expense of $19 and $28 and partial charge-offs of $10 and $21 on TDR loans during the three and six-month periods ending June 30, 2018, respectively.
Loans are modified to minimize loan losses when we believe the modification will improve the borrower’s financial condition and ability to repay the loan. We typically do not forgive principal. We generally either reduce interest rates or decrease monthly payments for a temporary period of time and those reductions of cash flows are capitalized into the loan balance. We may also extend maturities, convert balloon loans to longer-term amortizing loans, or vice versa, or change interest rates between variable and fixed rate. Each borrower and situation is unique and we try to accommodate the borrower and minimize the Company’s potential losses. Approximately 86% of our TDRs are current pursuant to their modified terms, and $1,437, or approximately 14% of our total TDRs are not performing pursuant to their modified terms. There does not appear to be any significant difference in success rates with one type of concession versus another.
Loans modified as TDRs during the three and six-month periods ending June 30, 2019 were $1,142 and $1,820, respectively. Loans modified as TDRs during the three and six-month periods ending June 30, 2018 were $601 and $2,148, respectively. The Company recorded $100 and $119 loan loss provision for loans modified during the three and six-month periods ending June 30, 2019. The Company recorded $13 and $14 loan loss provision for loans modified during the three and six-month periods ending June 30, 2018.
28
CenterState Bank Corporation and Subsidiaries
NOTES TO CONDENSED CONSOLIDATED FINANCIAL STATEMENTS (unaudited)
(in thousands of dollars, except per share data)
The following table presents loans by class modified and for which there was a payment default within twelve months following the modification during the periods ending June 30, 2019 and 2018.
| | Period ending | | Period ending |
| | June 30, 2019 | | June 30, 2018 |
| | Number | | Recorded | | Number | | Recorded |
| | of loans | | investment | | of loans | | investment |
Residential | | — | | $ — | | 1 | | $51 |
Commercial real estate | | — | | — | | 1 | | 120 |
Land, development, construction | | — | | — | | — | | — |
Commercial and industrial | | 3 | | 801 | | — | | — |
Consumer and other | | — | | — | | — | | — |
Total | | 3 | | $801 | | 2 | | $171 |
The Company recorded $85 and $85 provision for loan loss expense for three and six-month periods ending June 30, 2019. The Company recorded no partial charge offs on TDR loans subsequently defaulted during the three and six-month periods ending June 30, 2019. The Company recorded a provision for loan loss expense of $3 and $5 and partial charge offs of $3 and $5 on TDR loans that subsequently defaulted as described above during the three and six-month periods ending June 30, 2018.
29
CenterState Bank Corporation and Subsidiaries
NOTES TO CONDENSED CONSOLIDATED FINANCIAL STATEMENTS (unaudited)
(in thousands of dollars, except per share data)
The following tables present loans individually evaluated for impairment by class of loans as of June 30, 2019 and December 31, 2018, excluding purchased credit impaired loans accounted for pursuant to ASC Topic 310-30. The recorded investment is less than the unpaid principal balance due to partial charge-offs.
| | Unpaid principal balance | | Recorded investment | | Allowance for loan losses allocated |
As of June 30, 2019 | | | | | | |
With no related allowance recorded: | | | | | | |
Residential real estate | | $2,990 | | $2,864 | | $ — |
Commercial real estate | | 6,318 | | 5,644 | | — |
Land, development, construction | | 81 | | 72 | | — |
Commercial and industrial | | 1,312 | | 1,282 | | — |
Consumer, other | | 106 | | 105 | | — |
| | | | | | |
With an allowance recorded: | | | | | | |
Residential real estate | | 2,842 | | 2,699 | | 292 |
Commercial real estate | | 1,859 | | 1,834 | | 322 |
Land, development, construction | | — | | — | | — |
Commercial and industrial | | 2,732 | | 2,675 | | 1,234 |
Consumer, other | | 32 | | 26 | | — |
Total | | $18,272 | | $17,201 | | $1,848 |
| | | | | | |
| | | | | | |
| | Unpaid principal balance | | Recorded investment | | Allowance for loan losses allocated |
As of December 31, 2018 | | | | | | |
With no related allowance recorded: | | | | | | |
Residential real estate | | $3,608 | | $3,485 | | $ — |
Commercial real estate | | 6,447 | | 5,906 | | — |
Land, development, construction | | 144 | | 117 | | — |
Commercial and industrial | | 364 | | 353 | | — |
Consumer, other | | 109 | | 108 | | — |
| | | | | | |
With an allowance recorded: | | | | | | |
Residential real estate | | 2,897 | | 2,749 | | 331 |
Commercial real estate | | 1,593 | | 1,590 | | 250 |
Land, development, construction | | — | | — | | — |
Commercial and industrial | | 1,378 | | 1,355 | | 1,034 |
Consumer, other | | 53 | | 37 | | 1 |
Total | | $16,593 | | $15,700 | | $1,616 |
30
CenterState Bank Corporation and Subsidiaries
NOTES TO CONDENSED CONSOLIDATED FINANCIAL STATEMENTS (unaudited)
(in thousands of dollars, except per share data)
| | Average of impaired loans | | Interest income recognized during impairment | | Cash basis interest income recognized |
Three-month ended June 30, 2019 | | | | | | |
Real estate loans: | | | | | | |
Residential | | $5,609 | | $59 | | $ — |
Commercial | | 7,778 | | 30 | | — |
Land, development, construction | | 94 | | 1 | | — |
Total real estate loans | | 13,481 | | 90 | | — |
| | | | | | |
Commercial and industrial | | 3,724 | | 16 | | — |
Consumer and other loans | | 133 | | 2 | | — |
Total | | $17,338 | | $108 | | $ — |
| | | | | | |
| | Average of impaired loans | | Interest income recognized during impairment | | Cash basis interest income recognized |
Six-month ended June 30, 2019 | | | | | | |
Real estate loans: | | | | | | |
Residential | | $5,776 | | $121 | | $ — |
Commercial | | 7,782 | | 55 | | — |
Land, development, construction | | 105 | | 3 | | — |
Total real estate loans | | 13,663 | | 179 | | — |
| | | | | | |
Commercial and industrial | | 3,165 | | 28 | | — |
Consumer and other loans | | 136 | | 4 | | — |
Total | | $16,964 | | $211 | | $ — |
31
CenterState Bank Corporation and Subsidiaries
NOTES TO CONDENSED CONSOLIDATED FINANCIAL STATEMENTS (unaudited)
(in thousands of dollars, except per share data)
| | Average of impaired loans | | Interest income recognized during impairment | | Cash basis interest income recognized |
Three-month ended June 30, 2018 | | | | | | |
Real estate loans: | | | | | | |
Residential | | $7,882 | | $82 | | $ — |
Commercial | | 7,986 | | 35 | | — |
Land, development, construction | | 574 | | 1 | | — |
Total real estate loans | | 16,442 | | 118 | | — |
| | | | | | |
Commercial and industrial | | 2,227 | | 9 | | — |
Consumer and other loans | | 179 | | 2 | | — |
Total | | $18,848 | | $129 | | $ — |
| | | | | | |
| | Average of impaired loans | | Interest income recognized during impairment | | Cash basis interest income recognized |
Six-month ended June 30, 2018 | | | | | | |
Real estate loans: | | | | | | |
Residential | | $8,007 | | $159 | | $ — |
Commercial | | 8,124 | | 48 | | — |
Land, development, construction | | 420 | | 4 | | — |
Total real estate loans | | 16,551 | | 211 | | — |
| | | | | | |
Commercial and industrial | | 2,624 | | 14 | | — |
Consumer and other loans | | 187 | | 4 | | — |
Total | | $19,362 | | $229 | | $ — |
32
CenterState Bank Corporation and Subsidiaries
NOTES TO CONDENSED CONSOLIDATED FINANCIAL STATEMENTS (unaudited)
(in thousands of dollars, except per share data)
Nonperforming loans include both smaller balance homogeneous loans that are collectively evaluated for impairment and individually classified impaired loans, excluding purchased credit impaired loans accounted for pursuant to ASC Topic 310-30.
Nonperforming loans were as follows: | | June 30, 2019 | | December 31, 2018 |
Non-accrual loans | | $26,334 | | $23,567 |
Loans past due over 90 days and still accruing interest | | — | | — |
Total nonperforming loans | | $26,334 | | $23,567 |
The following table presents the recorded investment in nonaccrual loans and loans past due over 90 days still on accrual by class of loans as of June 30, 2019 and December 31, 2018, excluding purchased credit impaired loans:
| | Non-accrual | | Loans past due over 90 days still accruing |
As of June 30, 2019 | | | | |
Residential real estate | | $10,368 | | $ — |
Commercial real estate | | 8,758 | | — |
Land, development, construction | | 1,811 | | — |
Commercial and industrial | | 4,783 | | — |
Consumer, other | | 614 | | — |
Total | | $26,334 | | $ — |
| | | | |
| | | | |
| | Non-accrual | | Loans past due over 90 days still accruing |
As of December 31, 2018 | | | | |
Residential real estate | | $11,488 | | $ — |
Commercial real estate | | 8,445 | | — |
Land, development, construction | | 795 | | — |
Commercial and industrial | | 2,274 | | — |
Consumer, other | | 565 | | — |
Total | | $23,567 | | $ — |
The following table presents the aging of the recorded investment in past due loans as of June 30, 2019 and December 31, 2018, excluding purchased credit impaired loans. The increase in the 30 – 59 days past due loans is primarily due to factored commercial receivables:
| | Accruing Loans | | |
As of June 30, 2019 | | Total | | 30 - 59 days past due | | 60 - 89 days past due | | Greater than 90 days past due | | Total Past Due | | Loans Not Past Due | | Nonaccrual Loans |
Residential real estate | | $2,481,717 | | $6,795 | | $6,588 | | $ — | | $13,383 | | $2,457,966 | | $10,368 |
Commercial real estate | | 6,062,203 | | 11,742 | | 5,446 | | — | | 17,188 | | 6,036,257 | | 8,758 |
Land/dev/construction | | 1,051,307 | | 1,401 | | 615 | | — | | 2,016 | | 1,047,480 | | 1,811 |
Comm., industrial & factored receivables | | 1,709,019 | | 13,792 | | 3,003 | | — | | 16,795 | | 1,687,441 | | 4,783 |
Consumer | | 246,856 | | 1,024 | | 184 | | — | | 1,208 | | 245,034 | | 614 |
| | $11,551,102 | | $34,754 | | $15,836 | | $ — | | $50,590 | | $11,474,178 | | $26,334 |
| | | | | | | | | | | | | | |
| | | | | | | | | | | | | | |
| | Accruing Loans | | |
As of December 31, 2018 | | Total | | 30 - 59 days past due | | 60 - 89 days past due | | Greater than 90 days past due | | Total Past Due | | Loans Not Past Due | | Nonaccrual Loans |
Residential real estate | | $1,702,114 | | $5,730 | | $5,631 | | $ — | | $11,360 | | $1,679,266 | | $11,488 |
Commercial real estate | | 4,454,098 | | 10,840 | | 4,607 | | — | | 15,446 | | 4,430,207 | | 8,445 |
Land/dev/construction | | 635,562 | | 661 | | 4,022 | | — | | 4,683 | | 630,084 | | 795 |
Comm. & industrial | | 1,183,380 | | 2,803 | | 878 | | — | | 3,681 | | 1,177,425 | | 2,274 |
Consumer | | 203,686 | | 1,061 | | 271 | | — | | 1,332 | | 201,789 | | 565 |
| | $8,178,840 | | $21,094 | | $15,408 | | $ — | | $36,502 | | $8,118,771 | | $23,567 |
33
CenterState Bank Corporation and Subsidiaries
NOTES TO CONDENSED CONSOLIDATED FINANCIAL STATEMENTS (unaudited)
(in thousands of dollars, except per share data)
Credit Quality Indicators:
The Company categorizes loans into risk categories based on relevant information about the ability of borrowers to service their debt such as; current financial information, historical payment experience, credit documentation, public information, and current economic trends, among other factors. The Company analyzes loans individually by classifying the loans as to credit risk. This analysis is performed on at least an annual basis. The Company uses the following definitions for risk ratings:
Special Mention: Loans classified as special mention have a potential weakness that deserves management’s close attention. If left uncorrected, these potential weaknesses may result in deterioration of the repayment prospects for the loan or of the institution’s credit position at some future date.
Substandard: Loans classified as substandard are inadequately protected by the current net worth and paying capacity of the obligor or of the collateral pledged, if any. Loans so classified have a well-defined weakness or weaknesses that jeopardize the liquidation of the debt. They are characterized by the distinct possibility that the institution will sustain some loss if the deficiencies are not corrected.
Doubtful: Loans classified as doubtful have all the weaknesses inherent in those classified as substandard, with the added characteristic that the weaknesses make collection or liquidation in full, on the basis of currently existing facts, conditions, and values, highly questionable and improbable.
Loans not meeting the criteria above that are analyzed individually as part of the above described process are considered to be pass rated loans. As of June 30, 2019 and December 31, 2018, and based on the most recent analysis performed, the risk category of loans by class of loans, excluding purchased credit-impaired loans accounted for pursuant to ASC Topic 310-30, is presented below.
| | As of June 30, 2019 |
Loan Category | | Pass | | Special Mention | | Substandard | | Doubtful |
Residential real estate | | $2,421,011 | | $34,189 | | $26,517 | | $ — |
Commercial real estate | 5,865,703 | | 139,490 | | 57,010 | | — |
Land/dev/construction | 1,037,448 | | 9,921 | | 3,938 | | — |
Comm., industrial & factored receivables | 1,653,775 | | 43,047 | | 12,197 | | — |
Consumer | | 245,665 | | 207 | | 984 | | — |
Total | | $11,223,602 | | $226,854 | | $100,646 | | $ — |
| | | | | | | | |
| | | | | | | | |
| | As of December 31, 2018 |
Loan Category | | Pass | | Special Mention | | Substandard | | Doubtful |
Residential real estate | | $1,633,810 | | $41,522 | | $26,782 | | $ — |
Commercial real estate | 4,246,687 | | 160,981 | | 46,430 | | — |
Land/dev/construction | 610,631 | | 20,586 | | 4,345 | | — |
Commercial & industrial | 1,137,272 | | 40,836 | | 5,272 | | — |
Consumer | | 202,701 | | 247 | | 738 | | — |
Total | | $7,831,100 | | $264,172 | | $83,568 | | $ — |
34
CenterState Bank Corporation and Subsidiaries
NOTES TO CONDENSED CONSOLIDATED FINANCIAL STATEMENTS (unaudited)
(in thousands of dollars, except per share data)
The Company considers the performance of the loan portfolio and its impact on the allowance for loan losses. For residential and consumer loan classes, the Company also evaluates credit quality based on the aging status of the loan, which was previously presented, and by payment activity. The following table presents the recorded investment in residential and consumer loans, excluding purchased credit impaired loans, based on payment activity as of June 30, 2019 and December 31, 2018:
As of June 30, 2019 | | Residential | | Consumer |
Performing | | $2,471,349 | | $246,242 |
Nonperforming | | 10,368 | | 614 |
Total | | $2,481,717 | | $246,856 |
| | | | |
| | | | |
As of December 31, 2018 | | Residential | | Consumer |
Performing | | $1,690,626 | | $203,121 |
Nonperforming | | 11,488 | | 565 |
Total | | $1,702,114 | | $203,686 |
Purchased Credit Impaired (“PCI”) loans:
Income is recognized on PCI loans pursuant to ASC Topic 310-30. A portion of the fair value discount has been ascribed as an accretable yield that is accreted into interest income over the estimated remaining life of the loans. The remaining non-accretable difference represents cash flows not expected to be collected.
The table below summarizes the total contractually required principal and interest cash payments, management’s estimate of expected total cash payments and carrying value of the loans as of June 30, 2019 and December 31, 2018. Contractually required principal and interest payments have been adjusted for estimated prepayments.
| | June 30, 2019 | | December 31, 2018 |
Contractually required principal and interest | | $283,501 | | $267,815 |
Non-accretable difference | | (56,084) | | (38,602) |
Cash flows expected to be collected | | 227,417 | | 229,213 |
Accretable yield | | (70,114) | | (70,242) |
Carrying value of acquired loans | | 157,303 | | 158,971 |
Allowance for loan losses | | (198) | | (191) |
Carrying value less allowance for loan losses | | $157,105 | | $158,780 |
The Company adjusted its estimates of future expected losses, cash flows and renewal assumptions during the current quarter. These adjustments resulted in an increase in expected cash flows and accretable yield, and a decrease in the non-accretable difference. The Company reclassified $3,466, $2,187, $10,665 and $3,914 from non-accretable difference to accretable yield during the three and six-month periods ending June 30, 2019 and 2018 to reflect its adjusted estimates of future expected cash flows. The table below summarizes the changes in total contractually required principal and interest cash payments, management’s estimate of expected total cash payments and carrying value of the loans during the three and six-month periods ending June 30, 2019 and 2018.
35
CenterState Bank Corporation and Subsidiaries
NOTES TO CONDENSED CONSOLIDATED FINANCIAL STATEMENTS (unaudited)
(in thousands of dollars, except per share data)
Activity during the | | | | Effect of | | income | | all other | | |
three-month period ending June 30, 2019 | | March 31, 2019 | | acquisitions | | accretion | | adjustments | | June 30, 2019 |
Contractually required principal and interest | | $248,243 | | $51,527 | | $ — | | $(16,269) | | $283,501 |
Non-accretable difference | | (28,865) | | (29,187) | | — | | 1,968 | | (56,084) |
Cash flows expected to be collected | | 229,213 | | 22,340 | | — | | (14,301) | | 227,417 |
Accretable yield | | (69,922) | | (3,724) | | 7,750 | | (4,218) | | (70,114) |
Carry value of acquired loans | | $149,456 | | $18,616 | | $7,750 | | $(18,519) | | $157,303 |
| | | | | | | | | | |
Activity during the | | | | Effect of | | income | | all other | | |
six-month period ending June 30, 2019 | | December 31, 2018 | | acquisitions | | accretion | | adjustments | | June 30, 2019 |
Contractually required principal and interest | | $267,815 | | $51,527 | | $ — | | $(35,841) | | $283,501 |
Non-accretable difference | | (38,602) | | (29,187) | | — | | 11,705 | | (56,084) |
Cash flows expected to be collected | | 229,213 | | 22,340 | | — | | (24,136) | | 227,417 |
Accretable yield | | (70,242) | | (3,724) | | 17,890 | | (14,038) | | (70,114) |
Carry value of acquired loans | | $158,971 | | $18,616 | | $17,890 | | $(38,174) | | $157,303 |
| | | | | | | | | | |
Activity during the | | | | Effect of | | income | | all other | | |
three-month period ending June 30, 2018 | | March 31, 2018 | | acquisitions | | accretion | | adjustments | | June 30, 2018 |
Contractually required principal and interest | | $315,277 | | $ — | | $ — | | $(29,701) | | $285,576 |
Non-accretable difference | | (50,237) | | — | | — | | 6,071 | | (44,166) |
Cash flows expected to be collected | | 265,040 | | — | | — | | (23,630) | | 241,410 |
Accretable yield | | (71,857) | | — | | 11,096 | | (6,699) | | (67,460) |
Carry value of acquired loans | | $193,183 | | $ — | | $11,096 | | $(30,329) | | $173,950 |
| | | | | | | | | | |
Activity during the | | | | Effect of | | income | | all other | | |
six-month period ending June 30, 2018 | | December 31, 2017 | | acquisitions | | accretion | | adjustments | | June 30, 2018 |
Contractually required principal and interest | | $248,283 | | $88,705 | | $ — | | $(51,412) | | $285,576 |
Non-accretable difference | | (13,183) | | (38,164) | | — | | 7,181 | | (44,166) |
Cash flows expected to be collected | | 235,100 | | 50,541 | | — | | (44,231) | | 241,410 |
Accretable yield | | (70,942) | | (6,278) | | 18,814 | | (9,054) | | (67,460) |
Carry value of acquired loans | | $164,158 | | $44,263 | | $18,814 | | $(53,285) | | $173,950 |
36
CenterState Bank Corporation and Subsidiaries
NOTES TO CONDENSED CONSOLIDATED FINANCIAL STATEMENTS (unaudited)
(in thousands of dollars, except per share data)
NOTE 8: Securities sold under agreement to repurchase
The Company enters into borrowing arrangements with our retail business customers by agreements to repurchase (“securities sold under agreements to repurchase”) under which the bank pledges investment securities owned and under its control as collateral against these one-day borrowing arrangements. These short-term borrowings totaled $78,277 at June 30, 2019 compared to $57,772 at December 31, 2018. The following table provides additional details for the periods presented.
| | MBS | | Municipal | | |
As of June 30, 2019 | | Securities | | Securities | | Total |
Market value of securities pledged | | $98,673 | | $450 | | $99,123 |
Borrowings related to pledged amounts | | 78,150 | | 127 | | 78,277 |
Market value pledged as a % of borrowings | | 126% | | 354% | | 127% |
| | | | | | |
As of December 31, 2018 | | | | | | |
Market value of securities pledged | | $64,269 | | $437 | | $64,706 |
Borrowings related to pledged amounts | | 57,594 | | 178 | | 57,772 |
Market value pledged as a % of borrowings | | 112% | | 246% | | 112% |
Any risk related to these arrangements, primarily market value changes, are minimized due to the overnight (one day) maturity and the additional collateral pledged over the borrowed amounts.
NOTE 9: Business Combinations
Acquisition of Sunshine Bancorp, Inc.
On January 1, 2018, the Company completed its acquisition of Sunshine, whereby Sunshine merged with and into the Company. Pursuant to and simultaneously with the merger of Sunshine with and into the Company, Sunshine’s wholly owned subsidiary bank, Sunshine Bank merged with and into the Company’s subsidiary bank, CenterState Bank, N.A.
The Company’s primary reasons for the transaction were to further solidify its market share in the Florida market and expand its customer base to enhance deposit fee income and leverage operating cost through economies of scale. The acquisition increased the Company’s total assets and total deposits by approximately 14% and 13%, respectively, as compared with the balances at December 31, 2017, and is expected to positively affect the Company’s operating results to the extent the Company earns more from interest earning assets than it pays in interest on its interest bearing liabilities. The Company incurred no acquisition costs related to this transaction during the three and six-month periods ending June 30, 2019. During the three and six-month periods ending June 30, 2018, the Company incurred approximately $8,403 and $10,474 of acquisition costs related to this transaction. These acquisition costs are reported in merger and acquisition related expenses on the Company’s Condensed Consolidated Statements of Income and Comprehensive Income.
The acquisition was accounted for under the acquisition method of accounting in accordance with ASC Topic 805, Business Combinations. The Company recognized goodwill on this acquisition of $114,228 which is nondeductible for tax purposes as this acquisition is a nontaxable transaction. The goodwill is calculated based on the fair values of the assets acquired and liabilities assumed as of the acquisition date.
The Company acquired 100% of the outstanding common stock of Sunshine. The purchase price consisted of stock plus cash in lieu of fractional shares. Each share of Sunshine common stock was exchanged for 0.89 shares of the Company’s common stock. Based on the closing price of the Company’s common stock on December 29, 2017, the resulting purchase price was $187,852.
The table below summarizes the purchase price calculation.
Number of shares of Sunshine common stock outstanding at December 31, 2017 | | | 7,922,479 | |
Per share exchange ratio | | | 0.89 | |
Number of shares of CenterState common stock less 361 of fractional shares | | | 7,050,645 | |
CenterState common stock price per share on December 29, 2017 | | $ | 25.73 | |
Fair value of CenterState common stock issued | | $ | 181,413 | |
Cash consideration paid for 361 of fractional shares | | | 7 | |
Total consideration to be paid to Sunshine common shareholders | | $ | 181,420 | |
Fair value of Sunshine stock options converted to CenterState stock options | | | 6,432 | |
Total Purchase Price for Sunshine | | $ | 187,852 | |
37
CenterState Bank Corporation and Subsidiaries
NOTES TO CONDENSED CONSOLIDATED FINANCIAL STATEMENTS (unaudited)
(in thousands of dollars, except per share data)
The list below summarizes the fair value of the assets purchased, including goodwill, and liabilities assumed as of the January 1, 2018 purchase date.
| | January 1, 2018 | |
Assets: | | | | |
Cash and cash equivalents | | $ | 47,056 | |
Loans, held for investment | | | 676,090 | |
Purchased credit impaired loans | | | 8,232 | |
Loans held for sale | | | 430 | |
Investments | | | 93,006 | |
Accrued interest receivable | | | 2,170 | |
Branch real estate | | | 9,375 | |
Furniture and fixtures | | | 916 | |
Bank property held for sale | | | 9,503 | |
FHLB stock | | | 4,875 | |
Bank owned life insurance | | | 23,101 | |
Core deposit intangible | | | 8,525 | |
Goodwill | | | 114,228 | |
Deferred tax asset | | | 11,670 | |
Other assets | | | 6,135 | |
Total assets acquired | | $ | 1,015,312 | |
Liabilities: | | | | |
Deposits | | $ | 719,039 | |
Federal Home Loan Bank advances | | | 95,001 | |
Securities sold under agreement to repurchase | | | 353 | |
Subordinated notes | | | 11,000 | |
Accrued interest payable | | | 457 | |
Other liabilities | | | 1,610 | |
Total liabilities assumed | | $ | 827,460 | |
In the acquisition, the Company acquired $684,322 of loans at fair value, net of $22,657, or 3.2%, estimated discount to the outstanding principal balance, representing 14.3% of the Company’s total loans at December 31, 2017. Of the total loans acquired, management identified $8,232 with credit deficiencies. All loans that were on non-accrual status, impaired loans including TDRs and other substandard loans were considered by management to be credit impaired and are accounted for pursuant to ASC Topic 310-30.
The table below summarizes the total contractually required principal and interest cash payments, management’s estimate of expected total cash payments and fair value of the loans as of January 1, 2018 for purchased credit impaired loans. Contractually required principal and interest payments have been adjusted for estimated prepayments.
Contractually required principal and interest | | $ | 21,598 | |
Non-accretable difference | | | (12,213 | ) |
Cash flows expected to be collected | | | 9,385 | |
Accretable yield | | | (1,153 | ) |
Total purchased credit-impaired loans acquired | | $ | 8,232 | |
The table below presents information with respect to the fair value of acquired loans, as well as their unpaid principal balance (“Book Balance”) at acquisition date.
| | Book | | | Fair | |
| | Balance | | | Value | |
Loans: | | | | | | | | |
Single family residential real estate | | $ | 148,342 | | | $ | 146,057 | |
Commercial real estate | | | 375,377 | | | | 371,323 | |
Construction/development/land | | | 58,530 | | | | 57,331 | |
Commercial loans | | | 104,811 | | | | 99,650 | |
Consumer and other loans | | | 1,770 | | | | 1,729 | |
Purchased credit-impaired | | | 18,149 | | | | 8,232 | |
Total earning assets | | $ | 706,979 | | | $ | 684,322 | |
38
CenterState Bank Corporation and Subsidiaries
NOTES TO CONDENSED CONSOLIDATED FINANCIAL STATEMENTS (unaudited)
(in thousands of dollars, except per share data)
In its assumption of the deposit liabilities, the Company believed the deposits assumed from the acquisition have an intangible value. The Company applied ASC Topic 805, which prescribes the accounting for goodwill and other intangible assets such as core deposit intangibles, in a business combination. The Company determined the estimated fair value of the core deposit intangible asset totaled $8,525, which will be amortized utilizing an accelerated amortization method over an estimated economic life not to exceed ten years. In determining the valuation amount, deposits were analyzed based on factors such as type of deposit, deposit retention, interest rates and age of deposit relationships.
Acquisition of HCBF Holding Company, Inc.
On January 1, 2018, the Company completed its acquisition of HCBF, whereby Harbor merged with and into the Company. Pursuant to and simultaneously with the merger of Harbor with and into the Company, Harbor’s wholly owned subsidiary bank, Harbor Bank merged with and into the Company’s subsidiary bank, CenterState Bank, N.A.
The Company’s primary reasons for the transaction were to further solidify its market share in the Florida market and expand its customer base to enhance deposit fee income and leverage operating cost through economies of scale. The acquisition increased the Company’s total assets and total deposits by approximately 33% and 32%, respectively, as compared with the balances at December 31, 2017, and is expected to positively affect the Company’s operating results to the extent the Company earns more from interest earning assets than it pays in interest on its interest bearing liabilities. The Company incurred no acquisition costs related to this transaction during the three and six-month periods ending June 30, 2019. During the three and six-month periods ending June 30, 2018, the Company incurred approximately $ 5,737 and $11,527 of acquisition costs related to this transaction. These acquisition costs are reported in merger and acquisition related expenses on the Company’s Consolidated Statements of Income and Comprehensive Income.
The acquisition was accounted for under the acquisition method of accounting in accordance with ASC Topic 805, Business Combinations. The Company recognized goodwill on this acquisition of $233,321 which is nondeductible for tax purposes as this acquisition is a nontaxable transaction. The goodwill is calculated based on the fair values of the assets acquired and liabilities assumed as of the acquisition date.
The Company acquired 100% of the outstanding common stock of Harbor. The purchase price consisted of both cash and stock. Each share of Harbor common stock was exchanged for $1.925 cash and 0.675 shares of the Company’s common stock. Based on the closing price of the Company’s common stock on December 29, 2017, the resulting purchase price was $448,236.
39
CenterState Bank Corporation and Subsidiaries
NOTES TO CONDENSED CONSOLIDATED FINANCIAL STATEMENTS (unaudited)
(in thousands of dollars, except per share data)
The table below summarizes the purchase price calculation.
Number of shares of Harbor common stock outstanding at December 31, 2017 | | | 22,299,082 | |
Per share exchange ratio | | | 0.675 | |
Number of shares of CenterState common stock less 241 of fractional shares | | | 15,051,639 | |
CenterState common stock price per share on December 29, 2017 | | $ | 25.73 | |
Fair value of CenterState common stock issued | | $ | 387,279 | |
| | | | |
Number of shares of Harbor common stock outstanding at December 31, 2017 | | | 22,299,082 | |
Cash consideration each Harbor share is entitled to receive | | $ | 1.925 | |
Total Cash Consideration plus $6 for 241 of fractional shares | | $ | 42,932 | |
| | | | |
Total Stock Consideration | | $ | 387,279 | |
Total Cash Consideration | | | 42,932 | |
Total consideration to be paid to Harbor common shareholders | | $ | 430,211 | |
Fair value of Harbor stock options converted to CenterState stock options | | $ | 18,025 | |
Total Purchase Price for Harbor | | $ | 448,236 | |
The list below summarizes the fair value of the assets purchased, including goodwill, and liabilities assumed as of the January 1, 2018 purchase date.
| | January 1, 2018 | |
Assets: | | | | |
Cash and cash equivalents | | $ | 77,176 | |
Loans, held for investment | | | 1,290,004 | |
Purchased credit impaired loans | | | 36,031 | |
Loans held for sale | | | 5,694 | |
Investments | | | 585,297 | |
Accrued interest receivable | | | 5,847 | |
Branch real estate | | | 34,035 | |
Furniture and fixtures | | | 3,571 | |
Bank property held for sale | | | 14,140 | |
FHLB and other stock | | | 9,488 | |
Bank owned life insurance | | | 39,089 | |
Other real estate owned | | | 5,144 | |
Core deposit intangible | | | 23,625 | |
Goodwill | | | 233,321 | |
Deferred tax asset | | | 14,071 | |
Other assets | | | 2,536 | |
Total assets acquired | | $ | 2,379,069 | |
Liabilities: | | | | |
Deposits | | $ | 1,755,155 | |
Federal Home Loan Bank advances | | | 157,919 | |
Corporate debentures | | | 5,872 | |
Accrued interest payable | | | 478 | |
Other liabilities | | | 11,409 | |
Total liabilities assumed | | $ | 1,930,833 | |
40
CenterState Bank Corporation and Subsidiaries
NOTES TO CONDENSED CONSOLIDATED FINANCIAL STATEMENTS (unaudited)
(in thousands of dollars, except per share data)
In the acquisition, the Company acquired $1,326,035 of loans at fair value, net of $40,438, or 3.0%, estimated discount to the outstanding principal balance, representing 27.8% of the Company’s total loans at December 31, 2017. Of the total loans acquired, management identified $36,031 with credit deficiencies. All loans that were on non-accrual status, impaired loans including TDRs and other substandard loans were considered by management to be credit impaired and are accounted for pursuant to ASC Topic 310-30.
The table below summarizes the total contractually required principal and interest cash payments, management’s estimate of expected total cash payments and fair value of the loans as of January 1, 2018 for purchased credit impaired loans. Contractually required principal and interest payments have been adjusted for estimated prepayments.
Contractually required principal and interest | | $ | 67,107 | |
Non-accretable difference | | | (25,951 | ) |
Cash flows expected to be collected | | | 41,156 | |
Accretable yield | | | (5,125 | ) |
Total purchased credit-impaired loans acquired | | $ | 36,031 | |
The table below presents information with respect to the fair value of acquired loans, as well as their Book Balance at acquisition date.
| | Book | | | Fair | |
| | Balance | | | Value | |
Loans: | | | | | | | | |
Single family residential real estate | | $ | 370,611 | | | $ | 363,559 | |
Commercial real estate | | | 636,517 | | | | 627,900 | |
Construction/development/land | | | 149,547 | | | | 146,639 | |
Commercial loans | | | 113,818 | | | | 110,630 | |
Consumer and other loans | | | 41,660 | | | | 41,276 | |
Purchased credit-impaired | | | 54,320 | | | | 36,031 | |
Total earning assets | | $ | 1,366,473 | | | $ | 1,326,035 | |
In its assumption of the deposit liabilities, the Company believed the deposits assumed from the acquisition have an intangible value. The Company applied ASC Topic 805, which prescribes the accounting for goodwill and other intangible assets such as core deposit intangibles, in a business combination. The Company determined the estimated fair value of the core deposit intangible asset totaled $23,625, which will be amortized utilizing an accelerated amortization method over an estimated economic life not to exceed ten years. In determining the valuation amount, deposits were analyzed based on factors such as type of deposit, deposit retention, interest rates and age of deposit relationships.
Acquisition of Charter Financial Corporation
On September 1, 2018, the Company completed its acquisition of Charter Financial Corporation (“Charter”) whereby Charter merged with and into the Company. Pursuant to and simultaneously with the merger of Charter with and into the Company, Charter’s wholly owned subsidiary bank, CharterBank, merged with and into the Company’s subsidiary bank, CenterState Bank, N.A.
The Company’s primary reasons for the transaction were to expand its franchise into Georgia and Alabama, as well as the Panhandle area of Florida, and expand its customer base to enhance deposit fee income and leverage operating cost through economies of scale. The acquisition increased the Company’s total assets and total deposits by approximately 24% as compared with the balances at December 31, 2017, and is expected to positively affect the Company’s operating results to the extent the Company earns more from interest earning assets than it pays in interest on its interest bearing liabilities. During the three and six-month periods ending June 30, 2019, the Company incurred approximately $885 and $5,986 of acquisition costs related to this transaction. These acquisition costs are reported in merger and acquisition related expenses on the Company’s Consolidated Statements of Income and Comprehensive Income.
The acquisition was accounted for under the acquisition method of accounting in accordance with ASC Topic 805, Business Combinations. The Company recognized goodwill on this acquisition of $197,648 which is nondeductible for tax purposes as this acquisition is a nontaxable transaction. The goodwill is calculated based on the fair values of the assets acquired and liabilities assumed as of the acquisition date. Fair values are subject to change for up to one year after the closing date of the acquisition as additional information relative to closing date fair values becomes available.
The Company acquired 100% of the outstanding common stock of Charter. The purchase price consisted of both cash and stock. Each share of Charter common stock was exchanged for $2.30 cash and 0.738 shares of the Company’s common stock. Based on the closing price of the Company’s common stock on August 31, 2018, the resulting purchase price was $389,476.
41
CenterState Bank Corporation and Subsidiaries
NOTES TO CONDENSED CONSOLIDATED FINANCIAL STATEMENTS (unaudited)
(in thousands of dollars, except per share data)
The table below summarizes the purchase price calculation.
Number of shares of Charter common stock outstanding at August 31, 2018 | | | 15,480,776 | |
Per share exchange ratio | | | 0.738 | |
Number of shares of CenterState common stock less 599 of fractional shares | | | 11,424,214 | |
CenterState common stock price per share on August 31, 2018 | | $ | 30.62 | |
Fair value of CenterState common stock issued | | $ | 349,809 | |
| | | | |
Number of shares of Charter common stock outstanding at August 31, 2018 | | | 15,480,776 | |
Cash consideration each Charter share is entitled to receive | | $ | 2.300 | |
Total Cash Consideration plus $17 for 599 of fractional shares | | $ | 35,624 | |
| | | | |
Total Stock Consideration | | $ | 349,809 | |
Total Cash Consideration | | | 35,624 | |
Total consideration to be paid to Charter common shareholders | | $ | 385,433 | |
Cash out of Charter stock options | | | 4,043 | |
Total Purchase Price for Charter | | $ | 389,476 | |
The list below summarizes the fair value of the assets purchased, including goodwill, and liabilities assumed as of the September 1, 2018 purchase date.
| | September 1, 2018 | |
Assets: | | | | |
Cash and cash equivalents | | $ | 184,020 | |
Loans, held for investment | | | 1,130,240 | |
Purchased credit impaired loans | | | 11,432 | |
Loans held for sale | | | 2,835 | |
Investments | | | 73,808 | |
Accrued interest receivable | | | 3,684 | |
Branch real estate | | | 27,930 | |
Furniture and fixtures | | | 1,988 | |
Bank property held for sale | | | 1,695 | |
FHLB and other stock | | | 1,483 | |
Bank owned life insurance | | | 54,813 | |
Other real estate owned | | | 257 | |
Servicing asset | | | 1,828 | |
Core deposit intangible | | | 19,795 | |
Goodwill | | | 197,648 | |
Deferred tax asset | | | 3,441 | |
Other assets | | | 17,644 | |
Total assets acquired | | $ | 1,734,541 | |
Liabilities: | | | | |
Deposits | | $ | 1,321,970 | |
Corporate debentures | | | 9,000 | |
Accrued interest payable | | | 1,015 | |
Other liabilities | | | 13,080 | |
Total liabilities assumed | | $ | 1,345,065 | |
42
CenterState Bank Corporation and Subsidiaries
NOTES TO CONDENSED CONSOLIDATED FINANCIAL STATEMENTS (unaudited)
(in thousands of dollars, except per share data)
In the acquisition, the Company acquired $1,141,672 of loans at fair value, net of $23,118, or 2.0%, estimated discount to the outstanding principal balance, representing 23.9% of the Company’s total loans at December 31, 2017. Of the total loans acquired, management identified $11,432 with credit deficiencies. All loans that were on non-accrual status, impaired loans including TDRs and some substandard loans were considered by management to be credit impaired and are accounted for pursuant to ASC Topic 310-30.
The table below summarizes the total contractually required principal and interest cash payments, management’s estimate of expected total cash payments and fair value of the loans as of September 1, 2018 for purchased credit impaired loans. Contractually required principal and interest payments have been adjusted for estimated prepayments.
Contractually required principal and interest | | $ | 33,687 | |
Non-accretable difference | | | (20,763 | ) |
Cash flows expected to be collected | | | 12,924 | |
Accretable yield | | | (1,492 | ) |
Total purchased credit-impaired loans acquired | | $ | 11,432 | |
The table below presents information with respect to the fair value of acquired loans, as well as their Book Balance at acquisition date.
| | Book | | | Fair | |
| | Balance | | | Value | |
Loans: | | | | | | | | |
Single family residential real estate | | $ | 284,505 | | | $ | 280,200 | |
Commercial real estate | | | 567,506 | | | | 557,730 | |
Construction/development/land | | | 181,128 | | | | 178,687 | |
Commercial loans | | | 88,308 | | | | 87,062 | |
Consumer and other loans | | | 26,221 | | | | 26,561 | |
Purchased credit-impaired | | | 17,122 | | | | 11,432 | |
Total earning assets | | $ | 1,164,790 | | | $ | 1,141,672 | |
In its assumption of the deposit liabilities, the Company believed the deposits assumed from the acquisition have an intangible value. The Company applied ASC Topic 805, which prescribes the accounting for goodwill and other intangible assets such as core deposit intangibles, in a business combination. The Company determined the estimated fair value of the core deposit intangible asset totaled $19,795, which will be amortized utilizing an accelerated amortization method over an estimated economic life not to exceed ten years. In determining the valuation amount, deposits were analyzed based on factors such as type of deposit, deposit retention, interest rates and age of deposit relationships.
Acquisition of National Commerce Corporation
On April 1, 2019, the Company completed its acquisition of NCOM whereby NCOM merged with and into the Company. Pursuant to and simultaneously with the merger of NCOM with and into the Company, NCOM’s wholly owned subsidiary bank, National Bank of Commerce, merged with and into the Company’s subsidiary bank, CenterState Bank, N.A. As a result of that merger, the Bank acquired a controlling 70% interest in CBI, and its factoring subsidiary, Corporate Billing.
The Company’s primary reasons for the transaction were to further expand its franchise into Georgia and Alabama, further solidify its market share in the Florida market and expand its customer base to enhance deposit fee income and leverage operating cost through economies of scale. The acquisition increased the Company’s total assets and total deposits by approximately 36% and 37% as compared with the balances at December 31, 2018 and is expected to positively affect the Company’s operating results to the extent the Company earns more from interest earning assets than it pays in interest on its interest bearing liabilities. During the three and six-month periods ending June 30, 2019, the Company incurred approximately $14,854 and $16,118 of acquisition costs related to this transaction. These acquisition costs are reported in merger and acquisition related expenses on the Company’s Consolidated Statements of Income and Comprehensive Income.
The acquisition was accounted for under the acquisition method of accounting in accordance with ASC Topic 805, Business Combinations. The Company recognized goodwill on this acquisition of $401,538 which is nondeductible for tax purposes as this acquisition is a nontaxable transaction. The goodwill is calculated based on the fair values of the assets acquired and liabilities assumed as of the acquisition date. Fair value estimates are based on the information available, and are subject to change for up to one year after the closing date of the acquisition as additional information relative to closing date fair values becomes available. Fair value estimates are deemed preliminary due to pending final reports from valuation specialists and corporate tax returns.
43
CenterState Bank Corporation and Subsidiaries
NOTES TO CONDENSED CONSOLIDATED FINANCIAL STATEMENTS (unaudited)
(in thousands of dollars, except per share data)
The Company acquired 100% of the outstanding common stock of NCOM. The purchase price consisted of stock plus cash in lieu of fractional shares. Each share of NCOM common stock was exchanged for 1.65 shares of the Company’s common stock. Based on the closing price of the Company’s common stock on March 29, 2019, the resulting purchase price was $831,696.
The table below summarizes the purchase price calculation.
Number of shares of NCOM common stock outstanding at March 29, 2019 | | 21,011,352 |
Per share exchange ratio | | 1.650 |
Number of shares of CenterState common stock less 763 of fractional shares | | 34,667,968 |
CenterState common stock price per share on March 29, 2019 | | $23.81 |
Fair value of CenterState common stock issued | | $825,444 |
| | |
Cash Consideration for 763 of fractional shares | | $20 |
| | |
Total Stock Consideration | | $825,444 |
Total Cash Consideration | | 20 |
Total consideration to be paid to NCOM common shareholders | | $825,464 |
Fair value of NCOM stock options converted to CenterState stock options | | 5,848 |
Fair value of NCOM warrants converted to CenterState warrants | | 384 |
Total Purchase Price for NCOM | | $831,696 |
The list below summarizes the fair value of the assets purchased, including goodwill, and liabilities assumed as of the April 1, 2019 purchase date.
| | April 1, 2019 |
Assets: | | |
Cash and cash equivalents | | $268,524 |
Loans, held for investment | | 3,309,234 |
Purchased credit impaired loans | | 18,616 |
Loans held for sale | | 14,588 |
Investments | | 178,488 |
Accrued interest receivable | | 11,006 |
Branch real estate | | 61,295 |
Furniture and fixtures | | 7,204 |
Bank property held for sale | | 12,436 |
FHLB, FRB and other stock | | 17,076 |
Bank owned life insurance | | 55,474 |
Other real estate owned | | 875 |
Servicing asset | | 1,580 |
Core deposit intangible | | 39,900 |
Goodwill | | 401,538 |
Deferred tax asset | | 16,285 |
Other assets | | 23,663 |
Total assets acquired | | $4,437,782 |
Liabilities: | | |
Deposits | | $3,486,732 |
Securities sold under agreement to repurchase | | 18,833 |
Subordinated debt | | 38,802 |
Accrued interest payable | | 2,095 |
Other liabilities | | 47,622 |
Noncontrolling interest | | 12,002 |
Total liabilities assumed and noncontrolling interest | | $3,606,086 |
44
CenterState Bank Corporation and Subsidiaries
NOTES TO CONDENSED CONSOLIDATED FINANCIAL STATEMENTS (unaudited)
(in thousands of dollars, except per share data)
In the acquisition, the Company acquired $3,327,850 of loans at fair value, net of $61,384, or 1.8%, estimated discount to the outstanding principal balance, representing 39.9% of the Company’s total loans at December 31, 2018. Of the total loans acquired, management identified $18,616 with credit deficiencies. All loans that were on non-accrual status, impaired loans including TDRs and some substandard loans were considered by management to be credit impaired and are accounted for pursuant to ASC Topic 310-30.
The table below summarizes the total contractually required principal and interest cash payments, management’s estimate of expected total cash payments and fair value of the loans as of April 1, 2019 for purchased credit impaired loans. Contractually required principal and interest payments have been adjusted for estimated prepayments.
Contractually required principal and interest | | $51,527 |
Non-accretable difference | | (29,187) |
Cash flows expected to be collected | | 22,340 |
Accretable yield | | (3,724) |
Total purchased credit-impaired loans acquired | | $18,616 |
The table below presents information with respect to the fair value of acquired loans, as well as their Book Balance at acquisition date.
| | Book | | Fair |
| | Balance | | Value |
Loans: | | | | |
Single family residential real estate | | $615,296 | | $608,705 |
Commercial real estate | | 1,762,480 | | 1,736,653 |
Construction/development/land | | 363,005 | | 358,643 |
Commercial loans | | 539,698 | | 536,262 |
Consumer and other loans | | 70,058 | | 68,971 |
Purchased credit-impaired | | 38,697 | | 18,616 |
Total earning assets | | $3,389,234 | | $3,327,850 |
In its assumption of the deposit liabilities, the Company believed the deposits assumed from the acquisition have an intangible value. The Company applied ASC Topic 805, which prescribes the accounting for goodwill and other intangible assets such as core deposit intangibles, in a business combination. The Company determined the estimated fair value of the core deposit intangible asset totaled $39,900, which will be amortized utilizing an accelerated amortization method over an estimated economic life not to exceed ten years. In determining the valuation amount, deposits were analyzed based on factors such as type of deposit, deposit retention, interest rates and age of deposit relationships.
Pro-forma information
Pro-forma data for the three and six-month periods ending June 30, 2018 listed in the table below presents pro-forma information as if the Charter and NCOM acquisitions occurred at the beginning of 2018. Pro-forma data for the six-month period ending June 30, 2019 listed in the table below presents pro-forma information as if the NCOM acquisition occurred at the beginning of 2018.
| | Three months ended June 30, | | Six months ended June 30, |
| | 2018 | | 2019 | | 2018 |
Net interest income | | $154,919 | | $317,027 | | $304,885 |
Net income available to common shareholders | | $50,952 | | $125,218 | | $105,963 |
EPS - basic | | $0.41 | | $0.96 | | $0.86 |
EPS - diluted | | $0.41 | | $0.96 | | $0.85 |
The disclosures regarding the results of operations for NCOM and Charter subsequent to their respective acquisition dates are omitted as this information is not practical to obtain. Although the Company did not convert Charter’s core system in the third quarter of 2018 or NCOM’s core system in the second quarter of 2019, the majority of the fixed costs and purchase accounting entries were booked on the Company’s core system making it impractical to determine Charter or NCOM’s results of operation on a stand-alone basis.
45
CenterState Bank Corporation and Subsidiaries
NOTES TO CONDENSED CONSOLIDATED FINANCIAL STATEMENTS (unaudited)
(in thousands of dollars, except per share data)
NOTE 10: Interest Rate Swap Derivatives
Fair Value Hedge
The Company enters into interest rate swaps in order to provide commercial loan clients the ability to swap from variable to fixed interest rates. Under these agreements, the Company enters into a variable rate loan with a client in addition to a swap agreement. This swap agreement effectively converts the client’s variable rate loan into a fixed rate. The Company then enters into a matching swap agreement with a third party dealer in order to offset its exposure on the customer swap. At June 30, 2019 and December 31, 2018, the notional amount of such arrangements were $7,213,713 and $5,743,283, respectively. The Company pledged $173,530 and $28,345 of cash as collateral to the third party dealers at June 30, 2019 and December 31, 2018, respectively. As the interest rate swaps with the clients and third parties are not designated as hedges under ASC 815, changes in market values are reported in earnings.
Summary information about the interest rate swap derivative instruments is as follows:
| | June 30, 2019 | | December 31, 2018 |
Notional amount | | $7,213,713 | | $5,743,283 |
Weighted average pay rate on interest-rate swaps | | 3.56% | | 3.64% |
Weighted average receive rate on interest rate swaps | | 3.57% | | 3.64% |
Weighted average maturity (years) | | 11 | | 11 |
Fair value of interest rate swap derivatives (asset) | | $229,735 | | $92,475 |
Fair value of interest rate swap derivatives (liability) | | $231,325 | | $92,892 |
Cash Flow Hedge
The Company is exposed to certain risks relating to its ongoing business operations. The primary risk managed by using derivative instruments is interest rate risk. Interest rate swaps are utilized to manage interest rate risk associated with the Company's variable rate borrowings entered during the current quarter of 2019. The Company recognizes interest rate swaps as either assets or liabilities at fair value in the Condensed Consolidated Balance Sheets.
The interest rate swap contract entered during the current quarter of 2019 on a variable rate borrowing was designated as a cash flow hedge and was negotiated over the counter. The contract was entered into by the Company with a counterparty and the specific agreement of terms were negotiated, including the amount, interest rate and maturity.
The following table reflects the cash flow hedge included in the Condensed Consolidated Balance Sheets as of June 30, 2019:
| | June 30, 2019 |
Notional amount | | $150,000 |
Fair value of interest rate swap derivatives (asset) | | — |
Fair value of interest rate swap derivatives (liability) | | 410 |
The following table presents the net unrealized holding losses recorded in Accumulated Other Comprehensive Income on the Company’s Condensed Consolidated Balance Sheet and Condensed Consolidated Statements of Income and Comprehensive Income relating to the cash flow derivative instrument for the six-month period ended June 30, 2019:
| | June 30, 2019 |
| | Amount of | | Amount of gain / (loss) | | Location of gain / (loss) |
| | loss | | reclassified from OCI | | reclassified from AOCI |
| | recognized in OCI | | to interest income | | to income |
Interest rate contracts - pay fixed, receive floating | | $(306) | | $ — | | Interest expense: Federal funds purchased and other borrowings |
During the three and six-month ended June 30, 2019, the derivative position designed as a cash flow hedge was not discontinued and none of the losses reported in Accumulated Other Comprehensive Income were reclassified into earnings as a result of the discontinuance of a cash flow hedge or because of the early extinguishment of the borrowing.
NOTE 11: Leases
In February 2016, the FASB established Topic 842, Leases, by issuing Accounting Standards Update (ASU) No. 2016-02, which requires lessees to recognize leases on-balance sheet and disclose key information about leasing arrangements. Subsequently, amendments ASU No. 2018-01, Land Easement Practical Expedient for Transition to Topic 842; ASU No. 2018-10, Codification
46
CenterState Bank Corporation and Subsidiaries
NOTES TO CONDENSED CONSOLIDATED FINANCIAL STATEMENTS (unaudited)
(in thousands of dollars, except per share data)
Improvements to Topic 842, Leases; and ASU No. 2018-11, Targeted Improvements were issued. ASC 842 establishes a right-of-use (“ROU”) model that requires a lessee to recognize a ROU asset and lease liability on the balance sheet for all leases with a term longer than 12 months. Leases are classified as finance or operating, with classification affecting the pattern and classification of expense recognition in the income statement.
The Company leases certain properties and equipment under operating leases that resulted in the recognition of ROU Lease Assets of $20,311 and Lease Liabilities of $22,795 on the Company’s Condensed Consolidated Balance Sheets. The one-time transition impact to retained earnings from measurement differences was approximately $1,093 as disclosed on the Company’s Condensed Consolidated Statements of Changes in Stockholders’ Equity.
ASC 842 was effective on January 1, 2019. A modified retrospective transition approach is required, applying the new standard to all leases existing at the date of initial application. The Company chose to use the effective date approach. As such, all periods presented after January 1, 2019 are under ASC 842 whereas periods presented prior to January 1, 2019 are in accordance with prior lease accounting of ASC 840. Financial information was not updated and the disclosures required under ASC 842 was not provided for dates and periods before January 1, 2019.
ASC 842 provides a number of optional practical expedients in transition. The Company has elected the ‘package of practical expedients,’ which permits the Company not to reassess under the new standard the prior conclusions about lease identification, lease classification and initial direct costs. The Company also elected the use of the hindsight, a practical expedient which permits the use of information available after lease inception to determine the lease term via the knowledge of renewal options exercised not available as of the leases inception. The practical expedient pertaining to land easements is not applicable to the Company.
ASC 842 also requires certain accounting elections for ongoing application of ASC 842. The Company elected the short-term lease recognition exemption for all leases that qualify, meaning those with terms under twelve months. ROU assets or lease liabilities are not to be recognized for short-term leases. However, since all real estate and equipment leases have terms greater than 12 months, no leases currently meet this exemption. The Company also elected the practical expedient to not separate lease and non-lease components for all leases, the majority of which consist of real estate common area maintenance expenses. However, since these non-lease items are subject to change, they are treated and disclosed as variable payments in the quantitative disclosures below. Consequently, ASC 842’s changed guidance on contract components will not significantly affect our financial reporting. Similarly, ASC 842’s narrowed definition of initial direct costs will not significantly affect financial reporting.
Lessee Leases
The majority of the Company’s lessee leases are operating leases, and consist of leased real estate for branches and operations centers. Options to extend and renew leases are generally exercised under normal circumstances. Advance notification is required prior to termination, and any noticing period is often limited to the months prior to renewal. Variable payments generally consist of common area maintenance and taxes. Rent escalations are generally specified by a payment schedule, or are subject to a defined formula. The Company also elected the practical expedient to not separate lease and non-lease components for all leases, the majority of which consist of real estate common area maintenance expenses. Generally, leases do not include guaranteed residual values, but instead typically specify that the leased premises are to be returned in satisfactory condition with the Company liable for damages. The Company also has other operating leases for various equipment, including copiers, printers, and other small equipment. Equipment lease terms and conditions generally specify a fixed amount and term with options to renew. The Company’s equipment leases are typically not renewed, and existing leases are typically assumed from prior bank acquisitions.
For operating leases, the lease liability and ROU asset (before adjustments) are recorded at the present value of future lease payments. ASC 842 requires the use of the lease interest rate; however, this rate is typically not known. As an alternative, ASC 842 permits the use of an entity’s fully secured incremental borrowing rate. The Company is electing to utilize the FHLB Atlanta Fixed Rate Advance index, as it is the most actively used institution-specific collateralized borrowing source available to the Company.
The Company also holds a small number of finance leases assumed in connection to prior acquisitions. These leases are all real estate leases. Terms and conditions are similar to those real estate operating leases described above, but the lease terms are generally longer. Lease classifications from the acquired institution were retained, and were again retained as a result of the election of the package of practical expedients described above.
47
CenterState Bank Corporation and Subsidiaries
NOTES TO CONDENSED CONSOLIDATED FINANCIAL STATEMENTS (unaudited)
(in thousands of dollars, except per share data)
| | Three-month period ended | | Six-month period ended |
| | June 30, 2019 | | June 30, 2019 |
Amortization of ROU Assets - Finance Leases | | $49 | | $87 |
Interest on Lease Liabilities - Finance Leases | | 54 | | 104 |
Operating Lease Cost (Cost resulting from lease payments) | | 2,009 | | 3,335 |
Short-term Lease Cost | | — | | — |
Variable Lease Cost (Cost excluded from lease payments) | | 349 | | 554 |
Sublease Income | | — | | — |
Total Lease Cost | | $2,461 | | $4,080 |
Finance Lease - Operating Cash Flows | | 76 | | 150 |
Finance Lease - Financing Cash Flows | | 73 | | 146 |
Operating Lease - Operating Cash Flows (Fixed Payments) | | 2,023 | | 3,304 |
Operating Lease - Operating Cash Flows (Liability Reduction) | | 1,706 | | 2,801 |
New ROU Assets - Operating Leases | | 15,060 | | 35,617 |
New ROU Assets - Finance Leases | | — | | — |
Weighted Average Lease Term (Years) - Finance Leases | | | | 11.36 |
Weighted Average Lease Term (Years) - Operating Leases | | | | 7.54 |
Weighted Average Discount Rate - Finance Leases | | | | 5.83% |
Weighted Average Discount Rate - Operating Leases | | | | 3.32% |
A maturity analysis of operating lease liabilities and reconciliation of the undiscounted cash flows to the total operating lease liabilities as of June 30, 2019 is as follows:
| | June 30, 2019 |
Operating lease payments due: | | |
Within one year | | $7,662 |
After one but within two years | | 6,593 |
After two but within three years | | 5,469 |
After three but within four years | | 4,225 |
After four years but within five years | | 3,524 |
After five years | | 12,619 |
Total undiscounted cash flows | | 40,092 |
Discount on cash flows | | (4,957) |
Total operating lease liabilities | | $35,136 |
48
CenterState Bank Corporation and Subsidiaries
NOTES TO CONDENSED CONSOLIDATED FINANCIAL STATEMENTS (unaudited)
(in thousands of dollars, except per share data)
The following is a schedule of future minimum annual rentals under operating leases as of December 31, 2018:
Year ending December 31, | | |
2018 | | $6,524 |
2019 | | 5,096 |
2020 | | 4,411 |
2021 | | 3,633 |
2022 | | 2,558 |
Thereafter | | 11,088 |
| | $33,310 |
Lessor Leases
ASC 842 also impacted lessor accounting. ASC 842 changed the criteria in which a lessor lease is classified. A lease is a sales-type lease if any one of five criteria are met, each of which indicate that the lease, in effect, transfers control of the underlying asset to the lessee. If none of those five criteria are met, but two additional criteria are both met, indicating that the lessor has transferred substantially all the risks and benefits of the underlying asset to the lessee and a third party, the lease is a direct financing lease. All leases that are not sales-type or direct financing leases are operating leases.
Similar to the above lessee leases, the Company has elected the ‘package of practical expedients,’ which allows the Company not to reassess the Company’s prior conclusions under ASC 842 about lease identification, lease classification and initial direct costs. The Company also elected the use of the hindsight, a practical expedient which permits the use of information available after lease inception to determine the lease term via the knowledge of renewal options exercised not available as of the leases inception. Lastly, the practical expedient pertaining to land easements is not applicable to the Company.
While ASC 842 identifies common area building maintenance as a non-lease component of our real estate lease contracts, the Company elected to account for the Company’s real estate leases and associated common area maintenance service components as a single, combined operating lease component. Consequently, ASC 842’s changed guidance on contract components will not significantly affect financial reporting.
Substantially, all of the Company’s lessor leases are related to unused real estate office space owned by the Company. Most have defined terms, though some leases have gone month-to-month once the initial term has passed. The impact of subleases is not material. Income from operating leases are reported within Occupancy Expense as an offset to Non-interest Expense in the Company’s Condensed Consolidated Statements of Income and Comprehensive Income.
49
CenterState Bank Corporation and Subsidiaries
NOTES TO CONDENSED CONSOLIDATED FINANCIAL STATEMENTS (unaudited)
(in thousands of dollars, except per share data)
The Company is also the lessor on a few equipment direct finance leases (formerly known as capital leases) with three municipal entities. Interest income from these leases are tax exempt, and is reported within loan interest income. The lessee retains the title to all equipment in each of these finance leases. Each of these leases originated in 2018, and therefore the prior ASC 840 classification was not reassessed due to the election of the package of practical expedients.
| | Three-month period ended | | Six-month period ended |
| | June 30, 2019 | | June 30, 2019 |
Operating Lease Income from Lease Payments | | $595 | | $785 |
Direct Financing Lease Income | | 128 | | 301 |
Direct Financing Profit Recognized at Commencement Date | | — | | — |
Lease Income Related to Variable lease Payments | | | | |
not included in measurement of lease receivable | | — | | — |
Total Lease Income | | $723 | | $1,086 |
| | | | |
Net Investment in Direct Financing Leases | | 15,565 | | |
Unguaranteed Residual Assets | | — | | |
Deferred Selling Profit on Direct Financing Leases | | — | | |
| | | | |
Maturity Analysis of Operating Lease Receivables | | | | |
0 - 12 Months | | 2,056 | | |
13 - 24 Months | | 1,738 | | |
25 - 36 Months | | 2,238 | | |
37 - 48 Months | | 431 | | |
48 - 60 Months | | 61 | | |
Over 60 Months | | — | | |
| | | | |
Maturity Analysis of Finance Lease Receivables | | | | |
0 - 12 Months | | 1,392 | | |
13 - 24 Months | | 1,680 | | |
25 - 36 Months | | 1,524 | | |
37 - 48 Months | | 1,340 | | |
48 - 60 Months | | 1,339 | | |
Over 60 Months | | 12,366 | | |
NOTE 12: Recently Issued Accounting Standards
In June 2016, the FASB issued ASU No. 2016-13, “Measurement of Credit Losses on Financial Instruments.” This ASU significantly changes how entities will measure credit losses for most financial assets and certain other instruments that aren’t measured at fair value through net income. In issuing the standard, the FASB is responding to criticism that today’s guidance delays recognition of credit losses. The standard will replace today’s “incurred loss” approach with an “expected loss” model. The new model, referred to as the current expected credit loss (“CECL”) model, will apply to: (1) financial assets subject to credit losses and measured at amortized cost, and (2) certain off-balance sheet credit exposures. This includes, but is not limited to, loans, leases, held-to-maturity securities, loan commitments, and financial guarantees. The CECL model does not apply to available for sale (“AFS”) debt securities. For AFS debt securities with unrealized losses, entities will measure credit losses in a manner similar to what they do today, except that the losses will be recognized as allowances rather than reductions in the amortized cost of the securities. As a result, entities will recognize improvements to estimated credit losses immediately in earnings rather than as interest income over time, as they do today. The ASU also simplifies the accounting model for purchased credit-impaired debt securities and loans. ASU 2016-13 also expands the disclosure requirements regarding an entity’s assumptions, models, and methods for estimating the allowance for loan and lease losses. In addition, entities will need to disclose the amortized cost balance for each class of financial asset by credit quality indicator, disaggregated by the year of origination. ASU No. 2016-13 is effective for interim and annual reporting periods beginning after December 15, 2019; early adoption is permitted for interim and annual reporting periods beginning after December 15, 2018. Entities will apply the standard’s provisions as a cumulative-effect adjustment to retained earnings as of the beginning of the first reporting period in which the guidance is effective (i.e., modified retrospective approach). The Company formed a CECL committee to assist with the implementation process. It has selected a third-party vendor to assist with the allowance for loan loss methodology as well as advisory services related to the implementation of the amendments of ASU 2016-13. The Company continues to work with the third-party vendor to evaluate the impact to the Company’s Consolidated Financial Statements including evaluating the impact from the loans acquired from the recent acquisitions. The standard will add new disclosures related to factors that
50
CenterState Bank Corporation and Subsidiaries
NOTES TO CONDENSED CONSOLIDATED FINANCIAL STATEMENTS (unaudited)
(in thousands of dollars, except per share data)
influenced management’s estimate, including current expected credit losses, the changes in those factors, and reasons for the changes as well as the method applied to revert to historical credit loss experience. The Company expects to recognize a one-time cumulative effect adjustment to the allowance for loan losses as of the beginning of the first reporting period in which the new standard is effective, but has not yet determined the magnitude of any such one-time adjustment or the overall impact on the Company’s Financial Statements.
In January 2017, the FASB issued ASU No. 2017-04, “Simplifying the Test for Goodwill Impairment,” to simplify how an entity is required to test goodwill for impairment by eliminating Step 2 from the goodwill impairment test. Step 2 measures a goodwill impairment loss by comparing the implied fair value of a reporting unit’s goodwill with the carrying amount of that goodwill. In computing the implied fair value of goodwill under Step 2, an entity had to perform procedures to determine the fair value at the impairment testing date of its assets and liabilities (including unrecognized assets and liabilities) following the procedure that would be required in determining the fair value of assets acquired and liabilities assumed in a business combination. Instead, under the amendments in this update, an entity should perform its annual, or interim, goodwill impairment test by comparing the fair value of a reporting unit with its carrying amount. An entity should recognize an impairment charge for the amount by which the carrying amount exceeds the reporting unit’s fair value; however, the loss recognized should not exceed the total amount of goodwill allocated to that reporting unit. Additionally, an entity should consider income tax effects from any tax deductible goodwill on the carrying amount of the reporting unit when measuring the goodwill impairment loss, if applicable. FASB also eliminated the requirements for any reporting unit with a zero or negative carrying amount to perform a qualitative assessment and, if it fails that qualitative test, to perform Step 2 of the goodwill impairment test. Therefore, the same impairment assessment applies to all reporting units. An entity is required to disclose the amount of goodwill allocated to each reporting unit with a zero or negative carrying amount of net assets. An entity still has the option to perform the qualitative assessment for a reporting unit to determine if the quantitative impairment test is necessary. The amendments in this update become effective for annual periods and interim periods within those annual periods beginning after December 15, 2019. The Company is currently evaluating the impact of adopting the new guidance on the Consolidated Financial Statements, but it is not expected to have a material impact.
In August 2017, the FASB issued ASU 2017-12, “Derivatives and Hedging (Topic 815): Targeted Improvements to Accounting for Hedging Activities.” The amendments in this update more closely align the results of cash flow and fair value hedge accounting with risk management activities through changes to both the designation and measurement guidance for qualifying hedging relationships and the presentation of hedge results in the financial statements. The amendments address specific limitations in current GAAP by expanding hedge accounting for both nonfinancial and financial risk components and by refining the measurement of hedge results to better reflect an entity’s hedging strategies. Thus, the amendments will enable an entity to report more faithfully the economic results of hedging activities for certain fair value and cash flow hedges and will avoid mismatches in earnings by allowing for greater precision when measuring changes in fair value of the hedged item for certain fair value hedges. Additionally, by aligning the timing of recognition of hedge results with the earnings effect of the hedged item for cash flow and net investment hedges, and by including the earnings effect of the hedging instrument in the same income statement line item in which the earnings effect of the hedged item is presented, the results of an entity’s hedging program and the cost of executing that program will be more visible to users of financial statements. Overall, those amendments are an improvement because an entity’s financial statements will reflect more accurately and comprehensively the intent and outcome of its hedging strategies. The tabular disclosure related to effects on the income statement of fair value and cash flow hedges and the disclosure of cumulative basis adjustments for fair value hedges provide users with a more complete picture of the effect of hedge accounting on an entity’s income statement and balance sheet. When considered together, the amendments to presentation and disclosures are an improvement because they will provide users with more decision-useful information about the effect of an entity’s risk management activities on the financial statements. Additionally, the amendments in this Update should ease the operational burden of applying hedge accounting by allowing more time to prepare hedge documentation and, allowing effectiveness assessments to be performed on a qualitative basis after hedge inception. For public business entities, the amendments in this update become effective for fiscal years, and interim periods within those fiscal years, beginning after December 15, 2018. Early adoption is permitted, including adoption in an interim period. All transition requirements and elections should be applied to hedging relationships existing (that is, hedging relationships in which the hedging instrument has not expired, been sold, terminated, or exercised or the entity has not removed the designation of the hedging relationship) on the date of adoption. The effect of adoption should be reflected as of the beginning of the fiscal year of adoption (that is, the initial application date). For cash flow and net investment hedges existing at the date of adoption, an entity should apply a cumulative-effect adjustment related to eliminating the separate measurement of ineffectiveness to accumulated other comprehensive income with a corresponding adjustment to the opening balance of retained earnings as of the beginning of the fiscal year that an entity adopts the amendments in this Update. The amended presentation and disclosure guidance is required only prospectively. The Company adopted the new accounting guidance effective January 1, 2019, but it did not have a material impact on the Consolidated Financial Statements.
In June 2018, the FASB issued ASU No. 2018-07, “Compensation – Stock Compensation (Topic 718) - Improvements to Nonemployee Share-Based Payment Accounting,” to include share based payment transactions for acquiring goods and services from
51
CenterState Bank Corporation and Subsidiaries
NOTES TO CONDENSED CONSOLIDATED FINANCIAL STATEMENTS (unaudited)
(in thousands of dollars, except per share data)
nonemployees. An entity should apply the requirements of Topic 718 to nonemployee awards except for specific guidance on inputs to an option pricing model and the attribution of cost (that is, the period of time over which share-based payment awards vest and the pattern of cost recognition over that period). The amendments specify that Topic 718 applies to all share-based payment transactions in which a grantor acquires goods or services to be used or consumed in a grantor’s own operations by issuing share-based payment awards. The amendments also clarify that Topic 718 does not apply to share-based payments used to effectively provide (1) financing to the issuer or (2) awards granted in conjunction with selling goods or services to customers as part of a contract accounted for under Topic 606, Revenue from Contracts with Customers. The amendments in this update become effective for annual periods and interim periods within those annual periods beginning after December 15, 2018 but no earlier than an entity’s adoption date of Topic 606. The Company adopted the new accounting guidance effective January 1, 2019, but it did not have a material impact on the Consolidated Financial Statements.
In August 2018, the FASB issued ASU No. 2018-13, “Fair Value Measurement (Topic 820) - Changes to the Disclosure Requirements for Fair Value Measurement,” to modify the disclosure requirements on fair value measurements in Topic 820 based on the concepts in the Concepts Statement, including the consideration of costs and benefits. The following disclosure requirements were removed from Topic 820: (1) the amount of and reasons for transfers between Level 1 and Level 2 of the fair value hierarchy; (2) the policy for timing of transfers between levels; (3) the valuation processes for Level 3 fair value measurements; and (4) for nonpublic entities, the changes in unrealized gains and losses for the period included in earnings for recurring Level 3 fair value measurements held at the end of the reporting period. The following disclosure requirements were modified in Topic 820: (1) in lieu of a rollforward for Level 3 fair value measurements, a nonpublic entity is required to disclose transfers into and out of Level 3 of the fair value hierarchy and purchases and issues of Level 3 assets and liabilities; (2) for investments in certain entities that calculate net asset value, an entity is required to disclose the timing of liquidation of an investee’s assets and the date when restrictions from redemption might lapse only if the investee has communicated the timing to the entity or announced the timing publicly; and (3) the amendments clarify that the measurement uncertainty disclosure is to communicate information about the uncertainty in measurement as of the reporting date. The following disclosure requirements were added to Topic 820: (1) the changes in unrealized gains and losses for the period included in other comprehensive income for recurring Level 3 fair value measurements held at the end of the reporting period; (2) the range and weighted average of significant unobservable inputs used to develop Level 3 fair value measurements. For certain unobservable inputs, an entity may disclose other quantitative information (such as the median or arithmetic average) in lieu of the weighted average if the entity determines that other quantitative information would be a more reasonable and rational method to reflect the distribution of unobservable inputs used to develop Level 3 fair value measurements. The amendments in this update are effective for annual periods and interim periods within those annual periods beginning after December 15, 2019. The amendments on changes in unrealized gains and losses, the range and weighted average of significant unobservable inputs used to develop Level 3 fair value measurements, and the narrative description of measurement uncertainty should be applied prospectively for only the most recent interim or annual period presented in the initial fiscal year of adoption. All other amendments should be applied retrospectively to all periods presented upon their effective date. Early adoption is permitted upon issuance of this update. An entity is permitted to early adopt any removed or modified disclosures upon issuance of this update and delay adoption of the additional disclosures until their effective date. The Company is currently evaluating the impact of adopting the new guidance on the Consolidated Financial Statements, but it is not expected to have a material impact.
52
ITEM 2:MANAGEMENT’S DISCUSSION AND ANALYSIS OF FINANCIAL CONDITION AND RESULTS OF OPERATIONS
(All dollar amounts presented herein are in thousands, except per share data, or unless otherwise noted.)
Cautionary Note Regarding Any Forward-Looking Statements
Some of the statements made in this report are “forward-looking statements” within the meaning of the Securities Act of 1933 (the “Securities Act”) and the Securities Exchange Act of 1934 (the “Exchange Act”). Forward-looking statements include statements with respect to our beliefs, plans, objectives, goals, expectations, anticipations, assumptions, estimates, intentions and future performance and involve known and unknown risks, uncertainties and other factors, many of which may be beyond our control and which may cause the actual results, performance or achievements of the Company to be materially different from future results, performance or achievements expressed or implied by such forward-looking statements.
All forward-looking statements are subject to risks, uncertainties and other facts that may cause the actual results, performance or achievements of CenterState to differ materially from any results expressed or implied by such forward-looking statements. Such factors include, among others, the impact on failing to implement our business strategy, including our growth and acquisition strategy, including the merger with NCOM and its integration; the ability to successfully integrate our acquisitions, including that of NCOM; additional capital requirements due to our growth plans; the impact of an increase in our asset size to over $10 billion; the risks of changes in interest rates and the level and composition of deposits; loan demand, the credit and other risks in our loan portfolio and the values of loan collateral; the impact of us not being able to manage our risk; the impact on a loss of management or other experienced employees; the impact if we failed to maintain our culture and attract and retain skilled people; the risk of changes in technology and customer preferences; the impact of any material failure or breach in our infrastructure or the infrastructure of third parties on which we rely including as a result of cyber-attacks; or material regulatory liability in areas such as BSA or consumer protection; or other areas of legal or other liability as a result of law suits, other legal proceedings, or information-gathering requests, investigations and other proceedings by government and self-regulatory agencies, reputational risks from such failures or liabilities or other events; legislative and regulatory changes; general competitive, political, legal, economic and market conditions and developments; financial market conditions and the results of financing efforts; changes in commodity prices and interest rates; weather, natural disasters and other catastrophic events that may or may not be caused by climate change; and other factors discussed in our filings with the Securities and Exchange Commission under the Exchange Act.
All written or oral forward-looking statements that are made by or are attributable to us are expressly qualified in their entirety by this cautionary notice. Our forward-looking statements apply only as of the date of this report or the respective date of the document from which they are incorporated herein by reference. We have no obligation and do not undertake to update, revise or correct any of the forward-looking statements after the date of this report, or after the respective dates on which such statements otherwise are made, whether as a result of new information, future events or otherwise.
COMPARISON OF BALANCE SHEETS AT JUNE 30, 2019 AND DECEMBER 31, 2018
Overview
Our total assets increased approximately 38% from December 31, 2018 to June 30, 2019, to approximately $17.0 billion. Loan growth during the period, excluding the NCOM acquisition, was $44,407 and deposit growth was $248,017, or 5% annualized. Our loan to deposit ratio was 88.7% and 88.0% at June 30, 2019 and December 31, 2018, respectively.
Due to consolidated assets in excess of $10 billion, the Company is now subject to additional regulations and oversight that can affect our revenues and expenses. Such regulations and oversight include increased expectations with respect to risk management internal audit, and information security, enhanced stress testing as a component of liquidity and capital planning, transfer of examination over compliance with consumer and small business laws from the Office of the Comptroller of the Currency to the Consumer Financial Protection Bureau (“CFPB”), increased deposit insurance premium assessments based on a new scorecard issued by the FDIC, and no longer being exempt from the requirements of the Federal Reserve’s rules limiting certain interchange transaction fees for debit cards on institutions over $10 billion in assets. We expect to expend additional resources to comply with these and other additional applicable regulatory requirements. Increased deposit insurance assessments can result in increased expense related to our use of deposits as a funding source. Likewise, a reduction in the amount of interchange fees we receive for electronic debit interchange will reduce our revenues. Finally, a failure to meet prudential risk management and capital planning standards or compliance with consumer lending laws could, among other things, limit our ability to engage in expansionary activities or make dividend payments to our shareholders.
Federal funds sold and Federal Reserve Bank deposits
Federal funds sold and Federal Reserve Bank deposits were $437,386 at June 30, 2019 (approximately 3% of total assets) compared to $231,981 at December 31, 2018 (approximately 2% of total assets). We use our available for sale securities portfolio, as well as federal funds sold and Federal Reserve Bank deposits for liquidity management and for investment yields. These accounts, as a
53
group, will fluctuate as a function of loans outstanding, and to some degree the amount of correspondent bank deposits (i.e. federal funds purchased) outstanding.
Available for sale debt investments
Available for sale debt securities, consisting primarily of U.S. government sponsored enterprises and municipal tax exempt securities, were $1,792,757 at June 30, 2019 (approximately 11% of total assets) compared to $1,727,348 at December 31, 2018 (approximately 14% of total assets), an increase of $65,409, which was mainly attributable to a combination of securities sold of $108,465, paydowns received on MBSs of $125,824, net of securities acquired from the NCOM acquisition of $178,488, purchases of $77,063 and unrealized holding gain of $49,028 during current year. We use our available for sale debt securities portfolio, as well as federal funds sold and Federal Reserve Bank deposits for liquidity management and for investment yields. These accounts, as a group, will fluctuate as a function of loans outstanding as discussed above, under the caption “Federal funds sold and FRB deposits.” We classify the majority of our securities as “available for sale debt securities” to provide for greater flexibility to respond to changes in interest rates as well as future liquidity needs. Our available for sale debt securities are carried at fair value.
Trading securities
We also have a trading securities portfolio. Realized and unrealized gains and losses are included in trading securities revenue, a component of our non-interest income, in our Condensed Consolidated Statement of Income and Comprehensive Income. Securities purchased for this portfolio have primarily been various municipal securities. A list of the activity in this portfolio is summarized below.
| | Three-month periods ended | | Six-month periods ended |
| | June 30, 2019 | | June 30, 2018 | | June 30, 2019 | | June 30, 2018 |
Beginning balance | | $ — | | $428 | | 1,737 | | $6,777 |
Purchases | | 18,337 | | 140,239 | | 70,028 | | 187,179 |
Proceeds from sales | | (17,715) | | (138,841) | | (71,168) | | (192,130) |
Net realized gain on sales | | 15 | | 14 | | 40 | | 14 |
Net unrealized gains | | 14 | | 8 | | 14 | | 8 |
Ending balance | | $651 | | $1,848 | | $651 | | $1,848 |
Held to maturity debt investments
At June 30, 2019, we had $210,756 (unamortized cost basis) of securities with an estimated fair value of $214,631, resulting in a net unrecognized gain of $3,875, compared to $216,833 (unamortized cost basis) of securities with an estimated fair value of $212,179 and a net unrecognized loss of $4,654 at December 31, 2018. This portfolio generally holds longer term securities for the primary purpose of yield. This classification was chosen to minimize temporary effects on our tangible equity and tangible equity ratio due to increases and decreases in general market interest rates.
Loans held for sale
We also have a mortgage loans held for sale portfolio, whereby we originate single family home loans and sell those mortgages into the secondary market, servicing released. The Company accounts for these loans under the fair value option with changes in fair value recognized in current period earnings. At the date of funding of the loan, the funded amount of the loan, the relative derivative asset or liability of the associated interest rate lock commitment, less direct costs, becomes the initial recorded investment in the loan held for sale. Such amount approximates the fair value of the loan. Net gains from changes in estimated fair value of mortgage loans held for sale were $941 and $722 at June 30, 2019 and 2018, respectively. Gains and losses on the sale of mortgage loans held for sale and changes in fair value are included as a components of mortgage banking revenue which are reported in non-interest income in our Condensed Consolidated Statement of Income and Comprehensive Income.
54
The table below presents the activity in this portfolio for the periods indicated.
| | Three-month periods ended | | Six-month periods ended |
| | June 30, 2019 | | June 30, 2018 | | June 30, 2019 | | June 30, 2018 |
Beginning balance | | $49,474 | | $28,485 | | $40,399 | | $19,647 |
Effect from acquisitions | | 14,588 | | — | | 14,588 | | 6,124 |
Loans originated | | 257,383 | | 92,218 | | 392,135 | | 150,316 |
Proceeds from sales | | (233,962) | | (87,066) | | (363,619) | | (144,387) |
Net change in fair value | | 937 | | 359 | | 941 | | 722 |
Net realized gain on sales | | 6,688 | | 2,370 | | 10,664 | | 3,944 |
Ending balance | | $95,108 | | $36,366 | | $95,108 | | $36,366 |
Loans
Lending-related income is the most important component of our net interest income and is a major contributor to profitability. The loan portfolio is the largest component of earning assets, and it therefore generates the largest portion of revenues. The absolute volume of loans and the volume of loans as a percentage of earning assets is an important determinant of our net interest margin as loans are expected to produce higher yields than securities and other earning assets. Average loans during the six-month period ending June 30, 2019, were $10,063,778 or 80.4% of average earning assets, as compared to $6,909,861 or 77.4% of average earning assets, for the six-month period ending June 30, 2018. Total loans at June 30, 2019 and December 31, 2018 were $11,712,761 and $8,340,504, respectively. This represents a loan to total asset ratio of 68.8% and 67.6% and a loan to deposit ratio of 88.7% and 88.0%, at June 30, 2019 and December 31, 2018, respectively.
Non-PCI loans
At June 30, 2019, we have total non-PCI loans of $11,555,458. Total new loans originated during the six-month period ended June 30, 2019 approximated $1.3 billion, of which $870 million were funded at the time of origination. About 27% of funded loan origination was non-owner occupied commercial real estate (“CRE”); 16% owner occupied CRE, 23% single family residential, 16% commercial and industrial (“C&I”), 13% land, development & construction and 5% were all other. Approximately 23% of the funded loan production was floating rate, 25% was other variable rate and 52% was fixed rate. The weighted average tax equivalent interest rate on funded loans was approximately 5.16% during the six-month period. The loan origination pipeline is approximately $1.3 billion at June 30, 2019 compared to $683 million at December 31, 2018.
The graph below summarizes new loan originations and funded loan production, excluding acquired loans purchased pursuant to acquisitions, over the past nine quarters.
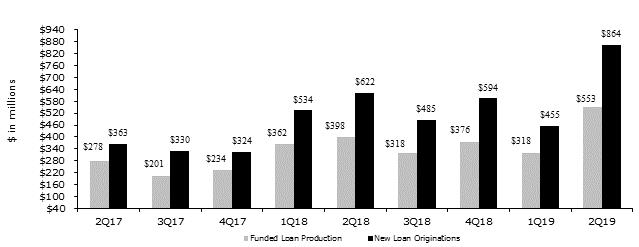
55
PCI loans
Total Purchased Credit Impaired (“PCI”) loans at June 30, 2019 were $157,303 compared to $158,971 at December 31, 2018.
Loan concentrations are considered to exist where there are amounts loaned to multiple borrowers engaged in similar activities, which collectively could be similarly impacted by economic or other conditions and when the total of such amounts would exceed 25% of total capital. Due to the lack of diversified industry and the relative proximity of markets served, the Company has concentrations in geographic as well as in types of loans funded.
Total loans at June 30, 2019 were $11,712,761. Of this amount, approximately 83.2% are collateralized by real estate, 14.6% are commercial non real estate loans and the remaining 2.1% are consumer and other non real estate loans. We have $2,536,324 of single family residential loans which represents about 21.7% of our total loan portfolio. Our largest category of loans is commercial real estate which represents approximately 52.5% of our total loan portfolio.
The following table sets forth information concerning the loan portfolio by collateral types as of the dates indicated.
| | June 30, 2019 | | December 31, 2018 |
Loans excluding PCI loans | | | | |
Real estate loans | | | | |
Residential | | $2,481,717 | | $1,702,114 |
Commercial | | 6,062,203 | | 4,454,098 |
Land, development and construction | | 1,051,307 | | 635,562 |
Total real estate | | 9,595,227 | | 6,791,774 |
Commercial, industrial and factored receivables | | 1,709,019 | | 1,183,380 |
Consumer and other loans | | 246,856 | | 203,686 |
Loans before unearned fees and deferred cost | | 11,551,102 | | 8,178,840 |
Net unearned fees and costs | | 4,356 | | 2,693 |
Total loans excluding PCI loans | | 11,555,458 | | 8,181,533 |
PCI loans (note 1) | | | | |
Real estate loans | | | | |
Residential | | 54,607 | | 58,804 |
Commercial | | 91,176 | | 87,336 |
Land, development and construction | | 6,225 | | 7,028 |
Total real estate | | 152,008 | | 153,168 |
Commercial and industrial | | 5,102 | | 5,594 |
Consumer and other loans | | 193 | | 209 |
Total PCI loans | | 157,303 | | 158,971 |
Total loans | | 11,712,761 | | 8,340,504 |
Allowance for loan losses for loans that are not PCI loans | | (40,455) | | (39,579) |
Allowance for loan losses for PCI loans | | (198) | | (191) |
Total loans, net of allowance for loan losses | | $11,672,108 | | $8,300,734 |
| note 1: | PCI loans are accounted for pursuant to ASC Topic 310-30. |
56
The table below summarizes the Company’s loan mix for the periods presented.
| | June 30, 2019 | | December 31, 2018 |
Originated Loans | | | | |
Real estate loans | | | | |
Residential | | $948,117 | | $807,372 |
Commercial | | 2,341,335 | | 2,058,039 |
Land, development and construction loans | | 411,615 | | 278,121 |
Total real estate loans | | 3,701,067 | | 3,143,532 |
Commercial, industrial loans and factored receivables | | 1,024,672 | | 811,605 |
Consumer and other loans | | 158,262 | | 150,826 |
Total loans before unearned fees and costs | | 4,884,001 | | 4,105,963 |
Unearned fees and costs | | 4,356 | | 2,693 |
Total originated loans | | 4,888,357 | | 4,108,656 |
| | | | |
Acquired Loans (1) | | | | |
Real estate loans | | | | |
Residential | | 1,533,600 | | 894,742 |
Commercial | | 3,720,868 | | 2,396,059 |
Land, development and construction loans | | 639,692 | | 357,441 |
Total real estate loans | | 5,894,160 | | 3,648,242 |
Commercial, industrial loans and factored receivables | | 684,347 | | 371,775 |
Consumer and other loans | | 88,594 | | 52,860 |
Total acquired loans | | 6,667,101 | | 4,072,877 |
| | | | |
PCI loans | | | | |
Real estate loans | | | | |
Residential | | 54,607 | | 58,804 |
Commercial | | 91,176 | | 87,336 |
Land, development and construction loans | | 6,225 | | 7,028 |
Total real estate loans | | 152,008 | | 153,168 |
Commercial and industrial loans | | 5,102 | | 5,594 |
Consumer and other loans | | 193 | | 209 |
Total PCI loans | | 157,303 | | 158,971 |
| | | | |
Total Loans | | $11,712,761 | | $8,340,504 |
| note 1: | Acquired loans include the non-PCI loans purchased pursuant to the following acquisitions: |
| • | Branch and loan transaction from TD Bank (year 2011); |
| • | Federal Trust Bank acquisition (year 2011); |
| • | Gulfstream Business Bank acquisition (year 2014); |
| • | First Southern Bank acquisition (year 2014); |
| • | Community Bank of South Florida acquisition (year 2016); |
| • | Hometown of Homestead Banking Company acquisition (year 2016); |
| • | Platinum Bank Holding Company (year 2017); |
| • | Gateway Financial Holdings of Florida, Inc. (year 2017); |
| • | Sunshine Bancorp, Inc. (year 2018); |
| • | HCBF Holding Company, Inc. (year 2018); |
| • | Charter Financial Corporation (year 2018); and |
| • | National Commerce Corporation (year 2019) |
57
Credit quality and allowance for loan losses
We maintain an allowance for loan losses that we believe is adequate to absorb probable losses incurred in our loan portfolio. The allowance is increased by the provision for loan losses, which is a charge to current period earnings and decreased by loan charge-offs net of recoveries of prior period loan charge-offs. Loans are charged against the allowance when management believes collection of the principal is unlikely.
The allowance consists of three components. The first component consists of amounts reserved for impaired loans, as defined by ASC 310. Impaired loans are those loans that management has estimated will not repay as agreed pursuant to the loan contract. Each of these loans is required to have a written analysis supporting the amount of specific reserve allocated to the particular loan, if any. That is to say, a loan may be impaired (i.e. not expected to repay as agreed), but may be sufficiently collateralized such that we expect to recover all principal and interest eventually, and therefore no specific reserve is warranted.
Commercial, commercial real estate, land, land development and construction loans in excess of $500 are monitored and evaluated for impairment on an individual loan basis. Commercial, commercial real estate, land, land development and construction loans less than $500 are evaluated for impairment on a pool basis. All consumer and single family residential loans are evaluated for impairment on a pool basis.
On at least a quarterly basis, management reviews each impaired loan to determine whether it should have a specific reserve or partial charge-off. Management relies on appraisals to help make this determination. Updated appraisals are obtained for collateral dependent loans when a loan is scheduled for renewal or refinance. In addition, if the classification of the loan is downgraded to substandard, identified as impaired, or placed on nonaccrual status (collectively “Problem Loans”), an updated appraisal is obtained if the loan amount is greater than $500 and individually evaluated for impairment.
After an updated appraisal is obtained for a Problem Loan, as described above, an additional updated appraisal will be obtained on at least an annual basis. Thus, current appraisals for Problem Loans in excess of $500 will not be older than one year.
After the initial updated appraisal is obtained for a Problem Loan and before its next annual appraisal update is due, management considers the need for a downward adjustment to the current appraisal amount to reflect current market conditions, based on management’s analysis, judgment and experience. In an extremely volatile market, we may update the appraisal prior to the one year anniversary date.
The second component is a general reserve on all of our loans other than those identified as impaired and is based on historical loss experience adjusted for current factors. The historical loss experience is determined by portfolio segment and is based on the actual loss history experienced over the most recent two years. This actual loss experience is supplemented with other economic factors based on the risks present for each portfolio segment. The portfolio segments identified by the Company are residential loans, commercial real estate loans, construction and land development loans, commercial and industrial and consumer and other. This actual loss experience is supplemented with other economic factors based on the risks present for each portfolio segment. These economic, or qualitative, factors include consideration of the following: levels of and trends in delinquencies and impaired loans; levels of and trends in charge-offs and recoveries; trends in volume and terms of loans; effects of any changes in risk selection and underwriting standards; other changes in lending policies, procedures, and practices; experience, ability, and depth of lending management and other relevant staff; national and local economic trends and conditions; industry conditions; levels and trends in special mention and substandard loans; and effects of changes in credit concentrations.
The third component consists of amounts reserved for purchased credit impaired loans. On a quarterly basis, we update the amount of loan principal and interest cash flows expected to be collected, incorporating assumptions regarding default rates, loss severities, the amounts and timing of prepayments and other factors that are reflective of current market conditions. Probable decreases in expected loan principal cash flows trigger the recognition of impairment, which is then measured as the present value of the expected principal loss plus any related foregone interest cash flows discounted at the pool’s effective interest rate. Impairments that occur after the acquisition date are recognized through the provision for loan losses. Probable and significant increases in expected principal cash flows would first reverse any previously recorded allowance for loan losses; any remaining increases are recognized prospectively as interest income. The impacts of (i) prepayments, (ii) changes in variable interest rates, and (iii) any other changes in the timing of expected cash flows are recognized prospectively as adjustments to interest income. Disposals of loans, which may include sales of loans, receipt of payments in full by the borrower, or foreclosure, result in removal of the loan from the purchased credit-impaired portfolio. The aggregate of these three components results in our total allowance for loan losses.
58
In the table below we have shown the components, as discussed above, of our allowance for loan losses at June 30, 2019 and December 31, 2018.
| June 30, 2019 | | December 31, 2018 | | increase (decrease) |
| Loan | | ALLL | | | | Loan | | ALLL | | | | Loan | | ALLL | | | |
| balance | | balance | | % | | balance | | balance | | % | | balance | | balance | | | |
Originated loans | $4,877,657 | | $36,311 | | 0.74% | | $4,096,828 | | $36,105 | | 0.88% | | $780,829 | | $206 | | (14) | bps |
Impaired originated loans | 10,700 | | 680 | | 6.36% | | 11,828 | | 878 | | 7.42% | | (1,127) | | (198) | | (106) | bps |
Total originated loans | 4,888,357 | | 36,991 | | 0.76% | | 4,108,656 | | 36,983 | | 0.90% | | 779,701 | | 8 | | (14) | bps |
| | | | | | | | | | | | | | | | | | |
Acquired loans (1) | 6,660,600 | | 2,296 | | 0.03% | | 4,069,005 | | 1,858 | | 0.05% | | 2,591,595 | | 438 | | (2) | bps |
Impaired acquired loans (2) | 6,501 | | 1,168 | | 17.97% | | 3,872 | | 738 | | 19.06% | | 2,629 | | 430 | | (109) | bps |
Total acquired loans | 6,667,101 | | 3,464 | | 0.05% | | 4,072,877 | | 2,596 | | 0.06% | | 2,594,224 | | 868 | | (1) | bps |
| | | | | | | | | | | | | | | | | | |
Total non-PCI loans | 11,555,458 | | 40,455 | | | | 8,181,533 | | 39,579 | | | | 3,373,925 | | 876 | | | |
PCI loans | 157,303 | | 198 | | | | 158,971 | | 191 | | | | (1,668) | | 7 | | | |
Total loans | $11,712,761 | | $40,653 | | | | $8,340,504 | | $39,770 | | | | $3,372,257 | | $883 | | | |
note 1:These are performing acquired loans that were recorded at estimated fair value on the related acquisition dates. The total net unamortized
fair value adjustment at June 30, 2019 was approximately $73,610 or 1.09% of the aggregate outstanding related loan balances. Acquired
loans currently include performing loans acquired from the TD Bank acquisition (year 2011), the Federal Trust Bank acquisition (year 2011), the Gulfstream Bank acquisition (year 2014), the First Southern Bank acquisition (year 2014), the Community Bank acquisition (year 2016), the 1st National Bank of South Florida acquisition (year 2016), the Platinum Bank acquisition (year 2017), the Gateway Bank acquisition (year 2017), the Sunshine Bank acquisition (year 2018), the Harbor Community Bank acquisition (year 2018), the CharterBank acquisition (year 2018) and the National Bank of Commerce acquisition (year 2019).
note 2:These are loans that were acquired as performing loans that subsequently became impaired.
The general loan loss allowance relating to originated loans increased by $206. Net changes resulting from a mixture of decreases and increases in the Company’s various two-year historical loss factors and qualitative factors affected the net change in the general loan loss allowance.
The general loan loss allowance relating to acquired loans (non-impaired loans) increased by $438 due to an increase in loans outstanding of $2,591,595 resulting primarily from the NCOM acquisition.
The specific loan loss allowance (impaired loans) for both originated loans and acquired loans is the aggregate of the results of individual analyses prepared for each one of the impaired loans, excluding PCI loans. Total impaired loans at June 30, 2019 are equal to $17,201 ($10,700 originated impaired loans plus $6,501 acquired impaired loans).
The Company recorded partial charge offs in lieu of specific allowance for a number of the impaired loans. The Company’s impaired loans have been written down by $1,072 to $17,201 ($15,353 when the $1,848 specific allowance is considered) from their legal unpaid principal balance outstanding of $18,272. In the aggregate, total impaired loans have been written down to approximately 84% of their legal unpaid principal balance, and non-performing impaired loans have been written down to approximately 76% of their legal unpaid principal balance. Approximately $8,233 of the Company’s impaired loans, or 48% of total impaired loans, are accruing performing loans. This group of impaired loans is not included in the Company’s non-performing loans or non-performing assets categories.
PCI loans are accounted for pursuant to ASC Topic 310-30. PCI loan pools are evaluated for impairment each quarter. If a pool is impaired, an allowance for loan loss is recorded. PCI loans had a remaining unpaid principal balance of $228,434 and unamortized fair value adjustment of $71,131, which represents 31% of unpaid principal balance, at June 30, 2019.
The allowance is increased by the provision for loan losses, which is a charge to current period earnings and decreased by loan charge-offs net of recoveries of prior period loan charge-offs. Loans are charged against the allowance when management believes collection of the principal is unlikely. We believe our allowance for loan losses was adequate at June 30, 2019. However, we recognize that many factors can adversely impact various segments of the Company’s markets and customers, and therefore there is no assurance as to the amount of losses or probable losses which may develop in the future.
59
The tables below summarize the changes in allowance for loan losses during the periods presented.
| | Allowance for loan losses for loans that are not PCI loans | | Allowance for loan losses on PCI loans | | Total |
Three-month ended June 30, 2019 | | | | | | |
Balance at beginning of period | | $39,861 | | $191 | | $40,052 |
Loans charged-off | | (3,325) | | — | | (3,325) |
Recoveries of loans previously charged-off | | 1,134 | | — | | 1,134 |
Net charge-offs | | (2,191) | | — | | (2,191) |
Provision for loan losses | | 2,785 | | 7 | | 2,792 |
Balance at end of period | | $40,455 | | $198 | | $40,653 |
| | | | | | |
Three-month ended June 30, 2018 | | | | | | |
Balance at beginning of period | | $34,154 | | $275 | | $34,429 |
Loans charged-off | | (589) | | — | | (589) |
Recoveries of loans previously charged-off | | 711 | | — | | 711 |
Net recoveries | | 122 | | — | | 122 |
Provision for loan losses | | 2,933 | | — | | 2,933 |
Balance at end of period | | $37,209 | | $275 | | $37,484 |
| | | | | | |
| | | | | | |
| | Allowance for loan losses for loans that are not PCI loans | | Allowance for loan losses on PCI loans | | Total |
Six-month ended June 30, 2019 | | | | | | |
Balance at beginning of period | | $39,579 | | $191 | | $39,770 |
Loans charged-off | | (4,772) | | — | | (4,772) |
Recoveries of loans previously charged-off | | 1,810 | | — | | 1,810 |
Net charge-offs | | (2,962) | | — | | (2,962) |
Provision for loan losses | | 3,838 | | 7 | | 3,845 |
Balance at end of period | | $40,455 | | 198 | | $40,653 |
| | | | | | |
Six-month ended June 30, 2018 | | | | | | |
Balance at beginning of period | | $32,530 | | $295 | | $32,825 |
Loans charged-off | | (992) | | — | | (992) |
Recoveries of loans previously charged-off | | 1,343 | | 75 | | 1,418 |
Net recoveries | | 351 | | 75 | | 426 |
Provision for loan losses | | 4,328 | | (95) | | 4,233 |
Balance at end of period | | $37,209 | | $275 | | $37,484 |
Nonperforming loans and nonperforming assets
Non-performing loans exclude PCI loans and are defined as non-accrual loans plus loans past due 90 days or more and still accruing interest. Generally, we place loans on non-accrual status when they are past due 90 days and management believes the borrower’s financial condition, after giving consideration to economic conditions and collection efforts, is such that collection of interest is doubtful. When we place a loan on non-accrual status, interest accruals cease and uncollected interest is reversed and charged against current income. Interest received on such loans is accounted for on the cash-basis or cost-recovery method, until qualifying for return to accrual. Loans are returned to accrual status when all the principal and interest amounts contractually due are brought current and future payments are reasonably assured. Non-performing loans, as defined above, as a percentage of total non-PCI loans, were 0.23% at June 30, 2019, compared to 0.29% at December 31, 2018.
Non-performing assets (which we define as non-performing loans, as defined above, plus (a) OREO (i.e., real estate acquired through foreclosure, in substance foreclosure, or deed in lieu of foreclosure); and (b) other repossessed assets that are not real estate), were $32,451 at June 30, 2019, compared to $26,826 at December 31, 2018. Non-performing assets as a percentage of total assets were 0.19% at June 30, 2019, compared to 0.22% at December 31, 2018. The table below summarizes selected credit quality data at the dates indicated.
60
The table below summarizes selected credit quality data at the dates indicated.
| | June 30, 2019 | | December 31, 2018 |
Non-accrual loans (note 1) | | $26,334 | | $23,567 |
Accruing loans 90 days or more past due (note 1) | | — | | — |
Total non-performing loans ("NPLs") (note 1) | | 26,334 | | 23,567 |
Other real estate owned ("OREO") | | 5,881 | | 2,909 |
Repossessed assets other than real estate ("ORAs") (note 1) | | 236 | | 350 |
Total NPAs | | $32,451 | | $26,826 |
| | | | |
NPLs as percentage of total loans (note 1) | | 0.23% | | 0.29% |
NPAs as percentage of total assets | | 0.19% | | 0.22% |
NPAs as percentage of loans and OREO and ORAs (note 1) | | 0.28% | | 0.33% |
30-89 days past due accruing loans as percentage of total loans (note 1) | | 0.44% | | 0.45% |
Allowance for loan losses as percentage of NPLs (note 1) | | 154% | | 168% |
| note 1: | Excludes PCI loans. |
As shown in the table above, the largest component of non-performing loans is non-accrual loans. As of June 30, 2019, the Company had non-accrual loans with an aggregate book value of $26,334 compared to December 31, 2018 when an aggregate book value of $23,567 was reported. Non-accrual loans increased by $2,767, however, the NPLs as percentage of total loans decreased by 6 bps compared to December 31, 2018.
The second largest component of non-performing assets after non-accrual loans is OREO. At June 30, 2019, total OREO was $5,881 compared to $2,909 at December 31, 2018. OREO is carried at the lower of cost or market less the estimated cost to sell. Further declines in real estate values can affect the market value of these assets. Any further decline in market value beyond its cost basis is recorded as a current expense in the Company’s Condensed Consolidated Statement of Income and Comprehensive Income.
Impaired loans are defined as loans that management has determined will not repay as agreed pursuant to the terms of the related loan agreement. Small balance homogeneous loans are not considered for impairment purposes. Once management has determined a loan is impaired, we perform a specific reserve analysis to determine if it is probable that we will eventually collect all contractual cash flows. If management determines that a shortfall is probable, then a specific valuation allowance is placed against the loan. This loan is then placed on non-accrual basis, even if the borrower is current with his/her contractual payments, and will remain on non-accrual until payments collected reduce the loan balance such that it eliminates the specific valuation allowance or equivalent partial charge-down or other economic conditions change. At June 30, 2019, we identified a total of $17,201 in impaired loans, excluding PCI loans. A specific valuation allowance of $1,848 has been attached to $7,234 of impaired loans included in the total $17,201 of identified impaired loans. It should also be noted that the total carrying balance of the impaired loans, or $17,201, has been partially charged down by $1,071 from their aggregate legal unpaid balance of $18,272.
The table below summarizes impaired loan data for the periods presented.
| | June 30, 2019 | | December 31, 2018 |
Impaired loans with a specific valuation allowance | | $7,234 | | $5,731 |
Impaired loans without a specific valuation allowance | | 9,967 | | 9,969 |
Total impaired loans | | $17,201 | | $15,700 |
| | | | |
Performing TDRs (these are not included in NPLs) | | $8,683 | | $8,475 |
Non performing TDRs (these are included in NPLs) | | 1,437 | | 1,002 |
Total TDRs | | 10,120 | | 9,477 |
Impaired loans that are not TDRs | | 7,081 | | 6,223 |
Total impaired loans | | $17,201 | | $15,700 |
Bank premises and equipment
Bank premises and equipment was $289,892 at June 30, 2019 compared to $227,454 at December 31, 2018, an increase of $62,438 or 27.5%, primarily due to the NCOM acquisition in April 2019. Effective January 1, 2019, the Company adopted ASU 842 resulting in the reclassification of $1,353 of branch real estate to ROU Lease Assets as reported on the Company’s Condensed Consolidated Balance Sheet.
61
A summary of our bank premises and equipment for the period end indicated is presented in the table below.
| | June 30, 2019 | | December 31, 2018 |
Land | | $90,098 | | $72,487 |
Land improvements | | 1,455 | | 1,381 |
Buildings | | 169,572 | | 130,424 |
Leasehold improvements | | 18,572 | | 13,655 |
Furniture, fixtures and equipment | | 60,676 | | 45,056 |
Construction in progress | | 8,476 | | 15,491 |
Subtotal | | 348,849 | | 278,494 |
Less: accumulated depreciation | | 58,957 | | 51,040 |
Total | | $289,892 | | $227,454 |
We transfer branch real estate that is no longer in use to held for sale at estimated fair value less estimated cost to sell. We transferred $6,450, before impairment charges, of branch real estate to held for sale during the six-month period ending June 30, 2019. Our branch real estate held for sale at June 30, 2019 and December 31, 2018 were $31,679 and $25,080, respectively, a net increase of $6,599. The net increase is primarily due to transfers of bank properties acquired from NCOM of $12,436 and transfers of $4,343, net of impairment charges, of branch real estate, which were offset by net proceeds of $11,889 received on 11 properties held for sale sold during the six-month period ending June 30, 2019.
Leases
In February 2016, the FASB established Topic 842, Leases, by issuing Accounting Standards Update (ASU) No. 2016-02, which requires lessees to recognize leases on the balance sheet and disclose key information about leasing arrangements. Subsequently, amendments ASU No. 2018-01, Land Easement Practical Expedient for Transition to Topic 842; ASU No. 2018-10, Codification Improvements to Topic 842, Leases; and ASU No. 2018-11, Targeted Improvements were issued. ASC 842 was effective on January 1, 2019, with a required modified retrospective transition approach by applying ASC 842 to all leases existing at the date of initial application.
ASC 842 establishes a right-of-use (“ROU”) model that requires a lessee to recognize a ROU asset and lease liability on the balance sheet for all leases with a term longer than 12 months. The most significant effects related to the recognition of new ROU assets and lease liabilities on the Company’s balance sheet for our real estate operating leases and, to a much lesser extent, various equipment operating leases. The Company leases certain properties and equipment under operating leases that resulted in the recognition of ROU lease assets of approximately $20.3 million and lease liabilities of approximately $22.8 million on the Company’s Condensed Consolidated Balance Sheets. The one-time transition impact to retained earnings from measurement differences was approximately $1.1 million as disclosed on the Company’s Condensed Consolidated Statements of Changes in Stockholders’ Equity. The Company does not expect a significant change in future leasing activities as a result of ASC 842. In addition, the Company does not expect equipment leasing to become a significant source of revenue for the Company.
Interest Rate Swap Derivatives
The Company enters into interest rate swaps in order to provide commercial loan clients the ability to swap from variable to fixed interest rates. Under these agreements, the Company enters into a variable rate loan with a client in addition to a swap agreement. This swap agreement effectively converts the client’s variable rate loan into a fixed rate. The Company then enters into a matching swap agreement with a third party dealer in order to offset its exposure on the customer swap. The fair value of interest rate swap derivatives (asset component) was $229,735 at June 30, 2019 compared to $92,475 at December 31, 2018. Out of the total fair value of interest rate swap derivatives (liability component) of $231,735, the fair value of interest swap derivatives on commercial loans was $231,325 at June 30, 2019 compared to $92,892 at December 31, 2018.
During the current quarter, the Company entered into an interest rate swap contract on a variable rate borrowing to manage interest rate risk associated with the borrowing. Under the agreement, the Company borrowed a variable rate note from Federal Home Loan Bank and entered into a matching swap agreement with a counterparty in order to offset its exposure on the variable rate borrowing. The Company negotiated specific agreement of terms with the counterparty, including the amount, the interest rate, and the maturity. The Company is exposed to credit-related losses in the event of nonperformance by the counterparty to the agreement. The Company controls the credit risk through monitoring procedures and does not expect the counterparty to fail its obligations. The Company only deals with primary dealers and believes that the credit risk inherent in this contract was not significant during the current quarter. Out of the total fair value of interest rate swap derivatives (liability component) of $231,735, the fair value of the fair value of interest rate swap derivatives on a variable rate borrowing (liability component) was $410 at June 30, 2019.
62
Deposits
Total deposits were $13,212,085 at June 30, 2019 compared to $9,477,336 at December 31, 2018. The total deposits, excluding NCOM acquisition, increased $248,017, or approximately 5% on an annualized basis. The cost of interest bearing deposits in the current quarter was 1.01%, compared to 0.84% in the previous quarter. The overall cost of total deposits (i.e. includes non-interest bearing checking accounts) in the current quarter was 0.70% compared to 0.57% in the previous quarter. The table below summarizes the Company’s deposit mix for the periods presented.
| | | | % of | | | | % of |
| | June 30, 2019 | | total | | December 31, 2018 | | total |
Demand - non-interest bearing | | $3,990,883 | | 30% | | $2,923,640 | | 31% |
Demand - interest bearing | | 2,493,870 | | 19% | | 1,811,006 | | 19% |
Money market accounts | | 3,569,025 | | 27% | | 2,216,571 | | 23% |
Savings deposits | | 725,124 | | 6% | | 704,159 | | 8% |
Time deposits | | 2,433,183 | | 18% | | 1,821,960 | | 19% |
Total deposits | | $13,212,085 | | 100% | | $9,477,336 | | 100% |
Securities sold under agreement to repurchase
Our Bank enters into borrowing arrangements with our retail business customers by agreements to repurchase (“securities sold under agreements to repurchase”) under which the Bank pledges investment securities owned and under their control as collateral against these one-day borrowing arrangement. These short-term borrowings totaled $78,277 at June 30, 2019 compared to $57,772 at December 31, 2018.
Federal funds purchased
Federal funds purchased are overnight deposits including deposits from correspondent banks. At June 30, 2019 we had $276,963 of overnight correspondent bank deposits, compared to $244,360 in overnight correspondent bank deposits and $50,000 in other overnight federal funds purchased at December 31, 2018.
Federal Home Loan Bank advances and other borrowed funds
From time to time, we borrow either through Federal Home Loan Bank (“FHLB”) advances or other borrowings. We had $150,000 in FHLB advances and $49,727 in subordinated notes (assumed from the Sunshine transaction closed on January 1, 2018 and from the NCOM transaction on April 1, 2019) at June 30, 2019. At December 31, 2018, the Company had $350,000 in FHLB advances and $11,000 in subordinated notes.
Corporate debentures
Below is a schedule of statutory trust entities and the related corporate debentures formed and assumed through various acquisitions. We assumed $8,000 in corporate debentures pursuant to the acquisition of Harbor on January 1, 2018 and $9,000 in corporate debentures pursuant to the acquisition of Charter on September 1, 2018. The $9,000 corporate debentures assumed from the Charter acquisition were subsequently redeemed in December 2018 at par value with no gains or losses realized on the extinguishments of debt.
| | Amount | | Interest Rate | | Maturity |
CenterState Banks of Florida Statutory Trust I | | $10,000 | | LIBOR + 3.05% | | Sep. 2033 |
Valrico Capital Statutory Trust | | $2,500 | | LIBOR + 2.70% | | Sep. 2034 |
Federal Trust Statutory Trust I | | $5,000 | | LIBOR + 2.95% | | Sep. 2033 |
Gulfstream Bancshares Capital Trust II | | $3,000 | | LIBOR + 1.70% | | Mar. 2037 |
Homestead Statutory Trust I | | $10,000 | | LIBOR + 1.65% | | Jul. 2036 |
BSA Financial Statutory Trust I | | $5,000 | | LIBOR + 1.55% | | Dec. 2035 |
MRCB Statutory Trust II | | $3,000 | | LIBOR + 1.60% | | Sep. 2036 |
63
Total equity
The total equity at June 30, 2019, was $2,890,512, or 17.0% of total assets, compared to $1,971,344, or 16.0% of total assets at December 31, 2018. The increase in total equity was due to the following items:
Total stockholders' equity at December 31, 2018 | | $1,971,344 |
Net income during the period | | 99,765 |
Cumulative adjustment pursuant to adoption of ASU 842 | | (1,093) |
Dividends paid on common shares ($0.22 per share) | | (24,742) |
Net increase in market value of securities available for sale, net of deferred taxes | | 36,601 |
Net decrease in market value of interest rate swap, net of deferred taxes | | (306) |
Stock options exercised | | 2,257 |
Equity based compensation | | 2,504 |
Stock repurchase (1,697,411 shares, average price of $22.99 per share) | | (39,030) |
Stock issued pursuant to acquisition of NCOM | | 825,444 |
Stock options acquired and converted pursuant to NCOM acquisition | | 6,232 |
Noncontrolling interest from NCOM acquisition | | 12,002 |
Distributions paid to noncontrolling interest | | (466) |
Total equity at June 30, 2019 | | $2,890,512 |
The Company and the Bank are subject to various regulatory capital requirements administered by the federal banking agencies. Under capital adequacy guidelines and the regulatory framework for prompt corrective action, the Company and the Bank must meet specific capital guidelines that involve quantitative measures of assets, liabilities and certain off-balance-sheet items as calculated under regulatory accounting practices. The capital amounts and classification are also subject to qualitative judgments by the regulators about components, risk weightings and other factors. Failure to meet minimum capital requirements can initiate certain mandatory and possibly additional discretionary actions by regulators that, if undertaken, could have a direct material effect on the Company’s consolidated financial statements. A banking organization needs to maintain a Common Equity Tier 1 (“CET1”) capital ratio of at least 7%, a total Tier 1 capital ratio of at least 8.5% and a total risk-based capital ratio of at least 10.5%. The net unrealized gain or loss on available for sale debt securities is not included in computing regulatory capital.
Quantitative measures established by regulation to ensure capital adequacy require the Company and the Bank to maintain minimum amounts and ratios (set forth in the table below) of total capital, Tier I capital and CET1 (as defined in the regulations) to risk-weighted assets. Management believes, as of June 30, 2019, that the Company and the Bank meet all capital adequacy requirements to which they are subject.
Selected consolidated capital ratios at June 30, 2019 and December 31, 2018 for the Company and the Bank are presented in the tables below. The ratios for capital adequacy purposes do not include capital conservation buffer requirements.
CenterState Bank Corporation (the Company) | | Actual | | Capital Adequacy | | Excess |
| | Amount | | Ratio | | Amount | | Ratio | | Amount |
June 30, 2019 | | | | | | | | | | |
Total capital (to risk weighted assets) | | $1,650,765 | | 12.6% | | $1,046,676 | | >8.0% | | $604,089 |
Tier 1 capital (to risk weighted assets) | | 1,533,612 | | 11.7% | | 785,007 | | >6.0% | | 748,605 |
Common equity Tier 1 capital (to risk weighted assets) | | 1,533,612 | | 11.7% | | 588,755 | | >4.5% | | 944,857 |
Tier 1 capital (to average assets) | | 1,533,612 | | 9.9% | | 617,368 | | >4.0% | | 916,244 |
| | | | | | | | | | |
December 31, 2018 | | | | | | | | | | |
Total capital (to risk weighted assets) | | $1,183,229 | | 12.7% | | $745,543 | | >8.0% | | $437,686 |
Tier 1 capital (to risk weighted assets) | | 1,143,459 | | 12.3% | | 559,157 | | >6.0% | | 584,302 |
Common equity Tier 1 capital (to risk weighted assets) | | 1,104,959 | | 11.9% | | 419,368 | | >4.5% | | 685,591 |
Tier 1 capital (to average assets) | | 1,143,459 | | 10.0% | | 455,561 | | >4.0% | | 687,898 |
| | | | | | | | | | |
CenterState Bank, N.A. | | Actual | | Well Capitalized | | Excess |
| | Amount | | Ratio | | Amount | | Ratio | | Amount |
June 30, 2019 | | | | | | | | | | |
Total capital (to risk weighted assets) | | $1,633,608 | | 12.5% | | $1,307,742 | | >10.0% | | $325,866 |
Tier 1 capital (to risk weighted assets) | | 1,592,957 | | 12.2% | | 1,046,193 | | >8.0% | | 546,764 |
Common equity Tier 1 capital (to risk weighted assets) | | 1,592,957 | | 12.2% | | 850,032 | | >6.5% | | 742,925 |
Tier 1 capital (to average assets) | | 1,592,957 | | 10.3% | | 771,592 | | >5.0% | | 821,365 |
| | | | | | | | | | |
December 31, 2018 | | | | | | | | | | |
Total capital (to risk weighted assets) | | $1,177,082 | | 12.6% | | $931,254 | | >10.0% | | $245,828 |
Tier 1 capital (to risk weighted assets) | | 1,137,315 | | 12.2% | | 745,003 | | >8.0% | | 392,312 |
Common equity Tier 1 capital (to risk weighted assets) | | 1,137,315 | | 12.2% | | 605,315 | | >6.5% | | 532,000 |
Tier 1 capital (to average assets) | | 1,137,315 | | 10.0% | | 569,394 | | >5.0% | | 567,921 |
64
COMPARISON OF RESULTS OF OPERATIONS FOR THE THREE-MONTH PERIODS ENDED JUNE 30, 2019 AND 2018
Overview
We recognized net income of $55,122 and net income attributable to CenterState Bank Corporation of $54,523 or $0.42 per share basic and diluted for the three-month period ended June 30, 2019, compared to net income and net income attributable to CenterState Bank Corporation of $32,163 or $0.38 per share basic and diluted for the same period in 2018. A summary of the differences are listed in the table below.
| | Jun. 30, | | Jun. 30, | | increase |
Three month period ending | | 2019 | | 2018 | | (decrease) |
Net interest income | | $158,681 | | $100,529 | | $58,152 |
Provision for loan losses | | 2,792 | | 2,933 | | (141) |
Net interest income after loan loss provision | | 155,889 | | 97,596 | | 58,293 |
| | | | | | |
Correspondent banking and capital markets division | | 11,534 | | 7,076 | | 4,458 |
Loss on sale of available for sale securities | | (5) | | — | | (5) |
All other non-interest income | | 26,414 | | 15,513 | | 10,901 |
Total non-interest income | | 37,943 | | 22,589 | | 15,354 |
| | | | | | |
Merger related expenses | | 15,739 | | 14,140 | | 1,599 |
All other non-interest expense | | 106,250 | | 65,472 | | 40,778 |
Total non-interest expense | | 121,989 | | 79,612 | | 42,377 |
| | | | | | |
Net income before provision for income taxes | | 71,843 | | 40,573 | | 31,270 |
Provision for income taxes | | 16,721 | | 8,410 | | 8,311 |
Net income | | 55,122 | | 32,163 | | 22,959 |
Earnings attributable to noncontrolling interest | | 599 | | — | | 599 |
Net income attributable to CenterState Bank Corporation | | $54,523 | | $32,163 | | $22,360 |
The increase in our net interest income relates primarily to the increase in our average interest earning assets as a result of loan growth and the acquisition of NCOM in April 2019. The increase in our “all other non-interest expense,” which represents the operating expenses of our commercial/retail banking segment, is primarily due to growth from the acquisition of NCOM. These items along with others are discussed and analyzed below.
Our strategy is to grow organically and by acquisition in the southeastern region. In pursuing this strategy, we seek lending teams and companies that are culturally similar to us, that are experienced and are located in our markets or in markets close to us so we can achieve economies of scale. During 2016, we established a new mortgage line of business led by an experienced mortgage lending team, and an SBA business and intend to grow those business lines in our markets, thus increasing our non-interest income. In September 2018, we hired a team of mortgage professionals from State Bank and acquired State Bank’s mortgage loan pipeline. Mortgage banking revenue and SBA revenue combined increased $4,412 during the current quarter compared to the same period in 2018.
Net interest income/margin
Net interest income increased $58,152 or 57.8% to $158,681 during the three-month period ended June 30, 2019 compared to $100,529 for the same period in 2018. The $58,152 increase was the result of a $74,624 increase in interest income offset by $16,472 increase in interest expense.
Interest earning assets averaged $14,357,716 during the three-month period ended June 30, 2019 as compared to $8,998,388 for the same period in 2018, an increase of 59.6%, or $5,359,328. The yield on average interest earning assets increased 25 bps to 5.18% (23 bps to 5.19% tax equivalent basis) during the three-month period ended June 30, 2019, compared to 4.93% (4.96% tax equivalent basis) for the same period in 2018. The combined effects of the $5,359,328 increase in average interest earning assets and the 25 bps (23 bps tax equivalent basis) increase in yield on average interest earning assets resulted in the $74,624 ($74,462 tax equivalent basis) increase in interest income between the two periods.
Interest bearing liabilities averaged $9,609,269 during the three-month period ended June 30, 2019 as compared to $5,872,943 for the same period in 2018, an increase of $3,736,326 or 63.6%. The cost of average interest bearing liabilities was 1.11% during the three-month period ended June 30, 2019, compared to 0.69% for the same period in 2018. The effect of the $3,736,326 increase in average interest bearing liabilities and the 42 bps increase in cost of funds resulted in the $16,472 increase in interest expense between the two periods.
65
The table below summarizes the analysis of changes in interest income and interest expense for the three-month periods ended June 30, 2019 and 2018 on a tax equivalent basis.
| Three months ended June 30, |
| 2019 | | 2018 |
| Average | | Interest | | Average | | Average | | Interest | | Average |
| Balance | | inc / exp | | rate | | balance | | inc / exp | | rate |
Originated loans, excluding PCI (notes 1, 2 and 8) | $4,780,171 | | $61,385 | | 5.15% | | $3,326,798 | | $38,197 | | 4.61% |
Acquired loans, excluding PCI (notes 1, 8 and 9) | 6,804,481 | | 98,826 | | 5.83% | | 3,471,012 | | 48,720 | | 5.63% |
PCI loans (note 10) | 161,141 | | 7,750 | | 19.29% | | 183,452 | | 11,096 | | 24.26% |
Securities- taxable | 1,773,349 | | 12,740 | | 2.88% | | 1,552,550 | | 10,325 | | 2.67% |
Securities- tax exempt (note 8) | 219,817 | | 1,923 | | 3.51% | | 205,042 | | 1,845 | | 3.61% |
Fed funds sold and other (note 3) | 618,757 | | 3,124 | | 2.03% | | 259,534 | | 1,103 | | 1.70% |
Total interest earning assets | 14,357,716 | | 185,748 | | 5.19% | | 8,998,388 | | 111,286 | | 4.96% |
| | | | | | | | | | | |
Allowance for loan losses | (39,021) | | | | | | (34,518) | | | | |
All other assets | 2,445,030 | | | | | | 1,403,545 | | | | |
Total assets | $16,763,725 | | | | | | $10,367,415 | | | | |
| | | | | | | | | | | |
Interest bearing deposits (note 4) | $9,126,275 | | $23,036 | | 1.01% | | $5,247,246 | | $6,668 | | 0.51% |
Fed funds purchased | 290,281 | | 1,835 | | 2.54% | | 268,431 | | 1,300 | | 1.94% |
Other borrowings (note 5) | 160,167 | | 1,144 | | 2.86% | | 325,067 | | 1,609 | | 1.99% |
Corporate debenture (note 11) | 32,546 | | 557 | | 6.86% | | 32,199 | | 523 | | 6.51% |
Total interest bearing liabilities | 9,609,269 | | 26,572 | | 1.11% | | 5,872,943 | | 10,100 | | 0.69% |
Demand deposits | 4,013,782 | | | | | | 2,861,583 | | | | |
Other liabilities | 264,430 | | | | | | 104,906 | | | | |
Total equity | 2,876,244 | | | | | | 1,527,983 | | | | |
Total liabilities and stockholders’ equity | $16,763,725 | | | | | | $10,367,415 | | | | |
Net interest spread (tax equivalent basis) (note 6) | | | | | 4.08% | | | | | | 4.27% |
Net interest income (tax equivalent basis) | | | $159,176 | | | | | | $101,186 | | |
Net interest margin (tax equivalent basis) (note 7) | | | | | 4.45% | | | | | | 4.51% |
| note 1: | Loan balances are net of deferred origination fees and costs. | |
| note 2: | Interest income on average loans includes amortization of loan fee recognition of $686 and $656 for the three-month periods ended June 30, 2019 and 2018. | |
| note 3: | Includes federal funds sold, interest earned on deposits at the Federal Reserve Bank and earnings on Federal Reserve Bank stock, Federal Home Loan Bank stock and other equity stocks. | |
| note 4: | Includes interest-bearing deposits only. Non-interest bearing checking accounts are included in the demand deposits listed below. Also, includes net amortization of fair market value adjustments related to various acquisitions of time deposits of ($1,476) and ($400) for the three-month periods ended June 30, 2019 and 2018. | |
| note 5: | Includes securities sold under agreements to repurchase, Federal Home Loan Bank advances and subordinated notes. | |
| note 6: | Represents the average rate earned on interest earning assets minus the average rate paid on interest bearing liabilities (Non-GAAP). | |
| note 7: | Represents net interest income divided by total interest earning assets (Non-GAAP). | |
| note 8: | Interest income and rates include the effects of a tax equivalent adjustment using applicable statutory tax rates to adjust tax-exempt interest income on tax-exempt investment securities and loans to a fully taxable basis (Non-GAAP). | |
note 9: Interest income on acquired loans, excluding PCI, includes amortization of loan discounts of $10,335 and $5,976.
| note 10: | PCI loans are accounted for pursuant to ASC 310-30. Interest income on PCI loans includes amortization of loan discounts of $5,248 and $8,546. | |
| note 11: | Includes amortization of fair value adjustments related to various acquisitions of corporate debentures of $87 and $87 for the three-month periods ended June 30, 2019 and 2018. | |
The primary reason for the decrease in our net interest margin (“NIM”) during the current period was due to an overall increase to the cost of interest bearing liabilities, offset by an overall increase of yield on interest earning assets between the two periods presented above. The increase in loan yields is due to originated loan productions at higher yields as well as the impact of loans acquired from Charter and NCOM.
Provision for loan losses
The provision for loan losses decreased $141 to $2,792 during the three-month period ending June 30, 2019 compared to a provision expense of $2,933 for the comparable period in 2018. Our policy is to maintain the allowance for loan losses at a level sufficient to absorb probable incurred losses in the loan portfolio. The allowance is increased by the provision for loan losses, which is a charge to current period earnings, and is decreased by charge-offs, net of recoveries on prior loan charge-offs. Therefore, the provision for loan losses (Income Statement effect) is a residual of management’s determination of allowance for loan losses (Balance
66
Sheet approach). In determining the adequacy of the allowance for loan losses, we consider the conditions of individual borrowers, the historical loan loss experience, the general economic environment, the overall portfolio composition, and other information. As these factors change, the level of loan loss provision changes. The decrease in our loan loss provision between the comparable periods is a result of an increase in non-impaired loan balances. See “Credit Quality and Allowance for Loan Losses” for additional information regarding the allowance for loan losses.
Non-interest income
Non-interest income for the three-month ended June 30, 2019 was $37,943 compared to $22,589 for the comparable period in 2018. A summary of the differences are listed in the table below.
| | Jun. 30, | | Jun. 30, | | $ increase | | % increase | |
Three-month periods ending: | | 2019 | | 2018 | | (decrease) | | (decrease) | |
Income from correspondent banking capital markets division (note 1) | | $10,362 | | $6,008 | | $4,354 | | 72.5 | % |
Other correspondent banking related revenue (note 2) | | 1,172 | | 1,068 | | 104 | | 9.7 | % |
Mortgage banking revenue | | 6,803 | | 2,616 | | 4,187 | | 160.1 | % |
SBA revenue | | 1,252 | | 1,027 | | 225 | | 21.9 | % |
Service charges on deposit accounts | | 7,507 | | 4,861 | | 2,646 | | 54.4 | % |
Debit, prepaid, ATM and merchant card related fees | | 6,376 | | 3,498 | | 2,878 | | 82.3 | % |
Bank owned life insurance income | | 2,070 | | 1,374 | | 696 | | 50.7 | % |
Wealth management related revenue | | 875 | | 640 | | 235 | | 36.7 | % |
Gain on sale of bank properties held for sale | | 461 | | 931 | | (470) | | (50.5) | % |
Other non-interest income | | 1,070 | | 566 | | 504 | | 89.0 | % |
Loss on sale of securities | | (5) | | — | | (5) | | NM | % |
Total non-interest income | | $37,943 | | $22,589 | | $15,354 | | 68.0 | % |
| note 1: | Includes gross commissions earned on bond sales, fees from hedging services, loan brokering fees and related consulting fees. The fee income in this category is based on sales volume in any particular period and is therefore volatile between comparable periods. | |
| note 2: | Includes fees from safekeeping activities, bond accounting services, asset/liability consulting services, international wires, clearing and corporate checking account services and other correspondent banking related revenue and fees. The fees included in this category are less volatile than those described above in note 1. | |
Mortgage banking revenue and income from correspondent banking capital markets division increased $4,187 and $4,354, respectively, during the current quarter compared to the same period in 2018. Other increases in non-interest income between the periods presented are mainly attributable to the acquisitions of Charter, which was completed in September 2018 and NCOM, which was completed in April 2019.
67
Non-interest expense
Non-interest expense for the three-month ended June 30, 2019 increased $42,377, or 53.2%, to $121,989, compared to $79,612 for the same period in 2018. Components of our non-interest expenses are listed in the table below.
| | Jun. 30, | | Jun. 30, | | $ increase | | % increase | |
Three-month periods ending: | | 2019 | | 2018 | | (decrease) | | (decrease) | |
Salaries and wages | | $51,624 | | $30,888 | | $20,736 | | 67.1 | % |
Incentive/bonus compensation | | 8,247 | | 3,331 | | 4,916 | | 147.6 | % |
Stock based compensation | | 1,286 | | 1,009 | | 277 | | 27.5 | % |
Employer 401K matching contributions | | 1,574 | | 826 | | 748 | | 90.6 | % |
Deferred compensation expense | | 363 | | 147 | | 216 | | 146.9 | % |
Health insurance and other employee benefits | | 5,142 | | 3,256 | | 1,886 | | 57.9 | % |
Payroll taxes | | 3,436 | | 2,204 | | 1,232 | | 55.9 | % |
Other employee related expenses | | 1,004 | | 847 | | 157 | | 18.5 | % |
Incremental direct cost of loan origination | | (5,160) | | (1,825) | | (3,335) | | 182.7 | % |
Total salaries, wages and employee benefits | | 67,516 | | 40,683 | | 26,833 | | 66.0 | % |
| | | | | | | | | |
Gain on sale of OREO | | (63) | | (745) | | 682 | | (91.5) | % |
Valuation write down of OREO | | 57 | | 107 | | (50) | | (46.7) | % |
Gain on repossessed assets other than real estate | | (84) | | (6) | | (78) | | 1,300.0 | % |
Foreclosure and repossession related expenses | | 850 | | 676 | | 174 | | 25.7 | % |
Total credit related expenses | | 760 | | 32 | | 728 | | 2,275.0 | % |
| | | | | | | | | |
Occupancy expense | | 7,752 | | 4,968 | | 2,784 | | 56.0 | % |
Depreciation of premises and equipment | | 3,550 | | 2,322 | | 1,228 | | 52.9 | % |
Supplies, stationary and printing | | 822 | | 558 | | 264 | | 47.3 | % |
Marketing expenses | | 1,797 | | 1,425 | | 372 | | 26.1 | % |
Data processing expense | | 5,525 | | 3,453 | | 2,072 | | 60.0 | % |
Legal, auditing and other professional fees | | 2,106 | | 1,332 | | 774 | | 58.1 | % |
Bank regulatory related expenses | | 2,074 | | 1,209 | | 865 | | 71.5 | % |
Postage and delivery | | 963 | | 746 | | 217 | | 29.1 | % |
Debit, prepaid, ATM and merchant card related expenses | | 1,304 | | 860 | | 444 | | 51.6 | % |
Amortization of intangibles | | 4,435 | | 2,240 | | 2,195 | | 98.0 | % |
Internet and telephone banking | | 930 | | 798 | | 132 | | 16.5 | % |
Operational write-offs and losses | | 745 | | 591 | | 154 | | 26.1 | % |
Correspondent accounts and Federal Reserve charges | | 452 | | 259 | | 193 | | 74.5 | % |
Conferences/Seminars/Education/Training | | 699 | | 198 | | 501 | | 253.0 | % |
Director fees | | 439 | | 249 | | 190 | | 76.3 | % |
Impairment of bank property held for sale | | 315 | | 891 | | (576) | | (64.6) | % |
Travel expenses | | 668 | | 256 | | 412 | | 160.9 | % |
Other expenses | | 3,398 | | 2,402 | | 996 | | 41.5 | % |
Subtotal | | 106,250 | | 65,472 | | 40,778 | | 62.3 | % |
Merger related expenses | | 15,739 | | 14,140 | | 1,599 | | 11.3 | % |
Total non-interest expense | | $121,989 | | $79,612 | | $42,377 | | 53.2 | % |
The overall primary reason for the increase between the periods presented above relates to the increased salaries and wages, occupancy data processing expenses and increased amortization expense of intangibles due to acquisitions of Charter in September 2018 and NCOM in April 2019.
Provision for income taxes
We recognized income tax expense for the three-month period ended June 30, 2019 of $16,721 on pre-tax income, adjusted for earnings attributable to noncontrolling interest, of $71,244 (an effective tax rate of 23.5%, including the earnings allocated to noncontrolling interest) compared to an income tax expense of $8,410 on pre-tax income of $40,573 (an effective tax rate of 20.7%) for the comparable quarter in 2018. The increase in the effective tax rate is primarily due to higher taxable income and lower excess tax benefits on stock awards recognized during the three-month ended June 30, 2019 of $132 compared to $1,301 for the same period in 2018.
68
COMPARISON OF RESULTS OF OPERATIONS FOR THE SIX-MONTH PERIODS ENDED JUNE 30, 2019 AND 2018
Overview
We recognized net income of $99,765 and net income attributable to CenterState Bank Corporation of $99,166 or $0.88 per share basic and $0.87 per share diluted for the six-month period ended June 30, 2019, compared to net income and net income attributable to CenterState Bank Corporation of $67,799 or $0.81 per share basic and $0.80 per share diluted for the same period in 2018. A summary of the differences are listed in the table below.
| | Jun. 30, | | Jun. 30, | | increase |
Six-month periods ending: | | 2019 | | 2018 | | (decrease) |
Net interest income | | $272,856 | | $195,547 | | $77,309 |
Provision for loan losses | | 3,845 | | 4,233 | | (388) |
Net interest income after loan loss provision | | 269,011 | | 191,314 | | 77,697 |
| | | | | | |
Correspondent banking and capital markets division | | 20,534 | | 15,199 | | 5,335 |
Gain (loss) on sale of available for sale securities | | 12 | | (22) | | 34 |
All other non-interest income | | 46,697 | | 30,450 | | 16,247 |
Total non-interest income | | 67,243 | | 45,627 | | 21,616 |
| | | | | | |
Merger related expenses | | 22,104 | | 22,849 | | (745) |
All other non-interest expense | | 184,358 | | 132,759 | | 51,599 |
Total non-interest expense | | 206,462 | | 155,608 | | 50,854 |
| | | | | | |
Net income before provision for income taxes | | 129,792 | | 81,333 | | 48,459 |
Provision for income taxes | | 30,027 | | 13,534 | | 16,493 |
Net income | | 99,765 | | 67,799 | | 31,966 |
Earnings attributable to noncontrolling interest | | 599 | | — | | 599 |
Net income attributable to CenterState Bank Corporation | | $99,166 | | $67,799 | | $31,367 |
The primary differences between the two periods presented above relate to the acquisitions of Charter, which was completed during the third quarter of 2018, and NCOM, which was completed in the second quarter of 2019. The increase in our net interest income relates primarily to the increase in our average interest earning assets as a result of loan growth and the acquisitions of Charter in September 2018 and NCOM in April 2019. The increase in our “all other non-interest expense,” which represents the operating expenses of our commercial/retail banking segment, is primarily due to the acquisitions of Charter and NCOM. These items along with others are discussed and analyzed below.
Our strategy is to grow organically and by acquisition in the southeastern region. In pursuing this strategy, we seek lending teams and companies that are culturally similar to us, that are experienced and are located in our markets or in markets close to us so we can achieve economies of scale. During 2016, we established a new mortgage line of business led by an experienced mortgage lending team, and an SBA business and intend to grow those business lines in our markets, thus increasing our non-interest income. In September 2018, we hired a team of mortgage professionals from State Bank and acquired State Bank’s mortgage loan pipeline. Mortgage banking revenue and SBA revenue combined increased $5,703 during the current period compared to the same period in 2018.
Net interest income/margin
Net interest income increased $77,309 or 39.5% to $272,856 during the six-month period ended June 30, 2019 compared to $195,547 for the same period in 2018. The $77,309 increase was the result of a $103,747 increase in interest income and a $26,438 increase in interest expense.
Interest earning assets averaged $12,510,880 during the six-month period ended June 30, 2019 as compared to $8,932,774 for the same period in 2018, an increase of $3,578,106, or 40.1%. The yield on average interest earning assets increased 29 bps to 5.12% (28 bps to 5.13% tax equivalent basis) during the six-month period ended June 30, 2019, compared to 4.83% (4.85% tax equivalent basis) for the same period in 2018. The combined effects of the $3,578,106 increase in average interest earning assets and the 29 bps (28 bps tax equivalent basis) increase in yield on average interest earning assets resulted in the $103,747 ($103,492 tax equivalent basis) increase in interest income between the two periods.
Interest bearing liabilities averaged $8,373,877 during the six-month period ended June 30, 2019 as compared to $5,841,019 for the same period in 2018, an increase of $2,532,858 or 43.4%. The cost of average interest bearing liabilities was 1.08% during the six-month period ended June 30, 2019, compared to 0.63% for the same period in 2018. The effect of the $2,532,858 increase in average interest bearing liabilities and the 45 bps increase in cost of funds resulted in the $26,438 increase in interest expense between the two periods.
69
The table below summarizes the analysis of changes in interest income and interest expense for the six-month periods ended June 30, 2019 and 2018 on a tax equivalent basis.
| Six months ended June 30, |
| 2019 | | 2018 |
| Average | | Interest | | Average | | Average | | Interest | | Average |
| Balance | | inc / exp | | rate | | balance | | inc / exp | | rate |
Originated loans, excluding PCI (notes 1, 2 and 8) | $4,513,198 | | $112,267 | | 5.02% | | $3,179,228 | | $71,544 | | 4.54% |
Acquired loans, excluding PCI (notes 1, 8 and 9) | 5,392,202 | | 154,386 | | 5.77% | | $3,542,527 | | $97,904 | | 5.57% |
PCI loans (note 10) | 158,378 | | 17,890 | | 22.78% | | 188,106 | | 18,814 | | 20.17% |
Securities - taxable | 1,855,708 | | 25,026 | | 2.72% | | 1,558,461 | | 20,744 | | 2.68% |
Securities - tax exempt (note 8) | 104,680 | | 3,851 | | 7.42% | | 208,978 | | 3,685 | | 3.56% |
Fed funds sold and other (note 3) | 486,714 | | 5,119 | | 2.12% | | 255,474 | | 2356 | | 1.86% |
Total interest earning assets | 12,510,880 | | 318,539 | | 5.13% | | 8,932,774 | | 215,047 | | 4.85% |
| | | | | | | | | | | |
Allowance for loan losses | (39,197) | | | | | | (33,761) | | | | |
All other assets | 2,086,217 | | | | | | 1,399,490 | | | | |
Total assets | $14,557,900 | | | | | | $10,298,503 | | | | |
| | | | | | | | | | | |
Interest bearing deposits (note 4) | 7,785,628 | | 36,360 | | 0.94% | | 5,214,193 | | 11,804 | | 0.46% |
Fed funds purchased | 275,020 | | 3,453 | | 2.53% | | 268,470 | | 2,371 | | 1.78% |
Other borrowings (note 5) | 280,726 | | 3,739 | | 2.69% | | 326,324 | | 3,079 | | 1.90% |
Corporate debenture (note 11) | 32,503 | | 1,127 | | 6.99% | | 32,032 | | 987 | | 6.21% |
Total interest bearing liabilities | 8,373,877 | | 44,679 | | 1.08% | | 5,841,019 | | 18,241 | | 0.63% |
Demand deposits | 3,525,837 | | | | | | 2,839,268 | | | | |
Other liabilities | 217,439 | | | | | | 99,396 | | | | |
Total equity | 2,440,747 | | | | | | 1,518,820 | | | | |
Total liabilities and stockholders’ equity | $14,557,900 | | | | | | $10,298,503 | | | | |
Net interest spread (tax equivalent basis) (note 6) | | | | | 4.05% | | | | | | 4.22% |
Net interest income (tax equivalent basis) | | | $273,860 | | | | | | $196,806 | | |
Net interest margin (tax equivalent basis) (note 7) | | | | | 4.41% | | | | | | 4.44% |
note 1:Loan balances are net of deferred origination fees and costs.
note 2: | Interest income on average loans includes amortization of loan fee recognition of $1,289 and $1,115 for the six-month periods ended June 30, 2019 and 2018. |
note 3: | Includes federal funds sold, interest earned on deposits at the Federal Reserve Bank and earnings on Federal Reserve Bank stock, Federal Home Loan Bank stock and other equity stocks. |
note 4: | Includes interest bearing deposits only. Non-interest bearing checking accounts are included in the demand deposits listed below. Also, includes net amortization of fair market value adjustments related to various acquisitions of time deposits of ($1,742) and ($992) for the six-month periods ended June 30, 2019 and 2018. |
note 5:Includes securities sold under agreements to repurchase, Federal Home Loan Bank advances and subordinated notes.
note 6:Represents the average rate earned on interest earning assets minus the average rate paid on interest bearing liabilities (Non-GAAP).
note 7:Represents net interest income divided by total interest earning assets (Non-GAAP).
note 8: | Interest income and rates include the effects of a tax equivalent adjustment using applicable statutory tax rates to adjust tax-exempt interest income on tax-exempt investment securities and loans to a fully taxable basis (Non-GAAP). |
note 9: | Interest income on acquired loans, excluding PCI, includes amortization of loan discounts of $15,286 and $11,451. |
note 10: | PCI loans are accounted for pursuant to ASC 310-30. Interest income on PCI loans includes amortization of loan discounts of $13,152 and $13,823. |
note 11: | Includes amortization of fair value adjustments related to various acquisitions of corporate debentures of $175 and $175 for the six-month periods ended June 30, 2019 and 2018. |
The primary reason for the slight decrease in our net interest margin (“NIM”) during the current period was due to an increase to the overall interest bearing liabilities offset by higher loan yields between the two periods presented above. The increase in loan yields is due to the impact of loans acquired from Charter and NCOM and originating loans at higher yields.
Provision for loan losses
The provision for loan losses decreased $388 to $3,845 during the six-month period ending June 30, 2019 compared to a provision expense of $4,233 for the comparable period in 2018. Our policy is to maintain the allowance for loan losses at a level sufficient to absorb probable incurred losses in the loan portfolio. The allowance is increased by the provision for loan losses, which is a charge to current period earnings, and is decreased by charge-offs, net of recoveries on prior loan charge-offs. Therefore, the provision for loan losses (Income Statement effect) is a residual of management’s determination of allowance for loan losses (Balance Sheet approach). In determining the adequacy of the allowance for loan losses, we consider the conditions of individual borrowers, the
70
historical loan loss experience, the general economic environment, the overall portfolio composition, and other information. As these factors change, the level of loan loss provision changes. The decrease in our loan loss provision between the comparable periods is a result of an increase in non-impaired loan balances. See “Credit quality and allowance for loan losses” for additional information regarding the allowance for loan losses.
Non-interest income
Non-interest income for the six-month period ended June 30, 2019 was $67,243 compared to $45,627 for the comparable period in 2018. A summary of the differences are listed in the table below.
| | Jun. 30, | | Jun. 30, | | $ increase | | % increase | |
Six-month periods ending: | | 2019 | | 2018 | | (decrease) | | (decrease) | |
Income from correspondent banking capital markets division (note 1) | | $18,334 | | $12,898 | | $5,436 | | 42.1 | % |
Other correspondent banking related revenue (note 2) | | 2,200 | | 2,301 | | (101) | | (4.4) | % |
Mortgage banking revenue | | 10,996 | | 5,218 | | 5,778 | | 110.7 | % |
SBA revenue | | 1,940 | | 2,015 | | (75) | | (3.7) | % |
Service charges on deposit accounts | | 14,185 | | 9,695 | | 4,490 | | 46.3 | % |
Debit, prepaid, ATM and merchant card related fees | | 11,394 | | 7,225 | | 4,169 | | 57.7 | % |
BOLI income | | 3,696 | | 2,768 | | 928 | | 33.5 | % |
Wealth management related revenue | | 1,482 | | 1,256 | | 226 | | 18.0 | % |
Gain on sale of bank properties held for sale | | 1,079 | | 1,090 | | (11) | | (1.0) | % |
Other non-interest income | | 1,925 | | 1,183 | | 742 | | 62.7 | % |
Gain (loss) on sale of securities | | 12 | | (22) | | 34 | | (154.5) | % |
Total non-interest income | | $67,243 | | $45,627 | | $21,616 | | 47.4 | % |
| note 1: | Includes gross commissions earned on bond sales, fees from hedging services, loan brokering fees and related consulting fees. The fee income in this category is based on sales volume in any particular period and is therefore volatile between comparable periods. | |
| note 2: | Includes fees from safekeeping activities, bond accounting services, asset/liability consulting services, international wires, clearing and corporate checking account services and other correspondent banking related revenue and fees. The fees included in this category are less volatile than those described above in note 1. | |
Mortgage banking revenue and income from correspondent banking capital markets division increased $5,778 and $5,436, respectively, during the current period compared to the same period in 2018. Other increases in non-interest income between the periods presented are mainly attributable to the acquisitions of Charter, which was completed in 2018 and NCOM, which was completed in April 2019.
71
Non-interest expense
Non-interest expense for the six-month ended June 30, 2019 increased $50,854, or 32.7%, to $206,462, compared to $155,608 for the same period in 2018. Components of our non-interest expenses are listed in the table below.
| | Jun. 30, | | Jun. 30, | | $ increase | | % increase | |
Six-month periods ending: | | 2019 | | 2018 | | (decrease) | | (decrease) | |
Salaries and wages | | $89,559 | | $62,225 | | $27,334 | | 43.9 | % |
Incentive/bonus compensation | | 11,770 | | 7,146 | | 4,624 | | 64.7 | % |
Stock based compensation | | 2,504 | | 2,000 | | 504 | | 25.2 | % |
Employer 401K matching contributions | | 2,678 | | 1,638 | | 1,040 | | 63.5 | % |
Deferred compensation expense | | 544 | | 266 | | 278 | | 104.5 | % |
Health insurance and other employee benefits | | 8,550 | | 6,380 | | 2,170 | | 34.0 | % |
Payroll taxes | | 6,540 | | 4,860 | | 1,680 | | 34.6 | % |
Other employee related expenses | | 1,757 | | 1,583 | | 174 | | 11.0 | % |
Incremental direct cost of loan origination | | (7,993) | | (3,522) | | (4,471) | | 126.9 | % |
Total salaries, wages and employee benefits | | 115,909 | | 82,576 | | 33,333 | | 40.4 | % |
| | | | | | | | | |
Loss on sale of OREO | | (16) | | (899) | | 883 | | (98.2) | % |
Valuation write down of OREO | | 165 | | 294 | | (129) | | (43.9) | % |
Loss (gain) on repossessed assets other than real estate | | (71) | | 19 | | (90) | | (473.7) | % |
Foreclosure and repossession related expenses | | 1,411 | | 1,235 | | 176 | | 14.3 | % |
Total credit related expenses | | 1,489 | | 649 | | 840 | | 129.4 | % |
| | | | | | | | | |
Occupancy expense | | 13,354 | | 9,836 | | 3,518 | | 35.8 | % |
Depreciation of premises and equipment | | 6,400 | | 4,597 | | 1,803 | | 39.2 | % |
Supplies, stationary and printing | | 1,570 | | 1,094 | | 476 | | 43.5 | % |
Marketing expenses | | 3,817 | | 2,839 | | 978 | | 34.4 | % |
Data processing expense | | 9,181 | | 7,958 | | 1,223 | | 15.4 | % |
Legal, auditing and other professional fees | | 3,548 | | 2,263 | | 1,285 | | 56.8 | % |
Bank regulatory related expenses | | 3,690 | | 2,219 | | 1,471 | | 66.3 | % |
Postage and delivery | | 1,888 | | 1,434 | | 454 | | 31.7 | % |
Debit, prepaid, ATM and merchant card related expenses | | 2,757 | | 1,624 | | 1,133 | | 69.8 | % |
Amortization of intangibles | | 7,249 | | 4,549 | | 2,700 | | 59.4 | % |
Internet and telephone banking | | 1,879 | | 1,608 | | 271 | | 16.9 | % |
Operational write-offs and losses | | 1,572 | | 856 | | 716 | | 83.6 | % |
Correspondent accounts and Federal Reserve charges | | 737 | | 522 | | 215 | | 41.2 | % |
Conferences/Seminars/Education/Training | | 1,194 | | 487 | | 707 | | 145.2 | % |
Impairment of bank property held for sale | | 422 | | 2,340 | | (1,918) | | (82.0) | % |
Director fees | | 781 | | 516 | | 265 | | 51.4 | % |
Travel expenses | | 947 | | 426 | | 521 | �� | 122.3 | % |
Other expenses | | 5,974 | | 4,366 | | 1,608 | | 36.8 | % |
Subtotal | | 184,358 | | 132,759 | | 51,599 | | 38.9 | % |
Merger related expenses | | 22,104 | | 22,849 | | (745) | | (3.3) | % |
Total non-interest expense | | $206,462 | | $155,608 | | $50,854 | | 32.7 | % |
The overall primary reason for the increase between the periods presented above relates to the acquisitions of Charter and NCOM, which were completed during the third quarter of 2018 and the second quarter of 2019, respectively.
Provision for income taxes
We recognized income tax expense for the six-month period ended June 30, 2019 of $30,027 on pre-tax income, adjusted for earnings attributable to noncontrolling interest, of $129,192 (an effective tax rate of 23.2%, including the earnings allocated to noncontrolling interest) compared to an income tax expense of $13,534 on pre-tax income of $81,333 (an effective tax rate of 16.6%) for the comparable quarter in 2018. The increase is due to the overall increase in taxable income and less excess tax benefits on stock awards of $507 in during the six months ended June 30, 2019 compared to $5,840 for the same period in 2018.
72
Liquidity
Liquidity is defined as the ability to meet anticipated customer demands for funds under credit commitments and deposit withdrawals at a reasonable cost and on a timely basis. We measure liquidity position by giving consideration to both on- and off-balance sheet sources of and demands for funds on a daily and weekly basis.
Our Bank regularly assesses the amount and likelihood of projected funding requirements through a review of factors such as historical deposit volatility and funding patterns, present and forecasted market and economic conditions, individual client funding needs, and existing and planned business activities. The Bank’s asset/liability committee (ALCO) provides oversight to the liquidity management process and recommends guidelines, subject to the approval of its board of directors, and courses of action to address actual and projected liquidity needs.
Short term sources of funding and liquidity include cash and cash equivalents, net of federal requirements to maintain reserves against deposit liabilities; investment securities eligible for pledging to secure borrowings from customers pursuant to securities sold under repurchase agreements; loan repayments; deposits and certain interest rate-sensitive deposits; and borrowings under overnight federal fund lines available from correspondent banks, including the Federal Reserve Discount Window, and borrowing from the Federal Home Loan Bank of Atlanta. In addition to interest rate-sensitive deposits, the primary demand for liquidity is anticipated fundings under credit commitments to customers.
Off-Balance Sheet Arrangements
We do not have any material off-balance sheet arrangements except for approved and unfunded loans and letters of credit to our customers in the ordinary course of business.
73
Use of Non-GAAP Financial Measures and Ratios
The accounting and reporting policies of the Company conform to generally accepted accounting principles (“GAAP”) in the United States and prevailing practices in the banking industry. However, certain non-GAAP performance measures and ratios are used by management to evaluate and measure the Company’s performance. These include tax-equivalent net interest income (including its individual components) and net interest margin (including its individual components). Management believes that these measures and ratios provide users of the Company’s financial information with a more meaningful view of the performance of the interest-earning assets and interest-bearing liabilities. Other financial holding companies may define or calculate these measures differently.
Management reviews yields on certain asset categories and the net interest margin of the Company and its banking subsidiaries on a fully taxable equivalent basis. In this non-GAAP presentation, net interest income is adjusted to reflect tax-exempt interest income on an equivalent before-tax basis. This measure ensures the comparability of net interest income arising from both taxable and tax-exempt sources.
These disclosures should not be considered in isolation or a substitute for results determined in accordance with GAAP, and are not necessarily comparable to non-GAAP performance measures which may be presented by other financial holding companies. Management compensates for these limitations by providing detailed reconciliations between GAAP information and the non-GAAP financial measures.
74
| | Three months ended June 30, | | Six months ended June 30, |
(Dollars in thousands) | | 2019 | | 2018 | | 2019 | | 2018 |
Income Statement Non-GAAP measures and ratios | | | | | | | | |
Interest income (GAAP) | | | | | | | | |
Originated loans, excluding PCI loans | | $61,124 | | $37,826 | | $111,746 | | $70,854 |
Acquired loans, excluding PCI loans | | 98,802 | | 48,720 | | 154,325 | | 97,904 |
PCI loans | | 7,750 | | 11,096 | | 17,890 | | 18,814 |
Securities - taxable | | 12,740 | | 10,325 | | 25,026 | | 20,744 |
Securities - tax-exempt | | 1,713 | | 1,559 | | 3,429 | | 3,116 |
Federal funds sold and other | | 3,124 | | 1,103 | | 5,119 | | 2,356 |
Total Interest income (GAAP) | | 185,253 | | 110,629 | | 317,535 | | 213,788 |
| | | | | | | | |
Tax equivalent adjustment | | | | | | | | |
Non-PCI originated loans | | 261 | | 371 | | 521 | | 690 |
Non-PCI acquired loans | | 24 | | — | | 61 | | — |
Securities - tax-exempt | | 210 | | 286 | | 422 | | 569 |
Total tax equivalent adjustment | | 495 | | 657 | | 1,004 | | 1,259 |
| | | | | | | | |
Interest income - tax equivalent | | | | | | | | |
Originated loans excluding PCI loans | | 61,385 | | 38,197 | | 112,267 | | 71,544 |
Acquired loans, excluding PCI loans | | 98,826 | | 48,720 | | 154,386 | | 97,904 |
PCI loans | | 7,750 | | 11,096 | | 17,890 | | 18,814 |
Securities - taxable | | 12,740 | | 10,325 | | 25,026 | | 20,744 |
Securities - tax-exempt | | 1,923 | | 1,845 | | 3,851 | | 3,685 |
Federal funds sold and other | | 3,124 | | 1,103 | | 5,119 | | 2,356 |
Total interest income - tax equivalent | | 185,748 | | 111,286 | | 318,539 | | 215,047 |
| | | | | | | | |
Total Interest expense (GAAP) | | (26,572) | | (10,100) | | (44,679) | | (18,241) |
| | | | | | | | |
Net interest income - tax equivalent | | $159,176 | | $101,186 | | $273,860 | | $196,806 |
| | | | | | | | |
Net interest income (GAAP) | | $158,681 | | $100,529 | | $272,856 | | $195,547 |
| | | | | | | | |
Yields and costs | | | | | | | | |
Yield on originated loans excluding PCI - tax equivalent | | 5.15% | | 4.61% | | 5.02% | | 4.54% |
Yield on acquired loans excluding PCI - tax equivalent | | 5.83% | | 5.63% | | 5.77% | | 5.57% |
Yield on securities tax-exempt - tax equivalent | | 3.51% | | 3.61% | | 7.42% | | 3.56% |
Yield on interest earning assets (GAAP) | | 5.18% | | 4.93% | | 5.12% | | 4.83% |
Yield on interest earning assets - tax equivalent | | 5.19% | | 4.96% | | 5.13% | | 4.85% |
Cost of interest bearing liabilities (GAAP) | | 1.11% | | 0.69% | | 1.08% | | 0.63% |
Net interest spread (GAAP) | | 4.07% | | 4.24% | | 4.04% | | 4.20% |
Net interest spread - tax equivalent | | 4.08% | | 4.27% | | 4.05% | | 4.22% |
Net interest margin (GAAP) | | 4.43% | | 4.48% | | 4.40% | | 4.41% |
Net interest margin - tax equivalent | | 4.45% | | 4.51% | | 4.41% | | 4.44% |
ITEM 3. | QUANTITATIVE AND QUALITATIVE DISCLOSURES: MARKET RISK |
We believe interest rate risk is the most significant market risk impacting us. We monitor and manage interest rate risk using interest rate sensitivity “gap” analysis to measure the impact of market interest rate changes on net interest income. See our Annual Report on Form 10-K for the fiscal year ended December 31, 2018 for disclosure of the quantitative and qualitative information regarding the interest rate risk inherent in interest rate risk sensitive instruments as of December 31, 2018. There have been no changes in the assumptions used in monitoring interest rate risk as of June 30, 2019. The impact of other types of market risk, such as foreign currency exchange risk and equity price risk, is deemed immaterial.
ITEM 4. | CONTROLS AND PROCEDURES |
As of the end of the period covered by this report, an evaluation was carried out under the supervision and with the participation of our management, including the Chief Executive Officer (CEO) and Chief Financial Officer (CFO), of the effectiveness of the design and operation of our disclosure controls and procedures (as defined in Rules 13a-15(e) or 15d-15(e)). Based on that evaluation, the CEO and CFO have concluded that our disclosure controls and procedures are effective to ensure that information required to be
75
disclosed by us in reports that we file or submit under the Securities Exchange Act of 1934 are recorded, processed, summarized and reported within the time periods specified in Securities and Exchange Commission rules and forms. There was no change in our internal control over financial reporting (as defined in Rules 13a-15(f) or 15d-15(f)) during the quarter covered by this report that has materially affected, or is reasonably likely to materially affect, our internal control over financial reporting.
PART II. OTHER INFORMATION
None
In addition to the other information set forth in this Quarterly Report, you should carefully consider the factors discussed in Part I, Item 1A. “Risk Factors” in our Annual Report on Form 10-K for our fiscal year ended December 31, 2018. The risks discussed in our Annual Report on Form 10-K could materially affect our business, financial condition and future results. The risks described in our Annual Report on Form 10-K are not the only risks facing us. Additional risks and uncertainties not currently known to us or that we currently deem to be insignificant also may materially and adversely affect our business, financial condition or operating results in the future.
Item 2.Unregistered Sales of Equity Securities and Use of Proceeds
| | | Total Number | Maximum Number |
| | | of Shares | of Shares that |
| Total | | Purchased as | may yet be |
| Number of | Average | part of Publicly | Purchased Under |
Period | Shares | Price paid | Announced Plans | the Plans or |
Beginning | Ending | Purchased | per Share | or Programs | Programs |
April 1, 2019 | April 30, 2019 | --- | --- | --- | 3,000,000 |
May 1, 2019 | May 31, 2019 | 1,500,365 | $23.03 | 1,500,000 | 5,000,000 |
June 1, 2019 | June 30, 2019 | 181,075 | $22.51 | 180,300 | 4,819,700 |
Total for quarter ending June 30, 2019 | 1,681,440 | $22.98 | 1,680,300 | 4,819,700 |
During the second quarter of 2019, we repurchased 1,680,300 shares of our common stock, at an average price of approximately $22.98 per share, pursuant to our stock repurchase plan currently in place. We repurchased 1,140 shares of our common stock from our employees during the second quarter of 2019 for settlement of certain tax withholding obligations related to certain equity based compensation awards. On May 20, 2019, the Company increased the maximum number of shares subject to its share repurchase program from 3,000,000 shares of the Company’s outstanding common stock, to 6,500,000 shares of the Company’s outstanding common stock, subject to market conditions.
Item 3. | Defaults Upon Senior Securities |
None.
Item 4. | [Removed and Reserved] |
None
76
77
CENTERSTATE BANK CORPORATION
SIGNATURES
In accordance with the requirements of the Securities Exchange Act of 1934, the Registrant has duly caused this report to be signed on its behalf by the undersigned thereunto duly authorized.
CENTERSTATE BANK CORPORATION
(Registrant)
Date: August 1, 2019 | | | | By: | | /s/ John C. Corbett |
| | | | | | John C. Corbett |
| | | | | | President and Chief Executive Officer |
Date: August 1, 2019 | | | | By: | | /s/ William E. Matthews, V |
| | | | | | William E. Matthews, V |
| | | | | | Executive Vice President |
| | | | | | and Chief Financial Officer |
78