
0 EarthLink Overview
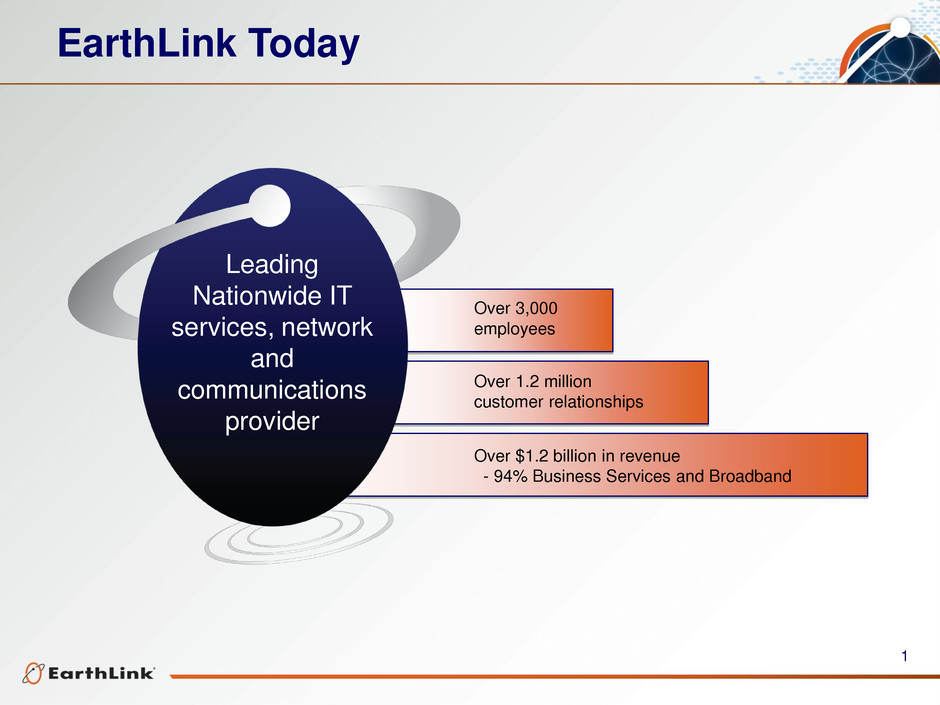
1 EarthLink Today Over 1.2 million customer relationships Over $1.2 billion in revenue - 94% Business Services and Broadband Over 3,000 employees Leading Nationwide IT services, network and communications provider
2 Investment Thesis • Improving revenue trajectory – $150M retail growth business growing at 20%+ per year with differentiated IT service offering – $150M wholesale growth business with unique fiber routes – Lower churn and better product mix of new bookings – Nationally recognized and trusted brand • Substantial cash flow – Legacy customer business generating meaningful cash flow • Strong balance sheet and significant tax assets
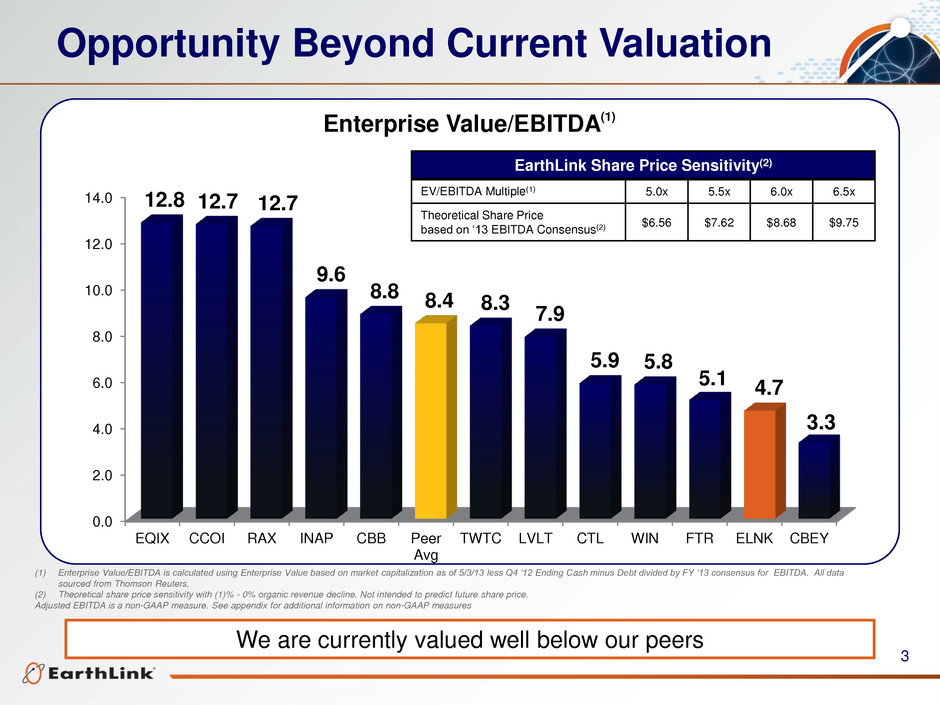
3 Opportunity Beyond Current Valuation We are currently valued well below our peers (1) Enterprise Value/EBITDA is calculated using Enterprise Value based on market capitalization as of 5/3/13 less Q4 ‘12 Ending Cash minus Debt divided by FY ‘13 consensus for EBITDA. All data sourced from Thomson Reuters. (2) Theoretical share price sensitivity with (1)% - 0% organic revenue decline. Not intended to predict future share price. Adjusted EBITDA is a non-GAAP measure. See appendix for additional information on non-GAAP measures Enterprise Value/EBITDA(1) 0.0 2.0 4.0 6.0 8.0 10.0 12.0 14.0 EQIX CCOI RAX INAP CBB Peer Avg TWTC LVLT CTL WIN FTR ELNK CBEY 12.8 12.7 12.7 9.6 8.8 8.4 8.3 7.9 5.9 5.8 5.1 4.7 3.3 EarthLink Share Price Sensitivity(2) EV/EBITDA Multiple(1) 5.0x 5.5x 6.0x 6.5x Theoretical Share Price based on ‘13 EBITDA Consensus(2) $6.56 $7.62 $8.68 $9.75
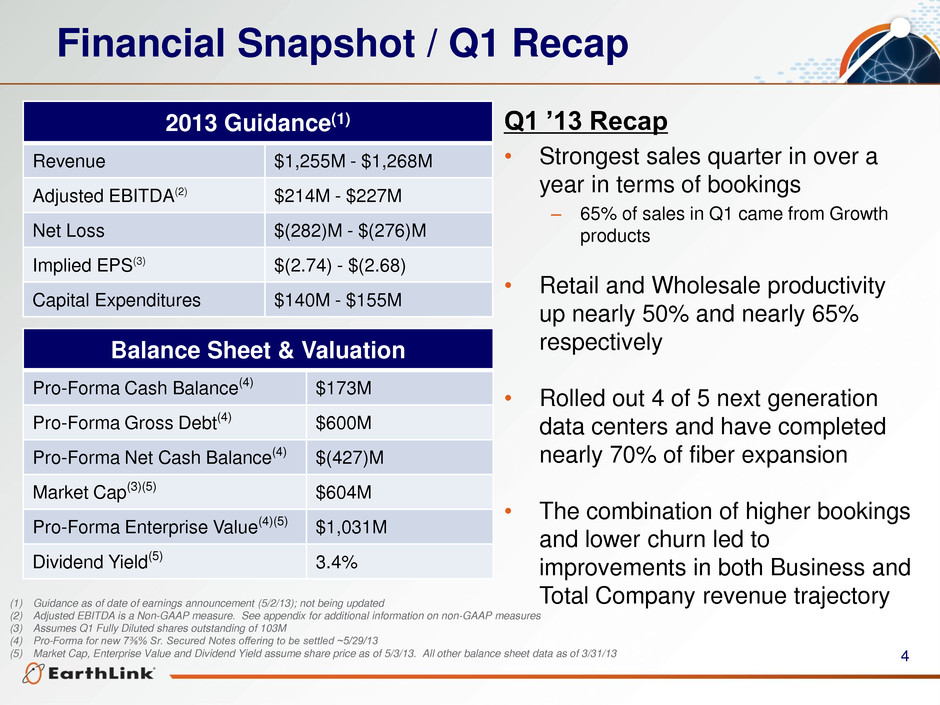
4 Financial Snapshot / Q1 Recap 2013 Guidance(1) Revenue $1,255M - $1,268M Adjusted EBITDA(2) $214M - $227M Net Loss $(282)M - $(276)M Implied EPS(3) $(2.74) - $(2.68) Capital Expenditures $140M - $155M Balance Sheet & Valuation Pro-Forma Cash Balance(4) $173M Pro-Forma Gross Debt(4) $600M Pro-Forma Net Cash Balance(4) $(427)M Market Cap(3)(5) $604M Pro-Forma Enterprise Value(4)(5) $1,031M Dividend Yield(5) 3.4% (1) Guidance as of date of earnings announcement (5/2/13); not being updated (2) Adjusted EBITDA is a Non-GAAP measure. See appendix for additional information on non-GAAP measures (3) Assumes Q1 Fully Diluted shares outstanding of 103M (4) Pro-Forma for new 7⅜% Sr. Secured Notes offering to be settled ~5/29/13 (5) Market Cap, Enterprise Value and Dividend Yield assume share price as of 5/3/13. All other balance sheet data as of 3/31/13 Q1 ’13 Recap • Strongest sales quarter in over a year in terms of bookings – 65% of sales in Q1 came from Growth products • Retail and Wholesale productivity up nearly 50% and nearly 65% respectively • Rolled out 4 of 5 next generation data centers and have completed nearly 70% of fiber expansion • The combination of higher bookings and lower churn led to improvements in both Business and Total Company revenue trajectory

5 Market Opportunity
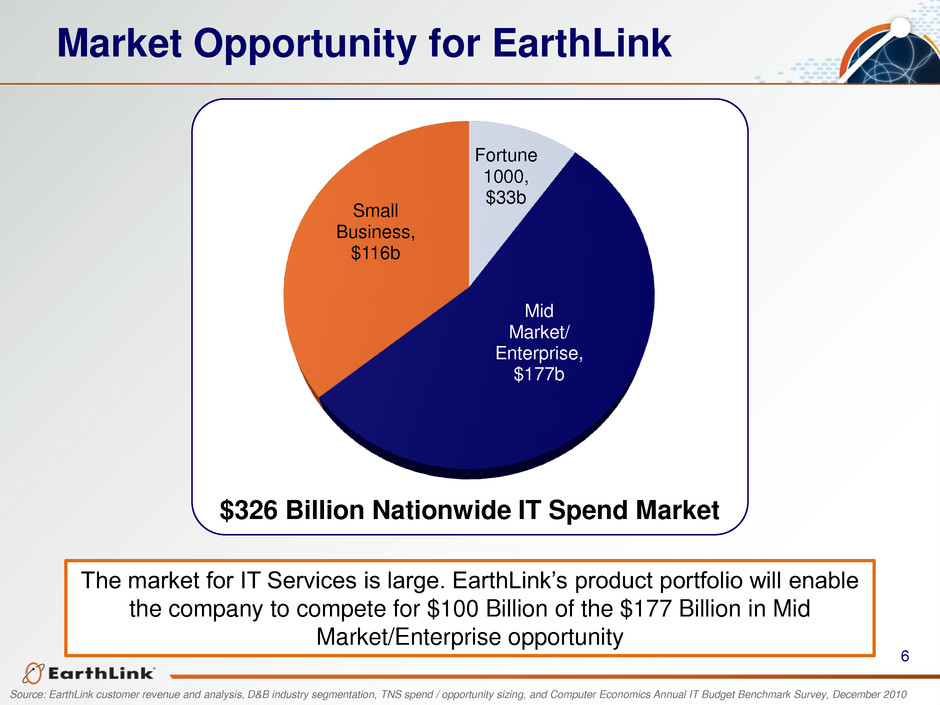
6 The market for IT Services is large. EarthLink’s product portfolio will enable the company to compete for $100 Billion of the $177 Billion in Mid Market/Enterprise opportunity Market Opportunity for EarthLink $326 Billion Nationwide IT Spend Market Fortune 1000, $33b Mid Market/ Enterprise, $177b Small Business, $116b Source: EarthLink customer revenue and analysis, D&B industry segmentation, TNS spend / opportunity sizing, and Computer Economics Annual IT Budget Benchmark Survey, December 2010
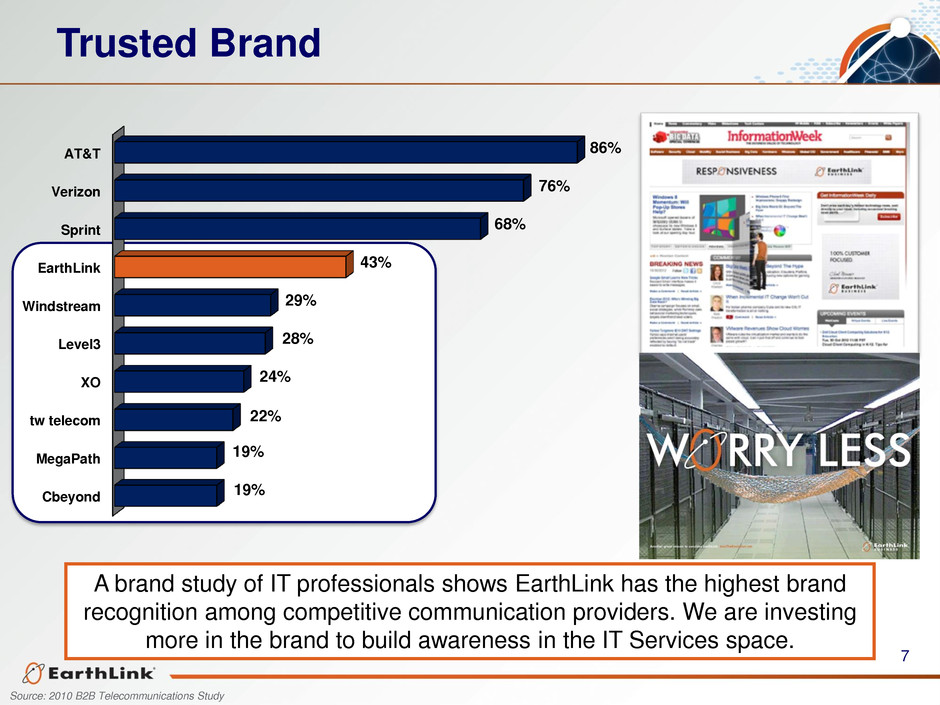
7 A brand study of IT professionals shows EarthLink has the highest brand recognition among competitive communication providers. We are investing more in the brand to build awareness in the IT Services space. Source: 2010 B2B Telecommunications Study Trusted Brand Cbeyond MegaPath tw telecom XO Level3 Windstream EarthLink Sprint Verizon AT&T 19% 19% 22% 24% 28% 29% 43% 68% 76% 86%
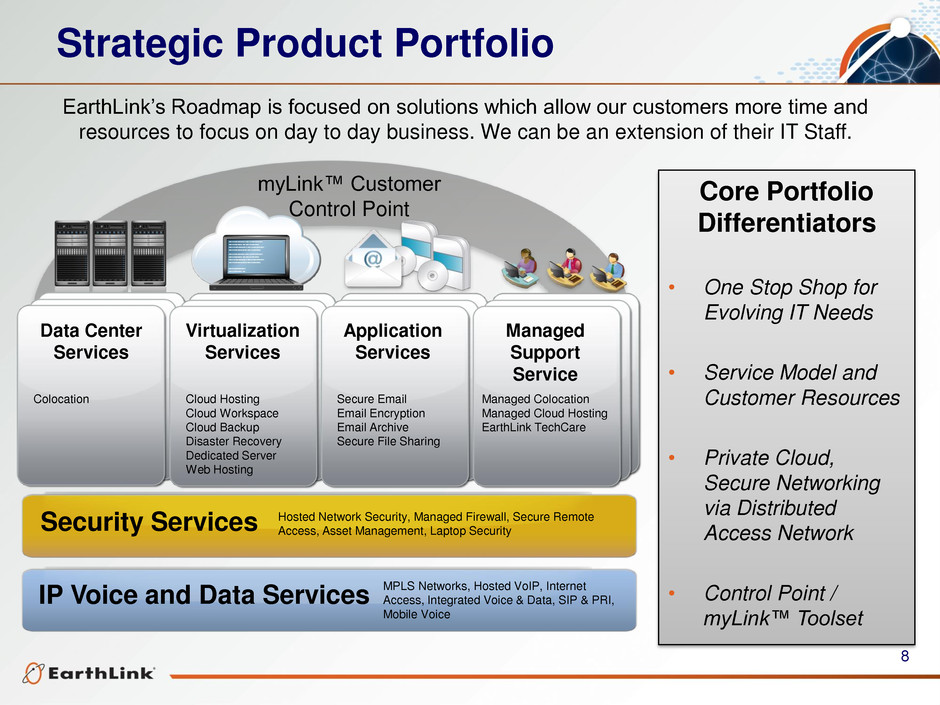
8 Core Portfolio Differentiators • One Stop Shop for Evolving IT Needs • Service Model and Customer Resources • Private Cloud, Secure Networking via Distributed Access Network • Control Point / myLink™ Toolset myLink™ Customer Control Point Virtualization Services Application Services Managed Support Service Data Center Services Security Services IP Voice and Data Services EarthLink’s Roadmap is focused on solutions which allow our customers more time and resources to focus on day to day business. We can be an extension of their IT Staff. Strategic Product Portfolio MPLS Networks, Hosted VoIP, Internet Access, Integrated Voice & Data, SIP & PRI, Mobile Voice Hosted Network Security, Managed Firewall, Secure Remote Access, Asset Management, Laptop Security Colocation Cloud Hosting Cloud Workspace Cloud Backup Disaster Recovery Dedicated Server Web Hosting Secure Email Email Encryption Email Archive Secure File Sharing Managed Colocation Managed Cloud Hosting EarthLink TechCare
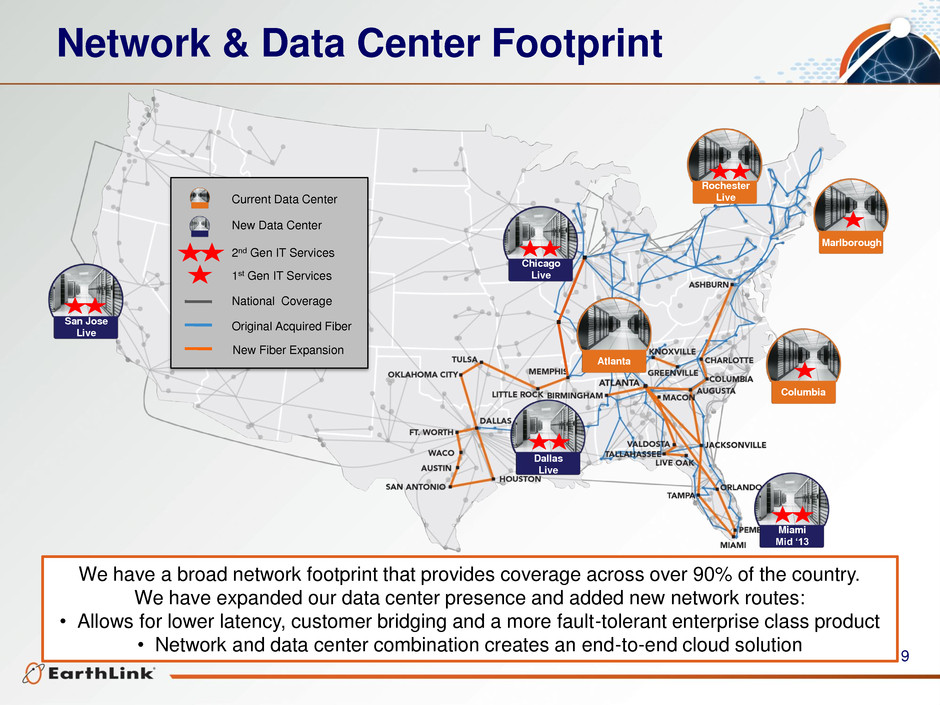
9 We have a broad network footprint that provides coverage across over 90% of the country. We have expanded our data center presence and added new network routes: • Allows for lower latency, customer bridging and a more fault-tolerant enterprise class product • Network and data center combination creates an end-to-end cloud solution San Jose Live Chicago Live Atlanta Dallas Live Rochester Live Miami Mid ‘13 Columbia Marlborough Current Data Center New Data Center 2nd Gen IT Services 1st Gen IT Services National Coverage Original Acquired Fiber New Fiber Expansion Network & Data Center Footprint

10 Sales Progress
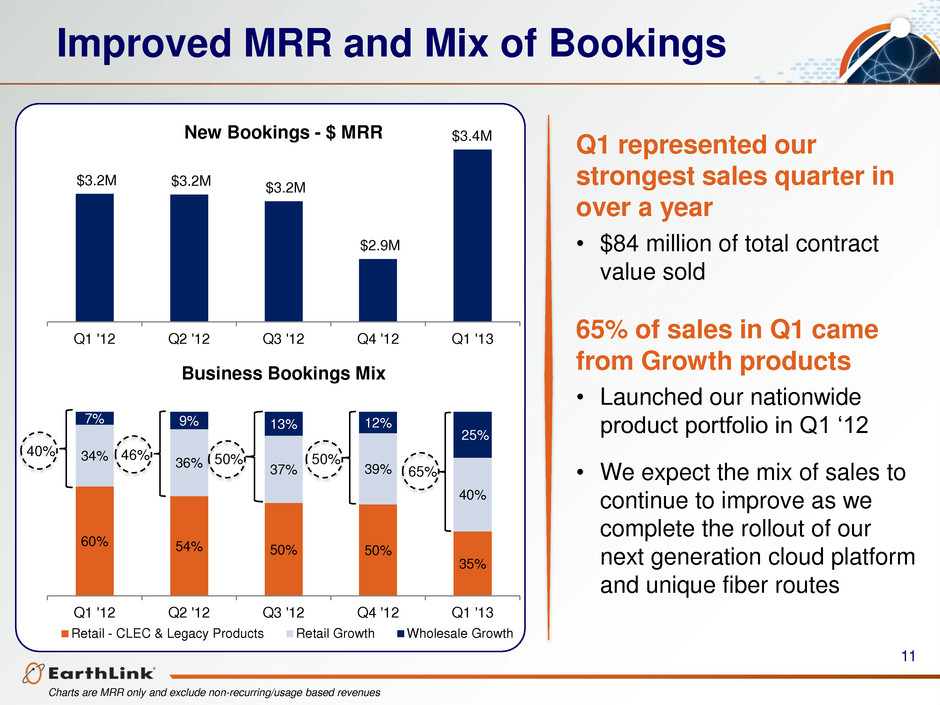
11 Improved MRR and Mix of Bookings Charts are MRR only and exclude non-recurring/usage based revenues 60% 54% 50% 50% 35% 34% 36% 37% 39% 40% 7% 9% 13% 12% 25% Q1 '12 Q2 '12 Q3 '12 Q4 '12 Q1 '13 Retail - CLEC & Legacy Products Retail Growth Wholesale Growth Q1 represented our strongest sales quarter in over a year • $84 million of total contract value sold 65% of sales in Q1 came from Growth products • Launched our nationwide product portfolio in Q1 ‘12 • We expect the mix of sales to continue to improve as we complete the rollout of our next generation cloud platform and unique fiber routes 40% 46% 50% 50% 65% $3.2M $3.2M $3.2M $2.9M $3.4M Q1 '12 Q2 '12 Q3 '12 Q4 '12 Q1 '13 New Bookings - $ MRR Business Bookings Mix
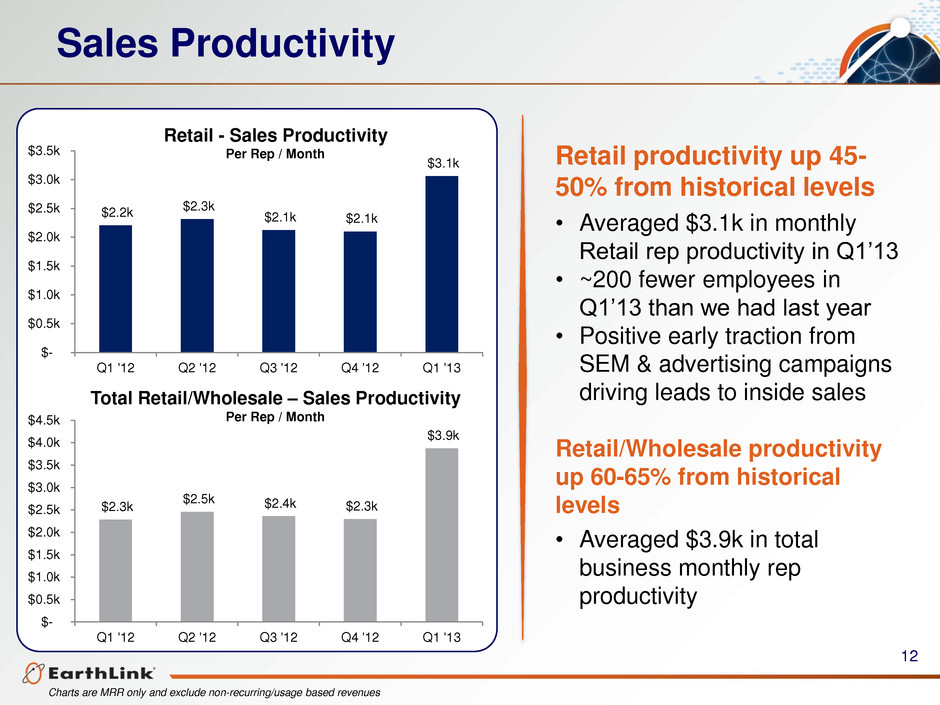
12 Total Retail/Wholesale – Sales Productivity Per Rep / Month Retail - Sales Productivity Per Rep / Month Retail productivity up 45- 50% from historical levels • Averaged $3.1k in monthly Retail rep productivity in Q1’13 • ~200 fewer employees in Q1’13 than we had last year • Positive early traction from SEM & advertising campaigns driving leads to inside sales Retail/Wholesale productivity up 60-65% from historical levels • Averaged $3.9k in total business monthly rep productivity $2.2k $2.3k $2.1k $2.1k $3.1k $- $0.5k $1.0k $1.5k $2.0k $2.5k $3.0k $3.5k Q1 '12 Q2 '12 Q3 '12 Q4 '12 Q1 '13 $2.3k $2.5k $2.4k $2.3k $3.9k $- $0.5k $1.0k $1.5k $2.0k $2.5k $3.0k $3.5k $4.0k $4.5k Q1 '12 Q2 '12 Q3 '12 Q4 '12 Q1 '13 Sales Productivity Charts are MRR only and exclude non-recurring/usage based revenues
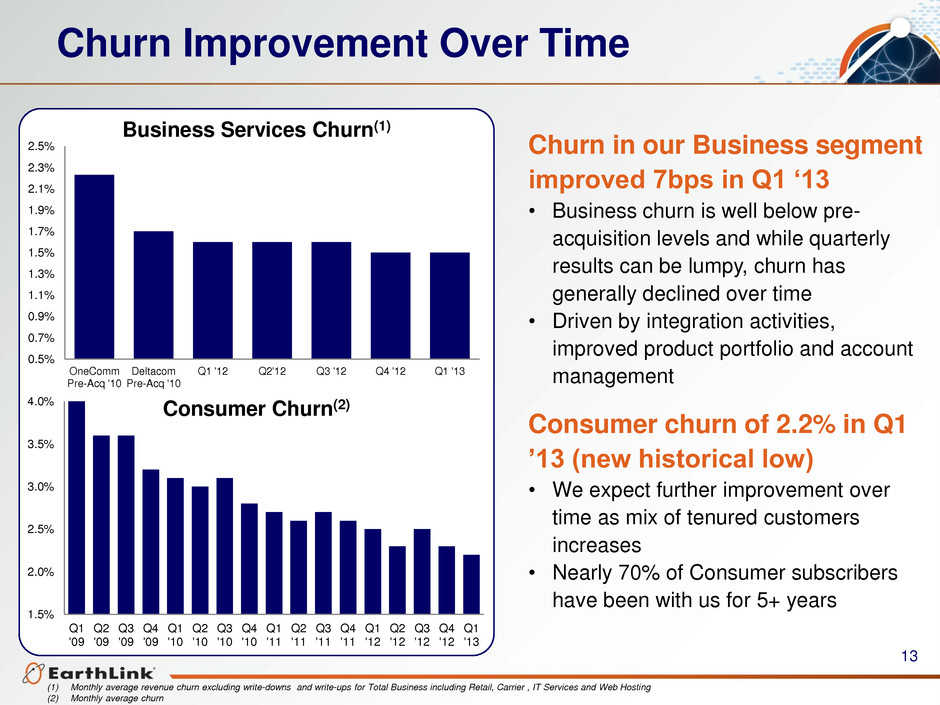
13 (1) Monthly average revenue churn excluding write-downs and write-ups for Total Business including Retail, Carrier , IT Services and Web Hosting (2) Monthly average churn Churn Improvement Over Time 0.5% 0.7% 0.9% 1.1% 1.3% 1.5% 1.7% 1.9% 2.1% 2.3% 2.5% OneComm Pre-Acq '10 Deltacom Pre-Acq '10 Q1 '12 Q2'12 Q3 '12 Q4 '12 Q1 '13 Churn in our Business segment improved 7bps in Q1 ‘13 • Business churn is well below pre- acquisition levels and while quarterly results can be lumpy, churn has generally declined over time • Driven by integration activities, improved product portfolio and account management Business Services Churn(1) 1.5% 2.0% 2.5% 3.0% 3.5% 4.0% Q1 '09 Q2 '09 Q3 '09 Q4 '09 Q1 '10 Q2 '10 Q3 '10 Q4 '10 Q1 '11 Q2 '11 Q3 '11 Q4 '11 Q1 '12 Q2 '12 Q3 '12 Q4 '12 Q1 '13 Consumer Churn(2) Consumer churn of 2.2% in Q1 ’13 (new historical low) • We expect further improvement over time as mix of tenured customers increases • Nearly 70% of Consumer subscribers have been with us for 5+ years
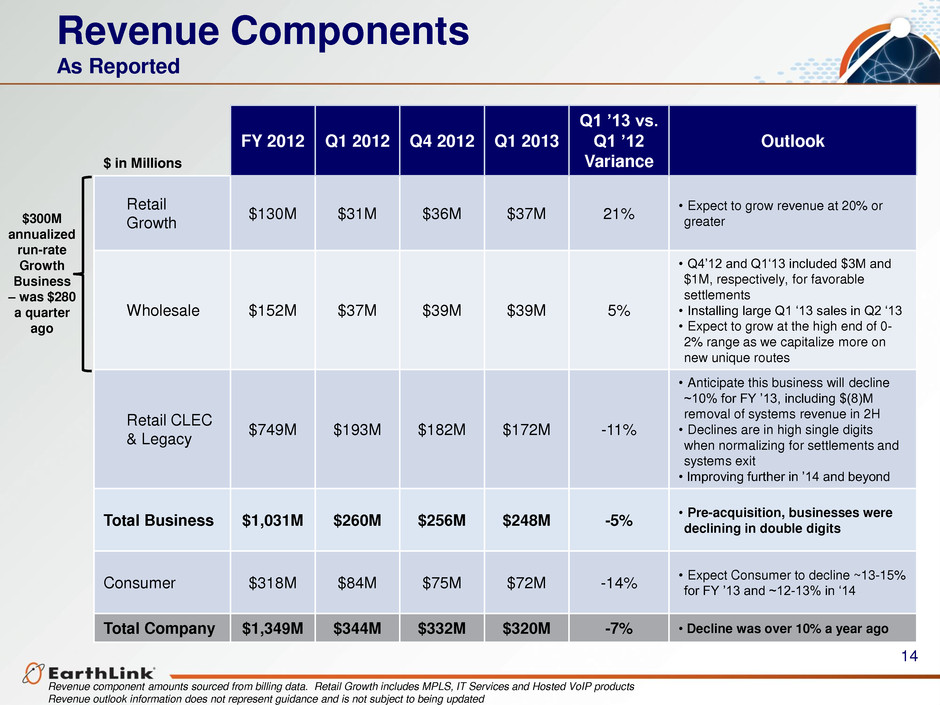
14 Revenue component amounts sourced from billing data. Retail Growth includes MPLS, IT Services and Hosted VoIP products Revenue outlook information does not represent guidance and is not subject to being updated Revenue Components As Reported $ in Millions FY 2012 Q1 2012 Q4 2012 Q1 2013 Q1 ’13 vs. Q1 ’12 Variance Outlook Retail Growth $130M $31M $36M $37M 21% • Expect to grow revenue at 20% or greater Wholesale $152M $37M $39M $39M 5% • Q4’12 and Q1‘13 included $3M and $1M, respectively, for favorable settlements • Installing large Q1 ‘13 sales in Q2 ‘13 • Expect to grow at the high end of 0- 2% range as we capitalize more on new unique routes Retail CLEC & Legacy $749M $193M $182M $172M -11% • Anticipate this business will decline ~10% for FY ’13, including $(8)M removal of systems revenue in 2H • Declines are in high single digits when normalizing for settlements and systems exit • Improving further in ’14 and beyond Total Business $1,031M $260M $256M $248M -5% • Pre-acquisition, businesses were declining in double digits Consumer $318M $84M $75M $72M -14% • Expect Consumer to decline ~13-15% for FY ’13 and ~12-13% in ‘14 Total Company $1,349M $344M $332M $320M -7% • Decline was over 10% a year ago $300M annualized run-rate Growth Business – was $280 a quarter ago
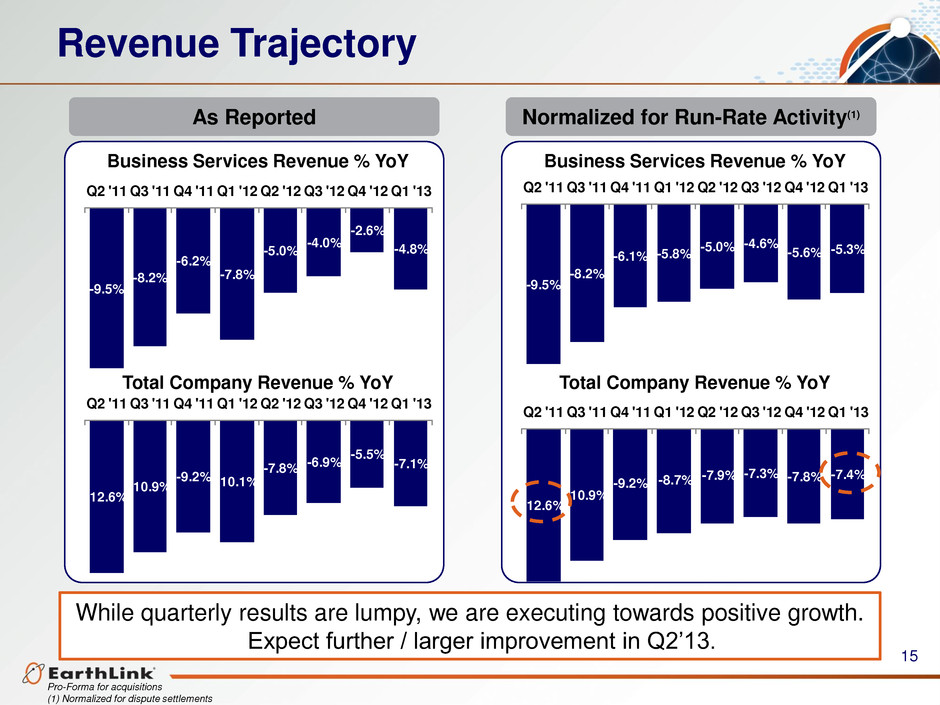
15 Pro-Forma for acquisitions (1) Normalized for dispute settlements Revenue Trajectory While quarterly results are lumpy, we are executing towards positive growth. Expect further / larger improvement in Q2’13. Business Services Revenue % YoY Business Services Revenue % YoY Normalized for Run-Rate Activity(1) As Reported Total Company Revenue % YoY Total Company Revenue % YoY -9.5% -8.2% -6.1% -5.8% -5.0% -4.6% -5.6% -5.3% Q2 '11 Q3 '11 Q4 '11 Q1 '12 Q2 '12 Q3 '12 Q4 '12 Q1 '13 -12.6% -10.9% -9.2% -8.7% -7.9% -7.3% -7.8% -7.4% Q2 '11 Q3 '11 Q4 '11 Q1 '12 Q2 '12 Q3 '12 Q4 '12 Q1 '13 -9.5% -8.2% -6.2% -7.8% -5.0% -4.0% -2.6% -4.8% Q2 '11 Q3 '11 Q4 '11 Q1 ' 2 Q2 ' 2 Q3 ' 2 Q4 '12 Q1 '13 -12.6% -10.9% -9.2% -10.1% -7.8% -6.9% -5.5% -7.1% Q2 '11 Q3 '11 Q4 '11 Q1 ' 2 Q2 ' 2 Q3 ' 2 Q4 '12 Q1 '13

16 Cash Flow & Balance Sheet
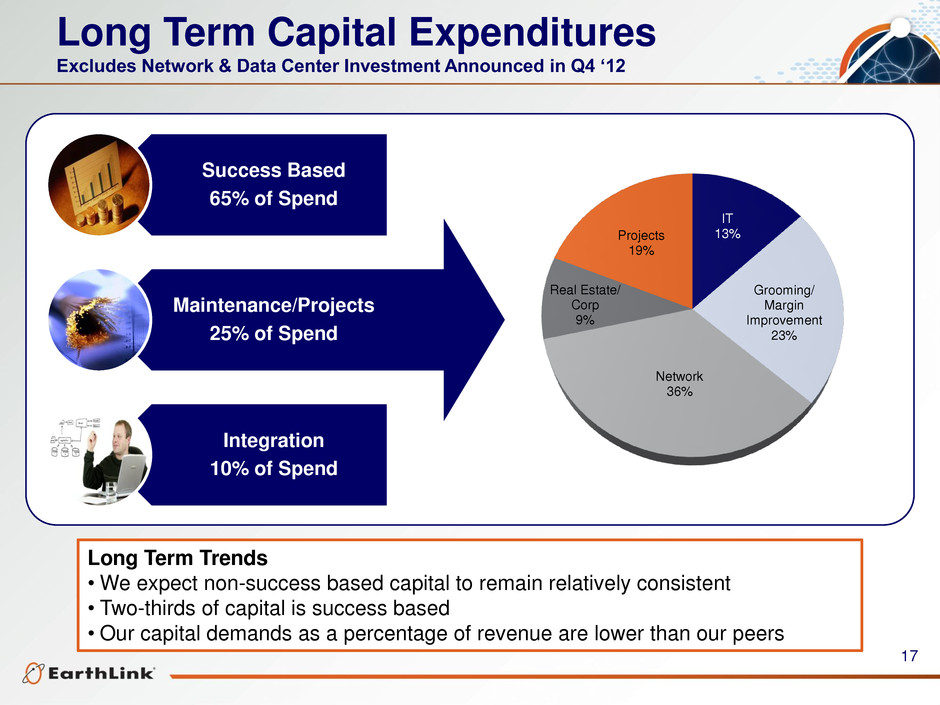
17 Long Term Capital Expenditures Excludes Network & Data Center Investment Announced in Q4 ‘12 Success Based 65% of Spend Maintenance/Projects 25% of Spend Integration 10% of Spend Long Term Trends •We expect non-success based capital to remain relatively consistent • Two-thirds of capital is success based • Our capital demands as a percentage of revenue are lower than our peers IT 13% Grooming/ Margin Improvement 23% Network 36% Real Estate/ Corp 9% Projects 19%
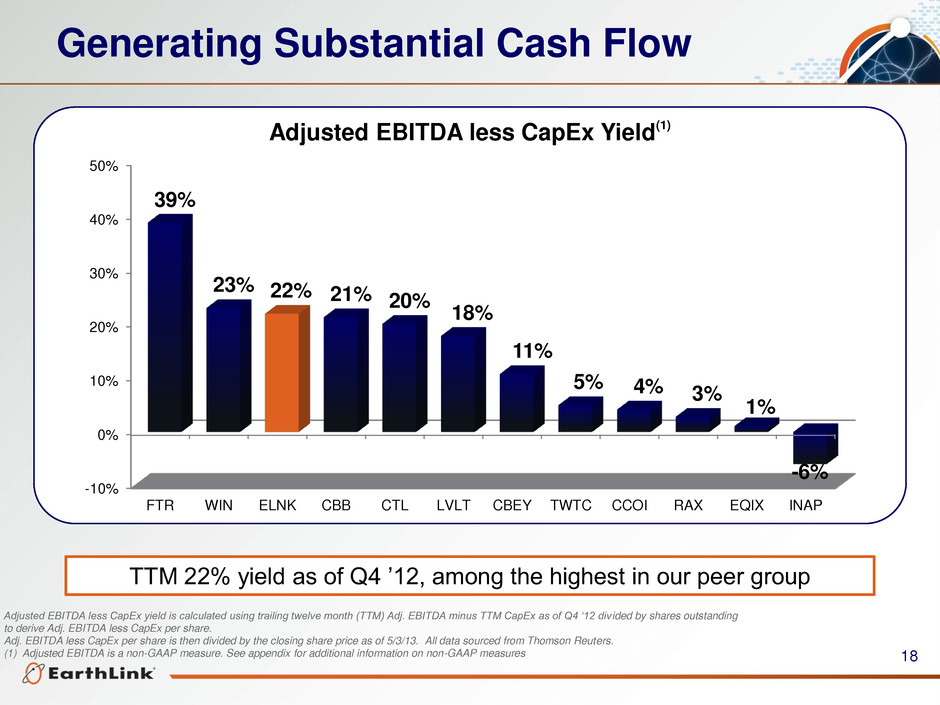
18 Generating Substantial Cash Flow TTM 22% yield as of Q4 ’12, among the highest in our peer group Adjusted EBITDA less CapEx yield is calculated using trailing twelve month (TTM) Adj. EBITDA minus TTM CapEx as of Q4 ‘12 divided by shares outstanding to derive Adj. EBITDA less CapEx per share. Adj. EBITDA less CapEx per share is then divided by the closing share price as of 5/3/13. All data sourced from Thomson Reuters. (1) Adjusted EBITDA is a non-GAAP measure. See appendix for additional information on non-GAAP measures -10% 0% 10% 20% 30% 40% 50% FTR WIN ELNK CBB CTL LVLT CBEY TWTC CCOI RAX EQIX INAP 39% 23% 22% 21% 20% 18% 11% 5% 4% 3% 1% -6% Adjusted EBITDA less CapEx Yield(1)
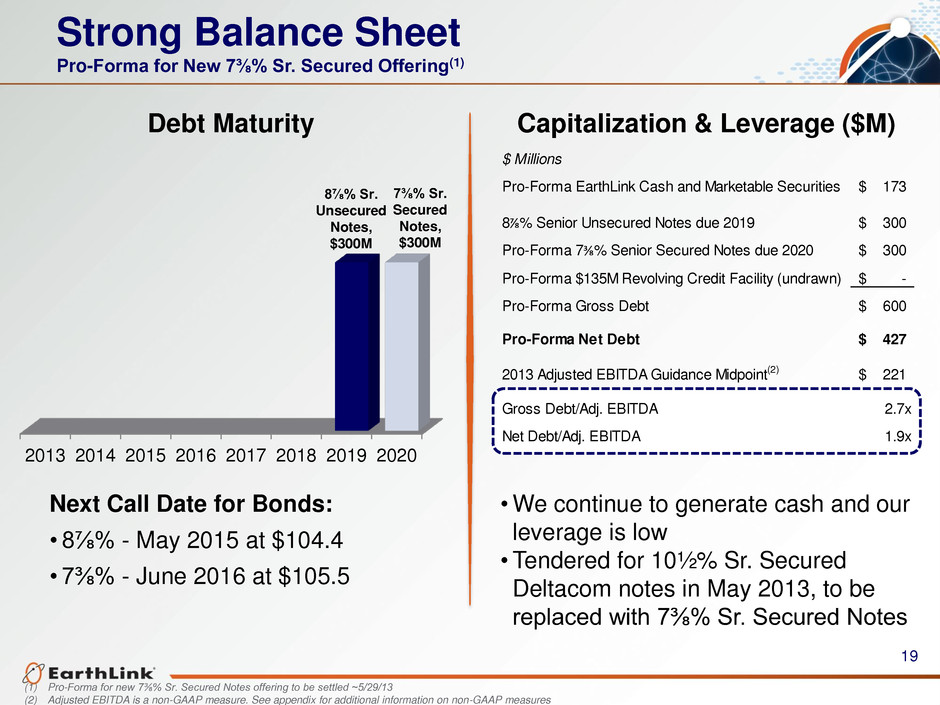
19 Strong Balance Sheet Pro-Forma for New 7⅜% Sr. Secured Offering(1) Debt Maturity Capitalization & Leverage ($M) Next Call Date for Bonds: • 8⅞% - May 2015 at $104.4 • 7⅜% - June 2016 at $105.5 •We continue to generate cash and our leverage is low •Tendered for 10½% Sr. Secured Deltacom notes in May 2013, to be replaced with 7⅜% Sr. Secured Notes 2013 2014 2015 2016 2017 2018 2019 2020 7⅜% Sr. Secured Notes, $300M 8⅞% Sr. Unsecured Notes, $300M (1) Pro-Forma for new 7⅜% Sr. Secured Notes offering to be settled ~5/29/13 (2) Adjusted EBITDA is a non-GAAP measure. See appendix for additional information on non-GAAP measures $ Millions Pro-Forma EarthLink Cash and Marketable Securities 173$ 8⅞% Senior Unsecured Notes due 2019 300$ Pro-Forma 7⅜% Senior Secured Notes due 2020 300$ Pro-Forma $135M Revolving Credit Facility (undrawn) -$ Pro-Forma Gross Debt 600$ Pro-Forma Net Debt 427$ 2013 Adjusted EBITDA Guidance Midpoint(2) 221$ Gross Debt/Adj. EBITDA 2.7x Net Debt/Adj. EBITDA 1.9x
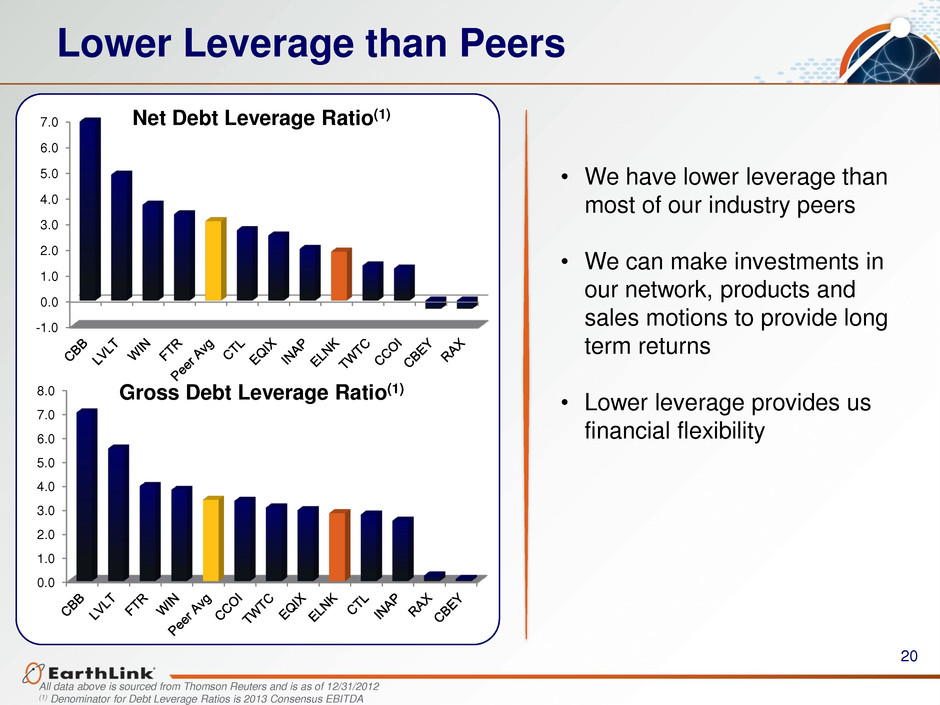
20 Lower Leverage than Peers All data above is sourced from Thomson Reuters and is as of 12/31/2012 (1) Denominator for Debt Leverage Ratios is 2013 Consensus EBITDA • We have lower leverage than most of our industry peers • We can make investments in our network, products and sales motions to provide long term returns • Lower leverage provides us financial flexibility -1.0 0.0 1.0 2.0 3.0 4.0 5.0 6.0 7.0 Net Debt Leverage Ratio(1) 0.0 1.0 2.0 3.0 4.0 5.0 6.0 7.0 8.0 Gross Debt Leverage Ratio(1)
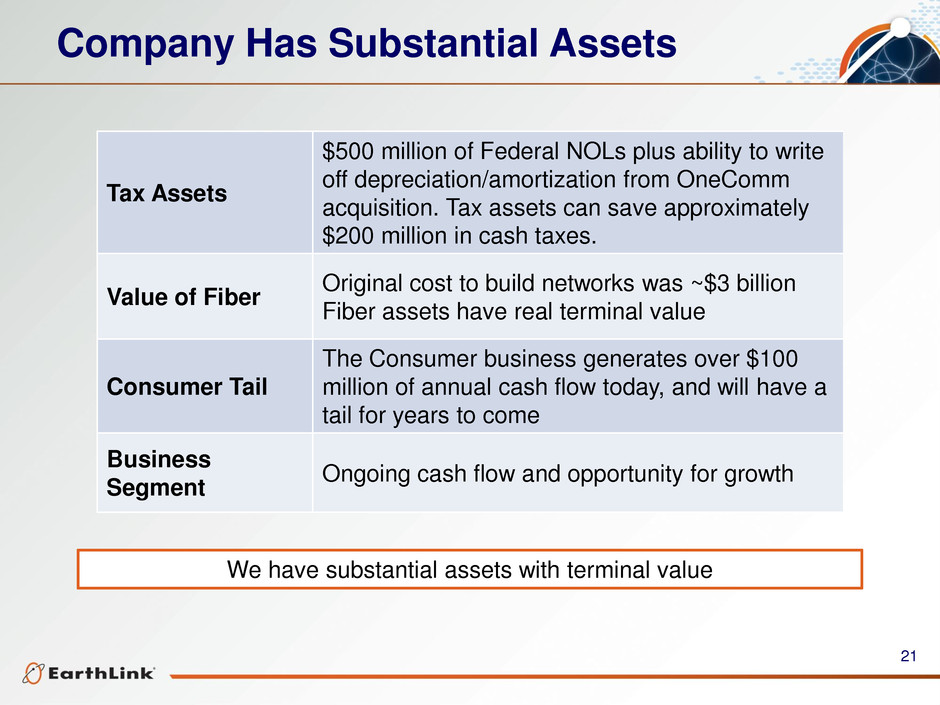
21 Company Has Substantial Assets We have substantial assets with terminal value Tax Assets $500 million of Federal NOLs plus ability to write off depreciation/amortization from OneComm acquisition. Tax assets can save approximately $200 million in cash taxes. Value of Fiber Original cost to build networks was ~$3 billion Fiber assets have real terminal value Consumer Tail The Consumer business generates over $100 million of annual cash flow today, and will have a tail for years to come Business Segment Ongoing cash flow and opportunity for growth
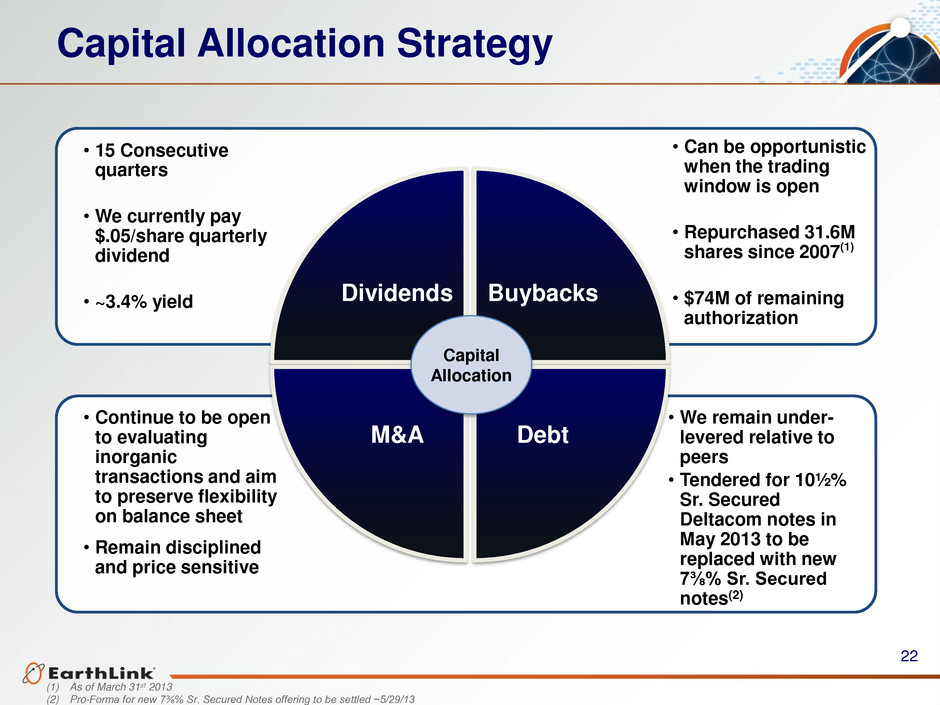
22 Capital Allocation Strategy • We remain under- levered relative to peers • Tendered for 10½% Sr. Secured Deltacom notes in May 2013 to be replaced with new 7⅜% Sr. Secured notes(2) • Continue to be open to evaluating inorganic transactions and aim to preserve flexibility on balance sheet • Remain disciplined and price sensitive • 15 Consecutive quarters • We currently pay $.05/share quarterly dividend • ~3.4% yield Dividends Buybacks Debt M&A Capital Allocation • Can be opportunistic when the trading window is open • Repurchased 31.6M shares since 2007(1) • $74M of remaining authorization (1) As of March 31st 2013 (2) Pro-Forma for new 7⅜% Sr. Secured Notes offering to be settled ~5/29/13
23 Summary We have ~$300M of run rate growth business growing annually at over 10% • IT Services is an emerging market with tremendous opportunity • Full suite of product capabilities to address the market We are nearly complete with the rollout of our national cloud platform and fiber expansion • We have seen favorable early traction on sales from our new wholesale routes and geographically dispersed cloud stacks We are financially strong • We generate cash • We have the financial platform to support our business strategy • We can capitalize on the opportunities ahead We are focused on growth
24 Appendix
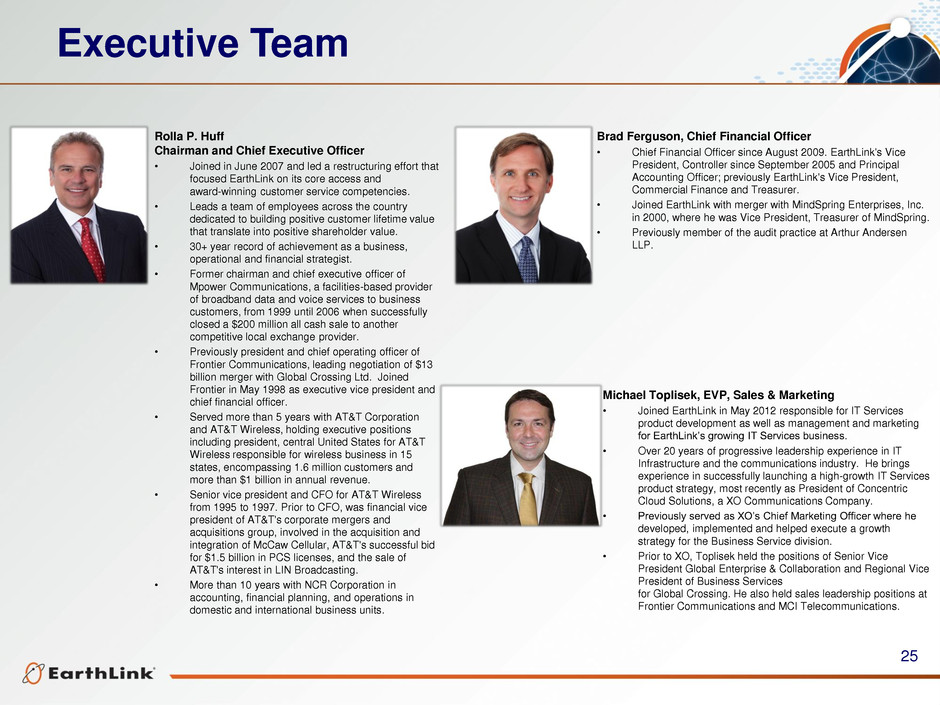
25 Executive Team Rolla P. Huff Chairman and Chief Executive Officer • Joined in June 2007 and led a restructuring effort that focused EarthLink on its core access and award-winning customer service competencies. • Leads a team of employees across the country dedicated to building positive customer lifetime value that translate into positive shareholder value. • 30+ year record of achievement as a business, operational and financial strategist. • Former chairman and chief executive officer of Mpower Communications, a facilities-based provider of broadband data and voice services to business customers, from 1999 until 2006 when successfully closed a $200 million all cash sale to another competitive local exchange provider. • Previously president and chief operating officer of Frontier Communications, leading negotiation of $13 billion merger with Global Crossing Ltd. Joined Frontier in May 1998 as executive vice president and chief financial officer. • Served more than 5 years with AT&T Corporation and AT&T Wireless, holding executive positions including president, central United States for AT&T Wireless responsible for wireless business in 15 states, encompassing 1.6 million customers and more than $1 billion in annual revenue. • Senior vice president and CFO for AT&T Wireless from 1995 to 1997. Prior to CFO, was financial vice president of AT&T's corporate mergers and acquisitions group, involved in the acquisition and integration of McCaw Cellular, AT&T's successful bid for $1.5 billion in PCS licenses, and the sale of AT&T's interest in LIN Broadcasting. • More than 10 years with NCR Corporation in accounting, financial planning, and operations in domestic and international business units. Brad Ferguson, Chief Financial Officer • Chief Financial Officer since August 2009. EarthLink's Vice President, Controller since September 2005 and Principal Accounting Officer; previously EarthLink's Vice President, Commercial Finance and Treasurer. • Joined EarthLink with merger with MindSpring Enterprises, Inc. in 2000, where he was Vice President, Treasurer of MindSpring. • Previously member of the audit practice at Arthur Andersen LLP. Michael Toplisek, EVP, Sales & Marketing • Joined EarthLink in May 2012 responsible for IT Services product development as well as management and marketing for EarthLink’s growing IT Services business. • Over 20 years of progressive leadership experience in IT Infrastructure and the communications industry. He brings experience in successfully launching a high-growth IT Services product strategy, most recently as President of Concentric Cloud Solutions, a XO Communications Company. • Previously served as XO’s Chief Marketing Officer where he developed, implemented and helped execute a growth strategy for the Business Service division. • Prior to XO, Toplisek held the positions of Senior Vice President Global Enterprise & Collaboration and Regional Vice President of Business Services for Global Crossing. He also held sales leadership positions at Frontier Communications and MCI Telecommunications.
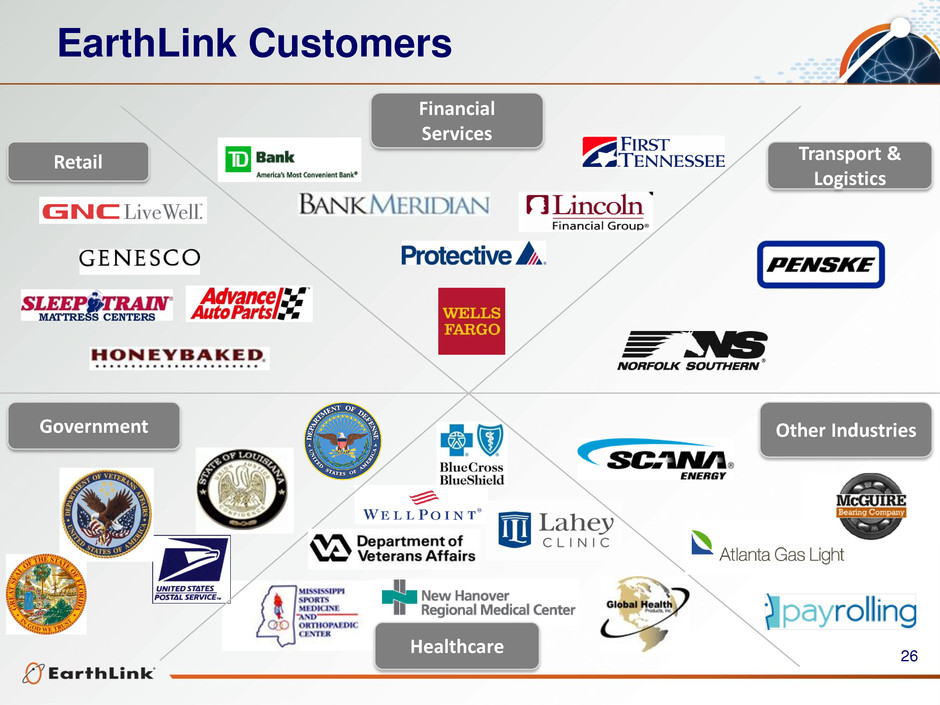
26 Transport & Logistics Financial Services Retail Government Other Industries Healthcare EarthLink Customers
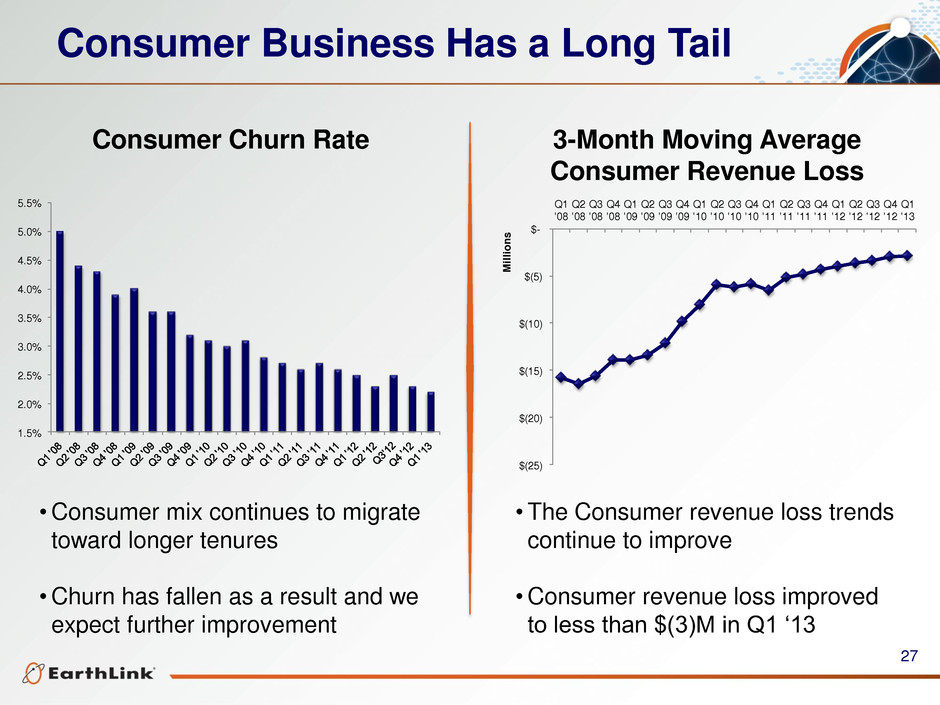
27 Consumer Business Has a Long Tail Consumer Churn Rate 3-Month Moving Average Consumer Revenue Loss •Consumer mix continues to migrate toward longer tenures •Churn has fallen as a result and we expect further improvement •The Consumer revenue loss trends continue to improve •Consumer revenue loss improved to less than $(3)M in Q1 ‘13 1.5% 2.0% 2.5% 3.0% 3.5% 4.0% 4.5% 5.0% 5.5% $(25) $(20) $(15) $(10) $(5) $- Q1 '08 Q2 '08 Q3 '08 Q4 '08 Q1 '09 Q2 '09 Q3 '09 Q4 '09 Q1 '10 Q2 '10 Q3 '10 Q4 '10 Q1 '11 Q2 '11 Q3 '11 Q4 '11 Q1 '12 Q2 '12 Q3 '12 Q4 '12 Q1 '13 M ill io ns
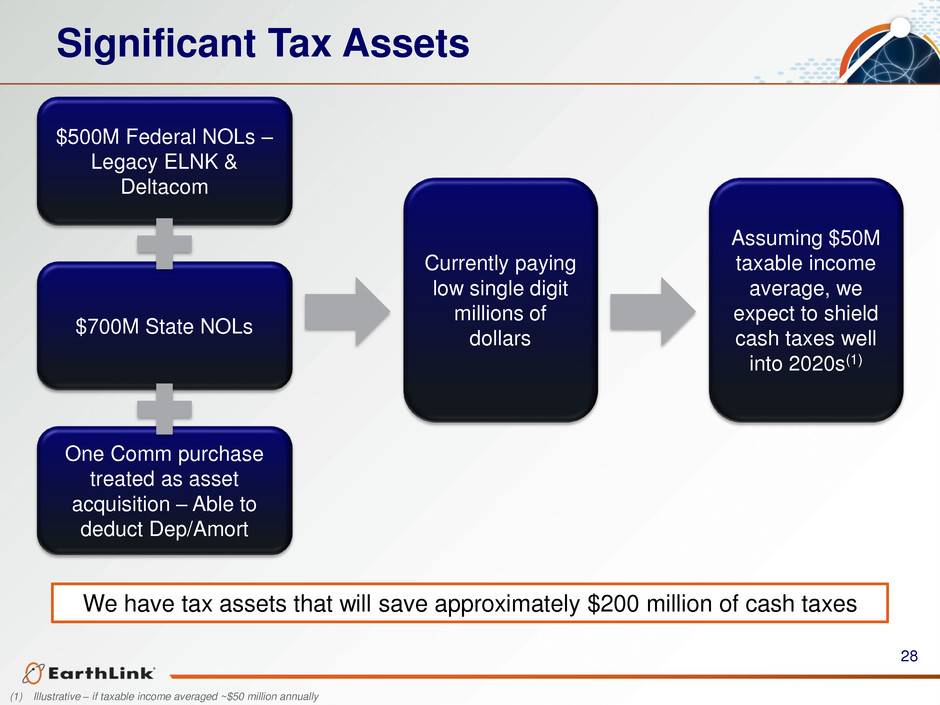
28 Significant Tax Assets We have tax assets that will save approximately $200 million of cash taxes $500M Federal NOLs – Legacy ELNK & Deltacom $700M State NOLs One Comm purchase treated as asset acquisition – Able to deduct Dep/Amort Currently paying low single digit millions of dollars Assuming $50M taxable income average, we expect to shield cash taxes well into 2020s(1) (1) Illustrative – if taxable income averaged ~$50 million annually
29 Cautionary Information Regarding Forward Looking Statements This presentation includes “forward-looking” statements (rather than historical facts) that are subject to risks and uncertainties that could cause actual results to differ materially from those described. Although we believe that the expectations expressed in these forward-looking statements are reasonable, we cannot promise that our expectations will turn out to be correct. Our actual results could be materially different from and worse than our expectations. With respect to such forward-looking statements, we seek the protections afforded by the Private Securities Litigation Reform Act of 1995. These risks include, without limitation (1) that we may not be able to execute our strategy to be an IT services company for small and medium-sized businesses with IT and network security needs, which could adversely affect our results of operations and cash flows; (2) that we may not be able to grow revenues from our evolving Business Services product portfolio to offset declining revenues from our legacy Business Services products and from our Consumer Services segment, which could adversely affect our results of operations and cash flows; (3) that we may not be able to develop the optimal sales model necessary to implement our business strategy; (4) that we may be unsuccessful integrating acquisitions into our business, which could result in operating difficulties, losses and other adverse consequences; (5) that if we are unable to adapt to changes in technology and customer demands, we may not remain competitive, and our revenues and operating results could suffer; (6) that our failure to achieve operating efficiencies will adversely affect our results of operations; (7) that as a result of our continuing review of our business, we may have to undertake further restructuring plans that would require additional charges, including incurring facility exit and restructuring charges; (8) that unfavorable general economic conditions could harm our business; (9) that we may be unable to successfully identify, manage and assimilate future acquisitions, which could adversely affect our results of operations; (10) that we face significant competition in the IT services and communications industry that could reduce our profitability; (11) that decisions by legislative or regulatory authorities, including the Federal Communications Commission relieving incumbent carriers of certain regulatory requirements, and possible further deregulation in the future, may restrict our ability to provide services and may increase the costs we incur to provide these services; (12) that if we are unable to interconnect with AT&T, Verizon and other incumbent carriers on acceptable terms, our ability to offer competitively priced local telephone services will be adversely affected; (13) that our operating performance will suffer if we are not offered competitive rates for the access services we need to provide our long distance services; (14) that we may experience reductions in switched access and reciprocal compensation revenue; (15) that failure to obtain and maintain necessary permits and rights-of-way could interfere with our network infrastructure and operations; (16) that we have substantial business relationships with several large telecommunications carriers, and some of our customer agreements may not continue due to financial difficulty, acquisitions, non-renewal or other factors, which could adversely affect our wholesale revenue and results of operations; (17) that we obtain a majority of our network equipment and software from a limited number of third-party suppliers; (18) that work stoppages experienced by other communications companies on whom we rely for service could adversely impact our ability to provision and service our customers; (19) that our commercial and alliance arrangements may not be renewed or may not generate expected benefits, which could adversely affect our results of operations; (20) that our consumer business is dependent on the availability of third-party network service providers; (21) that we face significant competition in the Internet access industry that could reduce our profitability; (22) that the continued decline of our consumer access subscribers, combined with the change in mix of our consumer access base from narrowband to broadband, will adversely affect our results of operations; (23) that potential regulation of Internet service providers could adversely affect our operations; (24) that if we, or other industry participants, are unable to successfully defend against disputes or legal actions, we could face substantial liabilities or suffer harm to our financial and operational prospects; (25) that we may be accused of infringing upon the intellectual property rights of third parties, which is costly to defend and could limit our ability to use certain technologies in the future; (26) that we may not be able to protect our intellectual property; (27) that we may be unable to hire and retain sufficient qualified personnel, and the loss of any of our key executive officers could adversely affect us; (28) that our business depends on effective business support systems and processes; (29) that privacy concerns relating to our business could damage our reputation and deter current and potential users from using our services; (30) that cyber security breaches could harm our business; (31) that interruption or failure of our network and information systems and other technologies could impair our ability to provide our services, which could damage our reputation and harm our operating results; (32) that government regulations could adversely affect our business or force us to change our business practices; (33) that regulatory audits have in the past, and could in the future, result in increased costs; (34) that our business may suffer if third parties are unable to provide services or terminate their relationships with us; (35) that we may be required to recognize additional impairment charges on our goodwill and intangible assets, which would adversely affect our results of operations and financial position; (36) that we may have exposure to greater than anticipated tax liabilities and the use of our net operating losses and certain other tax attributes could be limited in the future; (37) that our indebtedness could adversely affect our financial health and limit our ability to react to changes in our industry; (38) that we may require substantial capital to support business growth or refinance existing indebtedness, and this capital may not be available to us on acceptable terms, or at all; (39) that our debt agreements include restrictive covenants, and failure to comply with these covenants could trigger acceleration of payment of outstanding indebtedness or inability to borrow funds under our existing credit facility; (40) that we may reduce, or cease payment of, quarterly cash dividends; (41) that our stock price may be volatile; and (42) that provisions of our third restated certificate of incorporation, amended and restated bylaws and other elements of our capital structure could limit our share price and delay a change of control of the company. These risks and uncertainties, as well as other risks and uncertainties that could cause our actual results to differ significantly from management’s expectations, are not intended to represent a complete list of all risks and uncertainties inherent in our business, and should be read in conjunction with the more detailed cautionary statements and risk factors included in our Annual Report on Form 10-K for the year ended December 31, 2012.
30 Non GAAP Information EarthLink Non-GAAP Measures Adjusted EBITDA is defined by EarthLink as net income (loss) before interest expense and other, net, income taxes, depreciation and amortization, stock-based compensation expense, impairment of goodwill and intangible assets, and restructuring, acquisition and integration-related costs. Unlevered Free Cash Flow is defined by EarthLink as net income (loss) before interest expense and other, net, income taxes, depreciation and amortization, stock-based compensation expense, impairment of goodwill and intangible assets, and restructuring, acquisition and integration- related costs, less cash used for purchases of property and equipment. Adjusted EBITDA and Unlevered Free Cash Flow are non-GAAP measures and are not determined in accordance with U.S. generally accepted accounting principles. These non-GAAP financial measures are commonly used in the industry and are presented because management believes they provide relevant and useful information to investors. Management uses these non-GAAP financial measures to evaluate the performance of its business, for budget planning purposes and as factors in its employee compensation programs. Management believes that excluding the effects of certain non-cash and non-operating items enables investors to better understand and analyze the current period’s results and provides a better measure of comparability. There are limitations to using these non-GAAP financial measures. Adjusted EBITDA and Unlevered Free Cash Flow are not indicative of cash provided or used by operating activities and may differ from comparable information provided by other companies. Adjusted EBITDA and Unlevered Free Cash Flow should not be considered in isolation, as an alternative to, or more meaningful than measures of financial performance determined in accordance with U.S. generally accepted accounting principles.
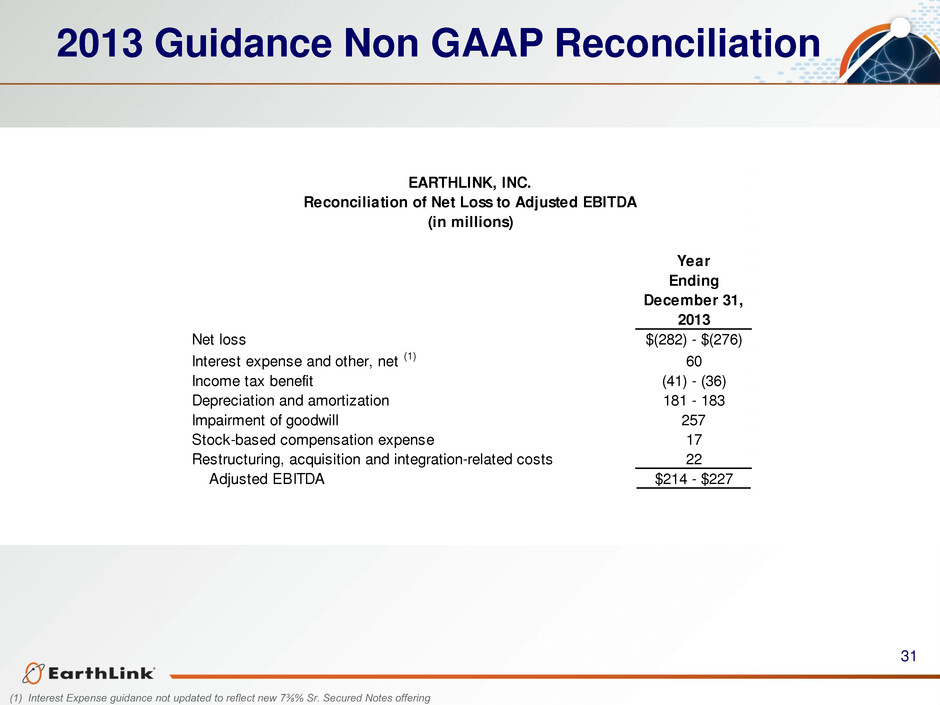
31 2013 Guidance Non GAAP Reconciliation (1) Interest Expense guidance not updated to reflect new 7⅜% Sr. Secured Notes offering Year Ending December 31, 2013 Net loss $(282) - $(276) Interest expense and other, net (1) 60 Income tax benefit (41) - (36) Depreciation and amortization 181 - 183 Impairment of goodwill 257 Stock-based compensation expense 17 Restructuring, acquisition and integration-related costs 22 Adjusted EBITDA $214 - $227 EARTHLINK, INC. Reconciliation of Net Loss to Adjusted EBITDA (in millions)
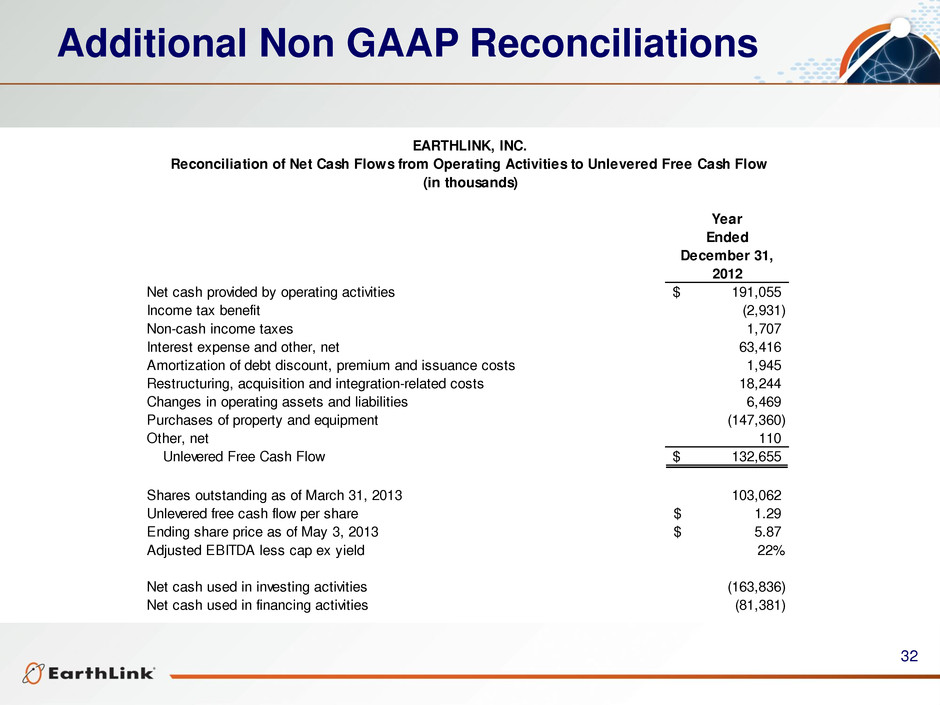
32 Additional Non GAAP Reconciliations Year Ended December 31, 2012 Net cash provided by operating activities 191,055$ Income tax benefit (2,931) Non-cash income taxes 1,707 Interest expense and other, net 63,416 Amortization of debt discount, premium and issuance costs 1,945 Restructuring, acquisition and integration-related costs 18,244 Changes in operating assets and liabilities 6,469 Purchases of property and equipment (147,360) Other, net 110 Unlevered Free Cash Flow 132,655$ Shares outstanding as of March 31, 2013 103,062 Unlevered free cash flow per share 1.29$ Ending share price as of May 3, 2013 5.87$ Adjusted EBITDA less cap ex yield 22% Net cash used in investing activities (163,836) Net cash used in financing activities (81,381) EARTHLINK, INC. Reconciliation of Net Cash Flows from Operating Activities to Unlevered Free Cash Flow (in thousands)


