2 ©2015 EarthLink. All rights reserved. EarthLink Investor Overview August 2016

3 ©2016 EarthLink. All rights reserved. Driving improved cash flow Focusing on growing Enterprise & Mid-Market and Carrier/Transport Working to de-lever balance sheet Company History Building consumer ISP Heavy sales and marketing spend Acquired several companies Business services became ~80% of revenues Running consumer ISP for cash flow >20% annual revenue declines 1994 - 2007 2014 - 2016 2007 - 2010 2010 - 2013
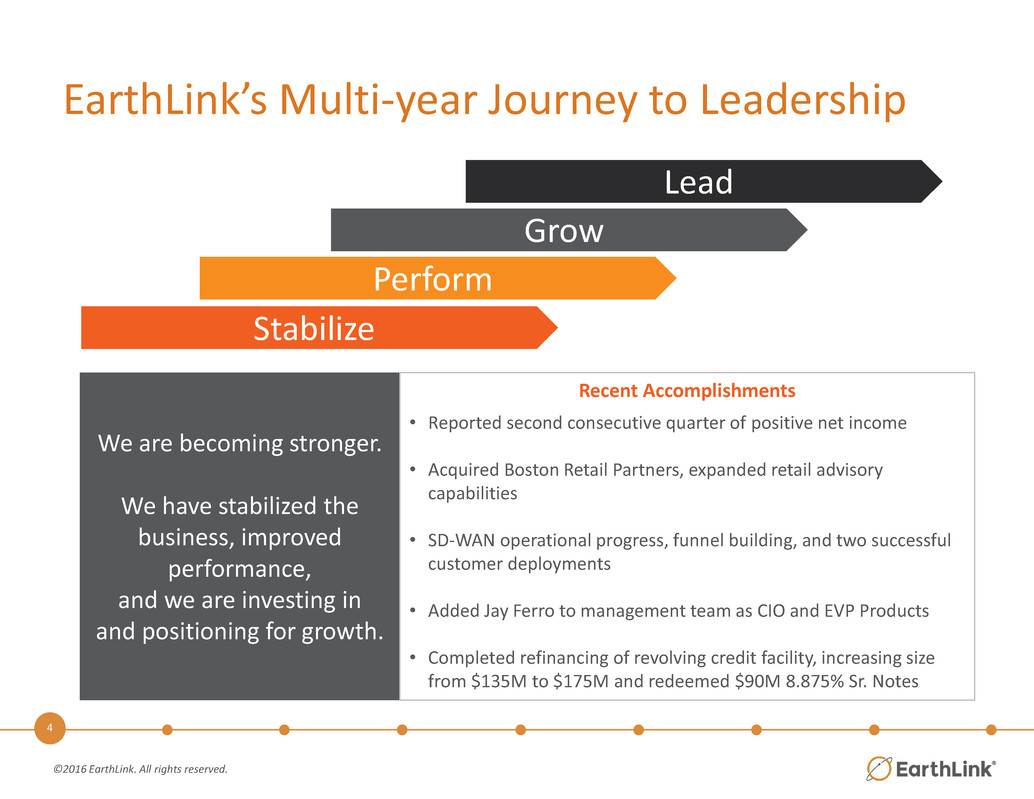
4 ©2016 EarthLink. All rights reserved. EarthLink’s Multi-year Journey to Leadership We are becoming stronger. We have stabilized the business, improved performance, and we are investing in and positioning for growth. Lead Grow Perform Stabilize Recent Accomplishments • Reported second consecutive quarter of positive net income • Acquired Boston Retail Partners, expanded retail advisory capabilities • SD-WAN operational progress, funnel building, and two successful customer deployments • Added Jay Ferro to management team as CIO and EVP Products • Completed refinancing of revolving credit facility, increasing size from $135M to $175M and redeemed $90M 8.875% Sr. Notes

5 ©2016 EarthLink. All rights reserved. 2012 – 2016 Trends (!) Adjusted EBITDA is a Non-GAAP measure. See appendix for additional information on non-GAAP measures (2) Adjusted EBITDA Margin for 2016 is based on the mid point of Guidance ranges (3) Net Debt and Debt Service are 6/30/2016 results pro forma for $90M Sr. Note repurchase. Exited TechCare and OSDA Sold IT Services assets $442 $483 $466 $418 $392 $60 $49 $49 $39 $31 $25 $45 $65 $350 $400 $450 $500 2012 2013 2014 2015 2016 ($ 's in Mil lio ns ) Net Debt and Debt Service(3) $8 $(73) $(43) -$80 -$70 -$60 -$50 -$40 -$30 -$20 -$10 $0 $10 $20 2012 2013 2014 2015 2016 ($ 's in Mil lio ns ) Net Income/(Loss) $3 - $9 $(539) $284 $227 $213 $242 21% 18% 18% 22% 22% 0% 5% 10% 15% 20% 25% 30% $150 $170 $190 21 $230 $250 $270 $290 $310 2012 2013 2014 2015 2016 ($ 's in Mil lio ns ) Adjusted EBITDA and Margin(1)(2) $210 - $220 $1,335 $1,241 $1,177 $1,097 $950-$970 $600 $700 $800 $900 $1,000 $1,100 $1,200 $1,300 $1,400 2012 2013 2014 2015 2016 ($ 's in Mil lio ns ) Revenue
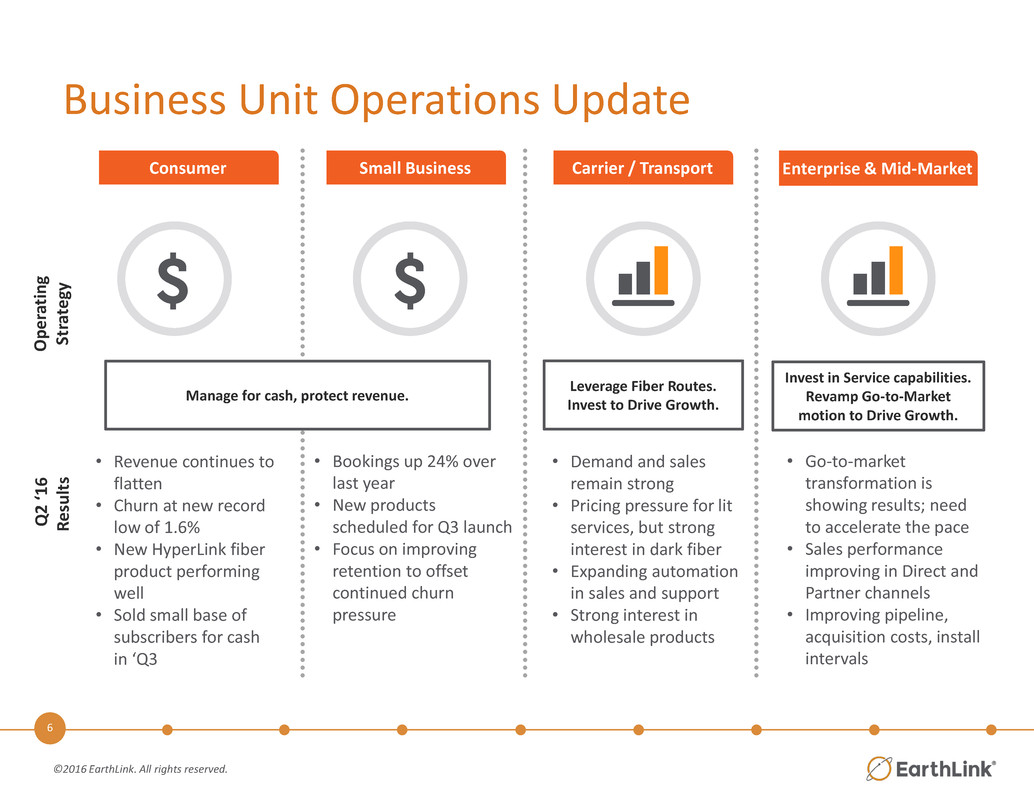
6 ©2016 EarthLink. All rights reserved. Business Unit Operations Update Ope ra ti n g St ra teg y Consumer Small Business Carrier / Transport Enterprise & Mid-Market • Revenue continues to flatten • Churn at new record low of 1.6% • New HyperLink fiber product performing well • Sold small base of subscribers for cash in ‘Q3 • Demand and sales remain strong • Pricing pressure for lit services, but strong interest in dark fiber • Expanding automation in sales and support • Strong interest in wholesale products Q2 ‘1 6 R e su lt s Manage for cash, protect revenue. • Bookings up 24% over last year • New products scheduled for Q3 launch • Focus on improving retention to offset continued churn pressure • Go-to-market transformation is showing results; need to accelerate the pace • Sales performance improving in Direct and Partner channels • Improving pipeline, acquisition costs, install intervals Leverage Fiber Routes. Invest to Drive Growth. Invest in Service capabilities. Revamp Go-to-Market motion to Drive Growth.
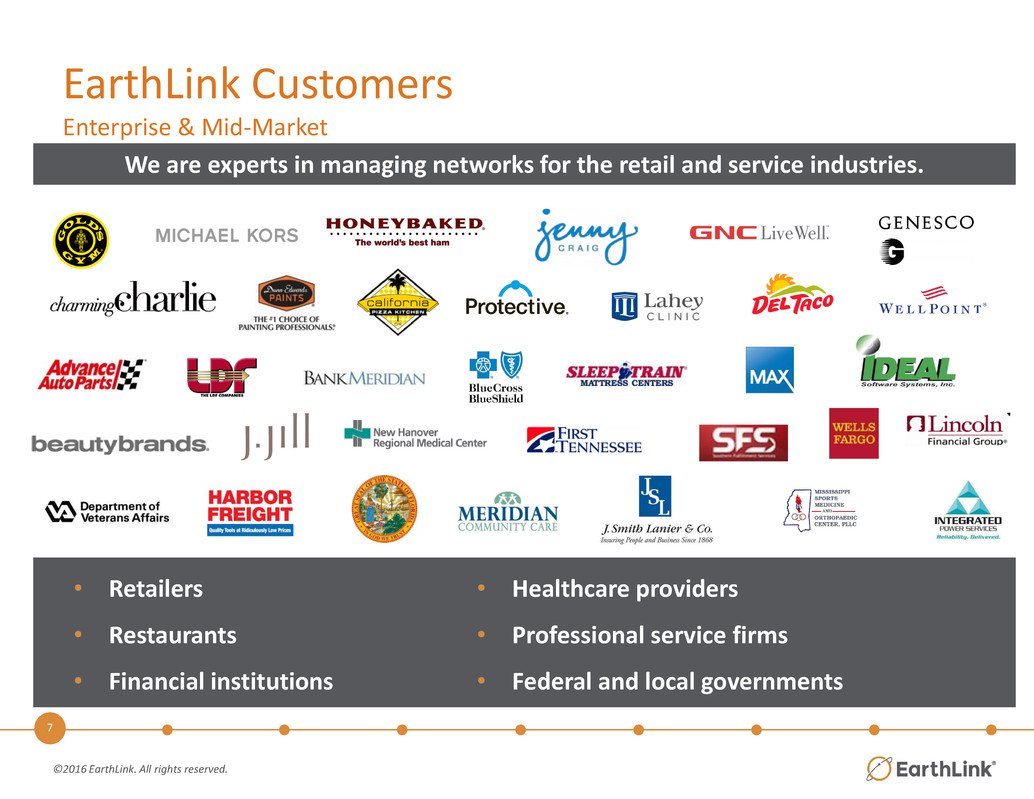
7 ©2016 EarthLink. All rights reserved. EarthLink Customers Enterprise & Mid-Market • Retailers • Restaurants • Financial institutions • Healthcare providers • Professional service firms • Federal and local governments We are experts in managing networks for the retail and service industries.

8 ©2016 EarthLink. All rights reserved. Q2 2016 Operating & Financial Results (1) Adjusted EBITDA, Adjusted EBITDA Margin and Unlevered Free Cash Flow are Non-GAAP measures. See appendix for additional information on non-GAAP measures. (2) Fully Diluted Weighted Average Shares • Gross margin rate remains ~54%, an improvement of ~400 bps since 2013 • EBITDA margin ~24%, near recent high and higher year- over-year • Second consecutive quarter of positive net income. • We produced $40M in Unlevered Free Cash Flow in the quarter $ Millions Q2 '15 Q1 '16 Q2 '16 Var to Q1 '16 Total Revenue 283.7$ 254.3$ 240.4$ (13.9)$ Cost of Revenue 127.0 115.2 110.9 (4.3) Total Gross Margin 156.6$ 139.1$ 129.5$ (9.6)$ Gross Margin % 55.2% 54.7% 53.9% -0.8% Selling, G&A Expenses 94.3 81.4 76.9 (4.5) Adjusted EBITDA (1) 66.1$ 61.7$ 56.6$ (5.1)$ Adjusted EBITDA Margin % (1) 23.3% 24.3% 23.6% -0.7% Net Income/(Loss) (9.9)$ 7.9$ 4.1$ (3.8)$ Shares Outstanding (2) 103 108 108 - Earnings Per Share (0.10)$ 0.07$ 0.04$ (0.03)$ Capital Expenditures 20.9 18.6 16.6 (2.0) Unlevered Free Cash Fl (1) 45.2 43.2 40.0 (3.2)

9 ©2016 EarthLink. All rights reserved. Approximately $680 million in Federal NOLs 29K Route Miles of Fiber ~$150 million LTM Unlevered Free Cash Flow(1) More than $900 million of recurring revenue (1) Unlevered Free Cash Flow is a Non-GAAP measure. See appendix for additional information on non-GAAP measures. More than 750K customer relationships History of disciplined cost management and cash generation EarthLink – Investment Highlights

11 ©2016 EarthLink. All rights reserved. Q2 2016 Business Unit Revenue & Gross Margin Revenue from IT services and discontinued products contributed: • $12M in Q2’15 ($8M Ent/MM and $4M Small Business) • $3M in Q1’16 ($2M Ent/MM and $1M Small Business) Settlement activity for all segments was favorable in Q2 ‘16 • Q2 ‘16 impact of settlements was less than in previous periods (details in footnote below) NOTES: • For Q2, Q3, Q4 ’15, and Q1 and Q2 ‘16, Enterprise & Mid-Market Revenue includes settlements and one-time items of $0.5M, $0.6M, $0.2M, $2.2M, and $0.2M. • For Q2, Q3, Q4 ’15, and Q1 and Q2 ‘16, Small Business revenue includes settlements of $0.3M, $0.4M, $0.5M, $0.3M and $0.2M. • For Q2, Q3, Q4 ’15, and Q1 and Q2 ‘16, Carrier/Transport Revenue includes settlements and adjustments of $0.2M, $0.3M, $0.2M, $0.6M and $0.3M. • Consumer Revenue includes revenue adjustments of $0.6M in Q2 ’15 and $0.1M in Q3 ‘15M. • For Q2, Q3, Q4 ’15, and Q1 and Q2 ‘16, Cost of Revenue for the business segments includes favorable adjustments and settlements of $3.1M, $4.1M, $2.2M, $3.9M and $3.7M. • Consumer Cost of Revenue includes unfavorable adjustments of $0.5M in Q2 ’15 and $0.2M in Q3 ‘15. Q2 2015 Q3 2015 Q4 2015 Q1 2016 Q2 2016 Revenue Enterprise & Mid-Market $114.4 $110.1 $106.2 $104.7 $97.6 Small Business 79.0 72.9 66.5 62.1 57.3 Carrier/Transport 34.1 34.2 34.3 36.1 35.1 Consumer 56.1 53.8 53.3 51.4 50.4 Total Revenues $283.7 $270.9 $260.2 $254.3 $240.4 Gross Margin Enterprise & Mid-Market $58.2 $55.5 $51.8 $53.1 $47.1 Small Business 43.9 38.8 33.6 32.4 30.1 Carrier/Transport 18.7 19.4 18.4 20.6 19.8 Consumer 35.9 34.9 34.6 32.9 32.5 Total Gross Margin $156.6 $148.5 $138.1 $139.0 $129.5 Gross Margin (%) Enterprise & Mid-Market 50.8% 50.4% 48.8% 50.7% 48.3% Small Business 55.6% 53.2% 50.5% 52.2% 52.4% Carrier/Transport 54.8% 56.7% 53.9% 57.1% 56.5% Consumer 63.9% 64.9% 64.9% 64.0% 64.4% Total Gross Margin (%) 55.2% 54.8% 53.1% 54.7% 53.9% Business Unit

12 ©2016 EarthLink. All rights reserved. Q2 2016 Balance Sheet and Cash Flow We renegotiated our credit facility in Q2 ’16 • Expanded facility to $175M • Extended maturity • Increased flexibility • After the end of the quarter, repurchased $90M in 8.875% Sr. Notes We have materially strengthened the balance sheet Including recent note redemption: • Gross debt $122M lower than Q2 ‘15 • Net debt $80M lower than Q2 15 • Annual Debt Service down $11M since Q2 ‘15 and $18M since Q4 ’14 Total debt/Adj. EBITDA ratio ~2.0x (1) On June 30, 2016, the Company entered into a $175M credit facility, replacing the $135M credit facility signed in 2013. (2) Excludes capital leases. (3) Adjusted EBITDA is a Non-GAAP measure. See appendix for additional information on non-GAAP measures. (4) The Pro Forma figures incorporate the effects of the Company’s redemption of $90M face value of its 8.875% Sr. Notes on August 4, 2016. (figures in millions) Q2 '15 Q1 '16 Q2 '16 Q2 '16 Pro Forma(4) EarthLink Cash 87$ 61$ 77$ 45$ 8 7/8% Senior Notes due 2019 204 167 167 77 (Callable at 104.4. Next call in May at 102.2) 7 3/8% Senior Secured Notes due 2020 300 300 300 300 (First call in June at 105.5) $175 M Credit Facility - (L + 325)(1) 55 - - 60 Total Debt(2) 559 467 467 437 Net Debt 472$ 406$ 390$ 392$ TTM Adjusted EBITDA(3) 239$ 241$ 234$ 234$ Total Debt/Adj. EBITDA(3) 2.3x 1.9x 2.0x 1.9x Net Debt/Adj. EBITDA(3) 2.0x 1.7x 1.7x 1.7x Annual Run Rate Debt Service 42$ 37$ 37$ 31$ TTM Adjusted EBITDA(3)/Annual Debt Svc. 5.7x 6.5x 6.3x 7.5x Cash Flow Summary (figures in millions) Q2 '16 Beginning Cash 61$ Adjusted EBITDA(3) 57 Capital Expenditures (17) Integration & Restructuring (5) Interest Payments (19) Dividends (5) Other/Changes in Net Working Capital 4 Ending Cash 77$

13 ©2016 EarthLink. All rights reserved. Product Strategy Summary P ort fol io St ra te gy Next Gen WAN UCaaS Value Added Services P ro d u ct Ex ampl e s • Conferencing (audio/video) • Collaboration services • Hosted Contact Center • Hosted Voice • SIP • Messaging • Professional Services • Security • WiFi • Cloud connect / surveillance • Network management • Already leader in Retail • Improving solutions and bundles • Expanding footprint • Success with Hosted Voice and Hosted Contact Center • Strong growth potential • Enhance value of network + • SD-WAN • IPSec VPN • APO • Hybrid WAN • MPLS
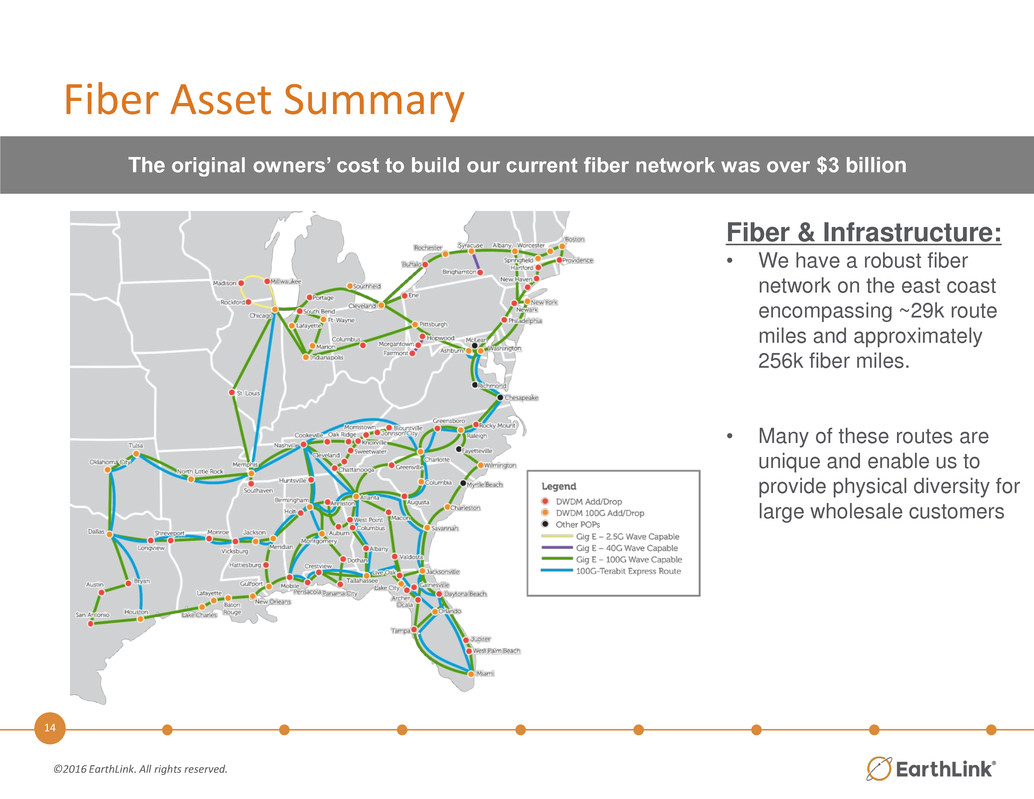
14 ©2016 EarthLink. All rights reserved. Fiber & Infrastructure: • We have a robust fiber network on the east coast encompassing ~29k route miles and approximately 256k fiber miles. • Many of these routes are unique and enable us to provide physical diversity for large wholesale customers Fiber Asset Summary The original owners’ cost to build our current fiber network was over $3 billion

15 ©2015 EarthLink. All rights reserved. EarthLink Non-GAAP Measures Adjusted EBITDA is defined as net income (loss) before interest expense and other, net, income taxes, depreciation and amortization, stock-based compensation expense, impairment of goodwill and long-lived assets, restructuring, acquisition and integration-related costs, gain on sale of business and loss on extinguishment of debt. Unlevered Free Cash Flow is defined as net income (loss) before interest expense and other, net, income taxes, depreciation and amortization, stock- based compensation expense, impairment of goodwill and long-lived assets, restructuring, acquisition and integration- related costs, gain on sale of business and loss on extinguishment of debt, less cash used for purchases of property and equipment. Adjusted EBITDA Margin is defined as Adjusted EBITDA divided by total revenue. Adjusted EBITDA, Unlevered Free Cash Flow and Adjusted EBITDA Margin are non-GAAP measures and are not determined in accordance with U.S. generally accepted accounting principles. These non-GAAP financial measures are commonly used in the industry and are presented because management believes they provide relevant and useful information to investors. Management uses these non-GAAP financial measures to evaluate the performance of its business and determine bonuses. Management believes that excluding the effects of certain non-cash and non-operating items enables investors to better understand and analyze the current period’s results and provides a better measure of comparability. There are limitations to using these non-GAAP financial measures. Adjusted EBITDA, Unlevered Free Cash Flow and Adjusted EBITDA Margin are not indicative of cash provided or used by operating activities and may differ from comparable information provided by other companies. Adjusted EBITDA, Unlevered Free Cash Flow and Adjusted EBITDA Margin should not be considered in isolation, as an alternative to, or more meaningful than measures of financial performance determined in accordance with U.S. GAAP. Non-GAAP Information

16 ©2016 EarthLink. All rights reserved. 2016 Guidance Non-GAAP Reconciliation Year Ending December 31, 2016 Net Loss $3 - $9 Interest expense and other, net 38 - 39 Gain on sale of assets (5) Income tax expense/(benefit) 1 Depreciation and amortization 137 - 138 Stock-based compensation expense 17 Restructuring, acquisition and integration-related costs 15 - 16 Loss on extinguishment of debt 4 - 5 Adjusted EBITDA $210 - $220 EarthLink Holdings Corp. Reconciliation of Adjusted EBITDA to Net Income (in millions)
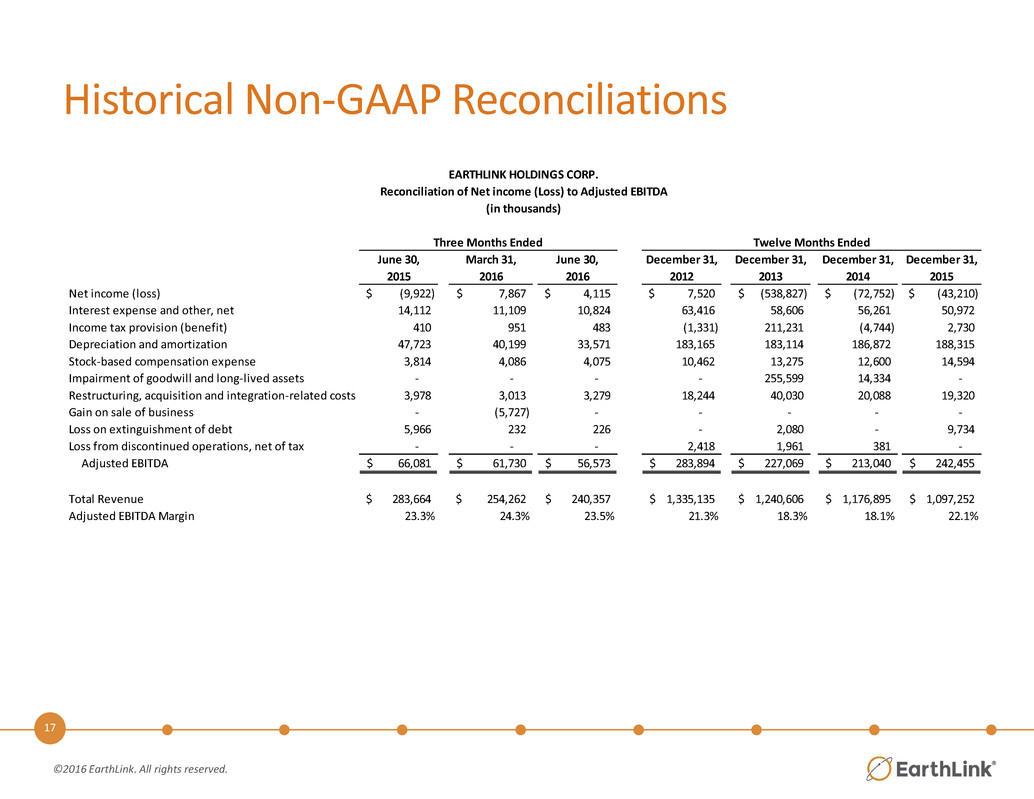
17 ©2016 EarthLink. All rights reserved. Historical Non-GAAP Reconciliations June 30, March 31, June 30, December 31, December 31, December 31, December 31, 2015 2016 2016 2012 2013 2014 2015 Net income (loss) (9,922)$ 7,867$ 4,115$ 7,520$ (538,827)$ (72,752)$ (43,210)$ Interest expense and other, net 14,112 11,109 10,824 63,416 58,606 56,261 50,972 Income tax provision (benefit) 410 951 483 (1,331) 211,231 (4,744) 2,730 Depreciation and amortization 47,723 40,199 33,571 183,165 183,114 186,872 188,315 Stock-based compensation expense 3,814 4,086 4,075 10,462 13,275 12,600 14,594 Impairment of goodwill and long-lived assets - - - - 255,599 14,334 - Restructuring, acquisition and integration-related costs 3,978 3,013 3,279 18,244 40,030 20,088 19,320 Gain on sale of business - (5,727) - - - - - L ss on extinguishment of debt 5,966 232 226 - 2,080 - 9,734 Loss from discontinued operations, net of tax - - - 2,418 1,961 381 - Adjusted EBITDA 66,081$ 61,730$ 56,573$ 283,894$ 227,069$ 213,040$ 242,455$ Total Revenue 283,664$ 254,262$ 240,357$ 1,335,135$ 1,240,606$ 1,176,895$ 1,097,252$ Adjusted EBITDA Margin 23.3% 24.3% 23.5% 21.3% 18.3% 18.1% 22.1% Three Months Ended Twelve Months Ended EARTHLINK HOLDINGS CORP. Reconciliation of Net income (Loss) to Adjusted EBITDA (in thousands)

18 ©2016 EarthLink. All rights reserved. Additional Non-GAAP Reconciliations Last Twelve Months June 30, March 31, June 30, June 30, 2015 2016 2016 2016 Net income (loss) (9,922)$ 7,867$ 4,115$ (10,823)$ Interest expense and other, net 14,112 11,109 10,824 44,856 Income tax provision 410 951 483 3,403 Depreciation and amortization 47,723 40,199 33,571 167,098 Stock-based compensation expense 3,814 4,086 4,075 15,526 Restructuring, acquisition and integration-related costs 3,978 3,013 3,279 16,262 Gain on sale of business - (5,727) - (5,727) Loss on extinguishment of debt 5,966 232 226 2,940 Purchases of property and equipment (20,873) (18,573) (16,635) (84,274) Unlevered Free Cash Flow 45,208$ 43,157$ 39,938$ 149,261$ Last Twelve Months June 30, March 31, June 30, June 30, 2015 2016 2016 2016 Net cash provided by operating activities 33,262$ 10,630$ 40,308$ 166,259$ Income tax provision 410 951 483 3,403 Non-cash income taxes (196) (298) (224) (818) Interest expense and other, net 14,112 11,109 10,824 44,856 Amortization of debt discount and issuance costs (994) (859) (861) (3,400) Restructuring, acquisition and integration-related costs 3,978 3,013 3,279 16,262 Changes in operating assets and liabilities 16,255 36,589 2,677 5,991 Purchases of property and equipment (20,873) (18,573) (16,635) (84,274) Other, net (746) 595 87 982 Unlevered Free Cash Flow 45,208$ 43,157$ 39,938$ 149,261$ Net cash (used in) provided by investing activities (20,873) 7,427 (16,635) (58,274) Net cash used in financing activities (33,080) (48,640) (7,735) (118,696) Three Months Ended Three Months Ended EARTHLINK HOLDINGS CORP. Reconciliation of Net Income (Loss) to Unlevered Free Cash Flow (in thousands) EARTHLINK HOLDINGS CORP Reconciliation of Net Cash Provided by Operating Activities to Unlevered Free Cash Flow (in thousands)
19 ©2016 EarthLink. All rights reserved. Cautionary Information Regarding Forward Looking Statements This presentation includes “forward-looking” statements (rather than historical facts) that are subject to risks and uncertainties that could cause actual results to differ materially from those described. Although we believe that the expectations expressed in these forward-looking statements are reasonable, we cannot promise that our expectations will turn out to be correct. Our actual results could be materially different from and worse than our expectations. With respect to such forward-looking statements, we seek the protections afforded by the Private Securities Litigation Reform Act of 1995. These risks include, without limitation: (1) that we may not be able to execute our strategy to successfully transition to a leading managed network, security and cloud services provider, which could adversely affect our results of operations and cash flows; (2) that we may not be able to increase revenues from our growth products and services to offset declining revenues from our traditional products and services, which could adversely affect our results of operations and cash flows; (3) that if we are unable to adapt to changes in technology and customer demands, we may not remain competitive, and our revenues and operating results could suffer; (4) that failure to achieve operating efficiencies and otherwise reduce costs would adversely affect our results of operations and cash flows; (5) that we may have to undertake further restructuring plans that would require additional charges; (6) that we may be unable to successfully divest non-strategic products, which could adversely affect our results of operations; (7) that acquisitions we complete could result in operating difficulties, dilution, increased liabilities, diversion of management attention and other adverse consequences, which could adversely affect our results of operations; (8) that we face significant competition in our business markets, which could adversely affect our results of operations; (9) that failure to retain existing customers could adversely affect our results of operations and cash flows; (10) that decisions by legislative or regulatory authorities, including the Federal Communications Commission, relieving incumbent carriers of certain regulatory requirements, and possible further deregulation in the future, may restrict our ability to provide services and may increase the costs we incur to provide these services; (11) that if we are unable to interconnect with AT&T, Verizon and other incumbent carriers on acceptable terms, our ability to offer competitively priced local telephone services will be adversely affected; (12) that the continued decline in switched access and reciprocal compensation revenue will adversely affect our results of operations; (13) that failure to obtain and maintain necessary permits and rights-of-way could interfere with our network infrastructure and operations; (14) that if our larger carrier customers terminate the service they receive from us, our wholesale revenue and results of operations could be adversely affected; (15) that we obtain a majority of our network equipment and software from a limited number of third-party suppliers; (16) that work stoppages experienced by other communications companies on whom we rely for service could adversely impact our ability to provision and service our customers; (17) that our commercial and alliance arrangements may not be renewed or may not generate expected benefits, which could adversely affect our results of operations; (18) that our consumer business is dependent on the availability of third-party network service providers; (19) that we face significant competition in the Internet access industry that could reduce our profitability; (20) that the continued decline of our consumer access subscribers will adversely affect our results of operations; (21) that lack of regulation governing wholesale Internet service providers could adversely affect our operations; (22) that cyber security breaches could harm our business; (23) that privacy concerns relating to our business could damage our reputation and deter current and potential users from using our services; (24) that interruption or failure of our network, information systems or other technologies could impair our ability to provide our services, which could damage our reputation and harm our operating results; (25) that our business depends on effective business support systems and processes; (26) that if we, or other industry participants, are unable to successfully defend against disputes or legal actions, we could face substantial liabilities or suffer harm to our financial and operational prospects; (27) that we may be accused of infringing upon the intellectual property rights of third parties, which is costly to defend and could limit our ability to use certain technologies in the future; (28) that we may not be able to protect our intellectual property; (29) that we may be unable to hire and retain sufficient qualified personnel, and the loss of any of our key executive officers could adversely affect us; (30) that unfavorable general economic conditions could harm our business; (31) that government regulations could adversely affect our business or force us to change our business practices; (32) that our business may suffer if third parties are unable to provide services or terminate their relationships with us; (33) that we may be required to recognize impairment charges on our goodwill and other intangible assets, which would adversely affect our results of operations and financial position; (34) that we may have exposure to greater than anticipated tax liabilities and we may be limited in the use of our net operating losses and certain other tax attributes in the future; (35) that our indebtedness could adversely affect our financial health and limit our ability to react to changes in our business and industry; (36) that we may require substantial capital to support business growth, and this capital may not be available to us on acceptable terms, or at all; (37) that our debt agreements include restrictive covenants, and failure to comply with these covenants could trigger acceleration of payment of outstanding indebtedness; (38) that we may reduce, or cease payment of, quarterly cash dividends; (39) that our stock price may be volatile; (40) that provisions of our certificate of incorporation, bylaws and other elements of our capital structure could limit our share price and delay a change of control of the company; and (41) that our bylaws designate the Court of Chancery of the State of Delaware as the sole and exclusive forum for certain types of actions and proceedings that may be initiated by our stockholders, which could limit our stockholders’ flexibility in obtaining a judicial forum for disputes with us or our directors, officers or employees. These risks and uncertainties, as well as other risks and uncertainties that could cause our actual results to differ significantly from management’s expectations, are not intended to represent a complete list of all risks and uncertainties inherent in our business, and should be read in conjunction with the more detailed cautionary statements and risk factors included in our Annual Report on Form 10-K and our Quarterly Report on Form 10-Q..

