Exhibit 99.2
Link to searchable text of slide shown above

Link to searchable text of slide shown above

Link to searchable text of slide shown above
Link to searchable text of slide shown above

Link to searchable text of slide shown above
Link to searchable text of slide shown above

Link to searchable text of slide shown above

Link to searchable text of slide shown above
Link to searchable text of slide shown above

Link to searchable text of slide shown above

Link to searchable text of slide shown above

Link to searchable text of slide shown above

Link to searchable text of slide shown above

Link to searchable text of slide shown above
Link to searchable text of slide shown above
Searchable text section of graphics shown above
Strategy
Utilize the largest independent broadband national network platform to drive growth
• Broaden our existing Small-Medium Enterprise (SME) products
• Expand New Edge Networks existing business into attractive new markets
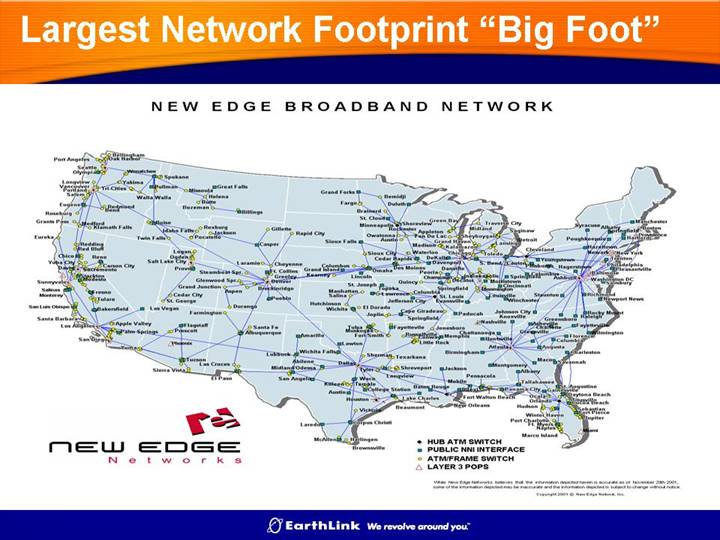
• Leverage New Edge Networks nation-wide network access (“Big Foot”)
2
New Edge Networks
Headquarters |
| Vancouver, WA |
|
|
|
Selected 2005 Data |
|
|
• Customers |
| 56,000 connections |
• Revenues |
| Approx. $120M |
• EBITDA |
| $8M to $10M Estimated |
• Employees |
| 345 |
The leading independent single-source national provider of secure multi-site managed data networks and dedicated Internet access for businesses and communications carriers
3
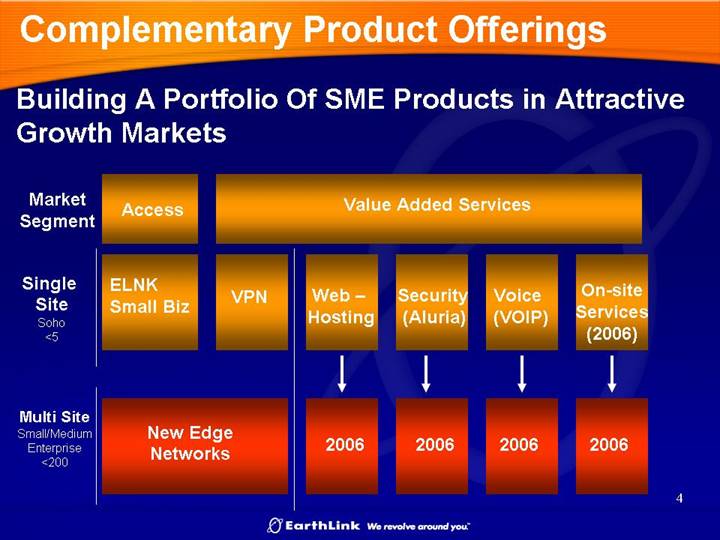
Complementary Product Offerings
Building A Portfolio Of SME Products in Attractive Growth Markets
Market | Access | Value Added Services | ||||
|
|
| ||||
Single | ELNK | VPN | Web – | Security | Voice | On-site |
Site | Small Biz |
| Hosting | (Aluria) | (VOIP) | Services |
Soho |
|
|
|
|
| (2006) |
<5 |
|
|
|
|
|
|
|
|
|
|
|
|
|
Multi Site |
|
|
|
|
|
|
Small/Medium | New Edge | 2006 | 2006 | 2006 | 2006 | |
Enterprise | Networks |
|
|
|
| |
<200 |
|
|
|
|
|
|
4
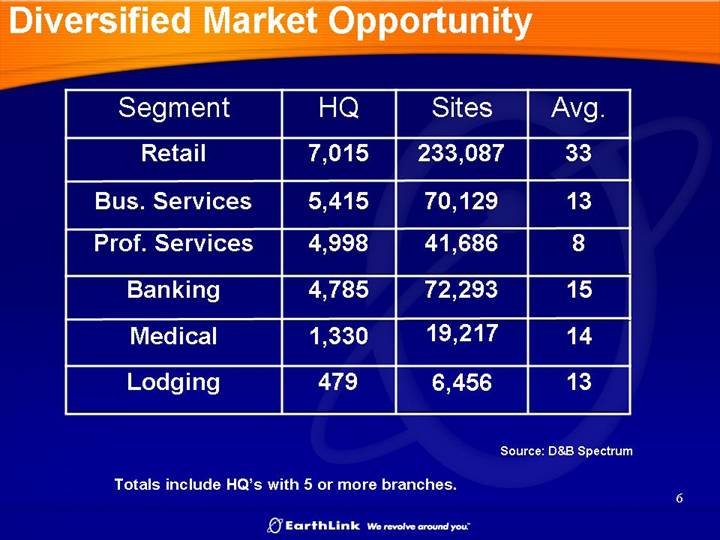
Diversified Market Opportunity
Segment |
|
| HQ |
| Sites |
| Avg. |
|
Retail |
|
| 7,015 |
| 233,087 |
| 33 |
|
Bus. Services |
|
| 5,415 |
| 70,129 |
| 13 |
|
Prof. Services |
|
| 4,998 |
| 41,686 |
| 8 |
|
Banking |
|
| 4,785 |
| 72,293 |
| 15 |
|
Medical |
|
| 1,330 |
| 19,217 |
| 14 |
|
Lodging |
|
| 479 |
| 6,456 |
| 13 |
|
Source: D&B Spectrum
Totals include HQ’s with 5 or more branches.
6
Balanced and Experienced Distribution
Retail |
| Wholesale |
|
|
|
|
|
• 100 Internal Quota Carrying Reps |
| • Large, national partners - MCI, AT&T, SBC, Bell South, etc. |
|
• Hundreds of alternate channel partners such as VAR’s, agents, equipment vendors, ISO’s, etc |
|
• 300 smaller ISP partners |
|
|
|
|
|
| |||
Benefits to New Edge | |||
| |||
• Using retail and wholesale channels increases growth | |||
| |||
• Largest customer represents less than 10% of revenues | |||
| |||
• 67% of all recurring revenues billed directly to the end user | |||
8
Largest Network Footprint “Big Foot”
NEW EDGE BROADBAND NETWORK
[GRAPHIC]
[LOGO]
While New Edge Networks believes that the information depcited herein is accurate as of November 29th 2001, some of the information depicted may be inaccurate and the information depicted is subject to change without notice.
Copyright 2001 Ó New Edge Network, Inc.
9
Acquisition Terms
• $144 M in Aggregate Consideration
• 2.6M shares of EarthLink Common Stock
• $114.3M in cash
• $60.8M to New Edge Networks equity holders
• $53.5M debt, and certain expenses and other liabilities
11
Summary
New Edge Networks will become EarthLink’s platform for growth in the SME market, providing
• Ability to expand our current SME product suite
• Access to developed channels and experienced personnel
• A unique and difficult to duplicate network asset in a fast growing market
12
Safe Harbor Statement
Certain of the statements contained in this presentation are forward-looking statements (rather than historical facts) that are subject to risks and uncertainties that could cause actual results to differ materially from those described. With respect to such forward-looking statements, the Company seeks the protections afforded by the Private Securities Litigation Reform Act of 1995. These risks include a variety of factors, including competitive and regulatory developments and risk factors listed from time to time in the Company’s SEC reports. This list is intended to identify certain of the principal factors that could cause actual results to differ materially from those described in the forward-looking statements included elsewhere herein. These factors are not intended to represent a complete list of all risks and uncertainties inherent in the Company’s business, and should be read in conjunction with the more detailed cautionary statements and risk factors included elsewhere in the Company’s most recent filings with the SEC.
Certain statements contained in this presentation about future periods are derived from business plans of EarthLink and its affiliate and are not intended to be projections of future results.
13
Use of Non-GAAP Financial Measures
Included in this presentation are certain non-GAAP financial measures that are not determined in accordance with U.S. generally accepted accounting principles. These financial performance measures are not indicative of cash provided or used by operating activities and may differ from comparable information provided by other companies, and they should not be considered in isolation, as an alternative to, or more meaningful than measures of financial performance determined in accordance with U.S. generally accepted accounting principles. These financial performance measures are commonly used in the industry and are presented because EarthLink believes they provide relevant and useful information to investors. EarthLink utilizes these financial performance measures to assess its ability to meet future capital expenditure and working capital requirements, to incur indebtedness if necessary, and to fund continued growth. EarthLink also uses these financial performance measures to evaluate the performance of its business, for budget planning purposes and as factors in its employee compensation programs. Since the elements of these financial performance measures are determined using the accrual basis of accounting and exclude the effects of certain capital, financing, acquisition-related, and facility exit costs, investors should use them to analyze and compare companies on the basis of current period operating performance.
14