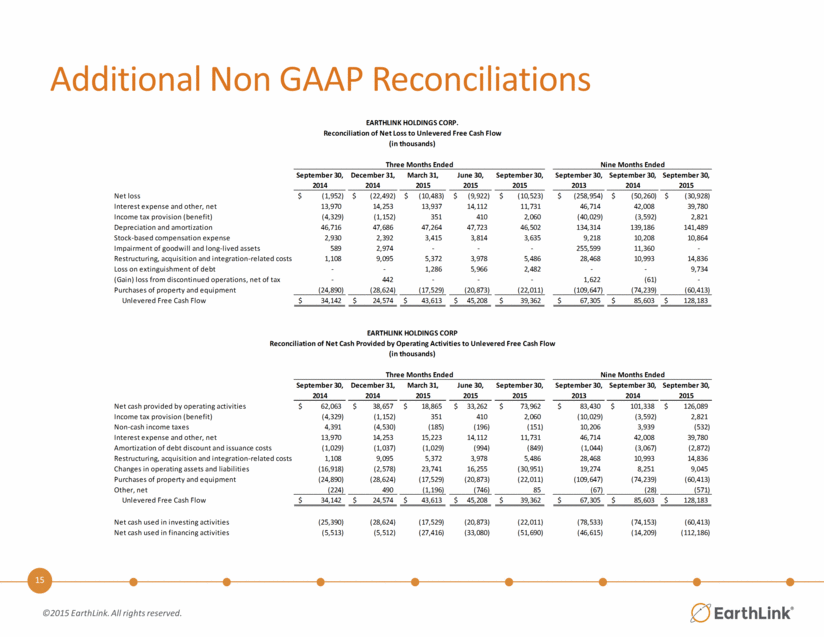
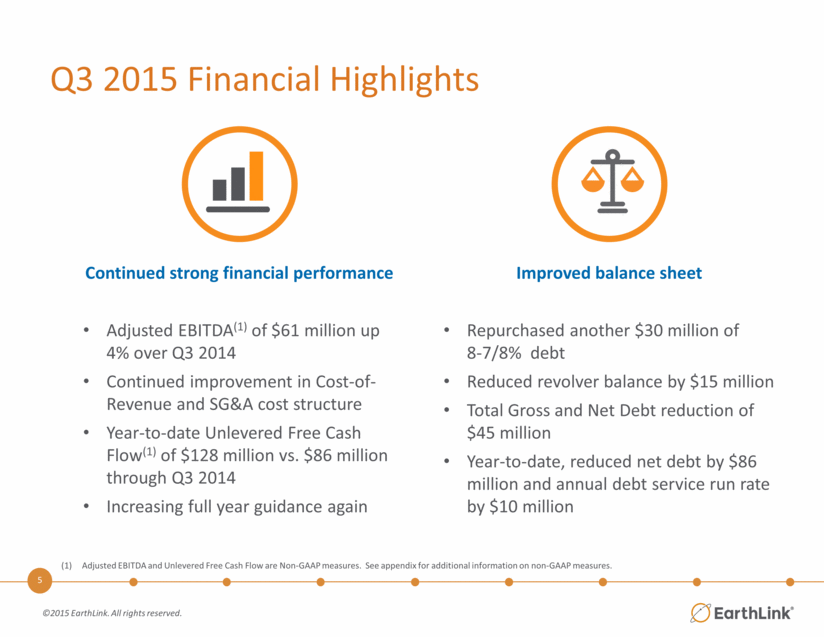
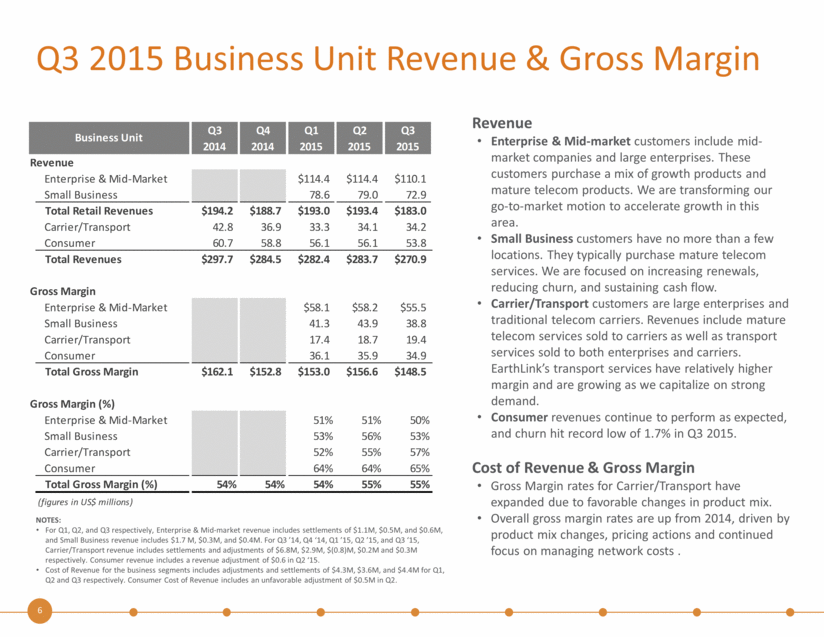
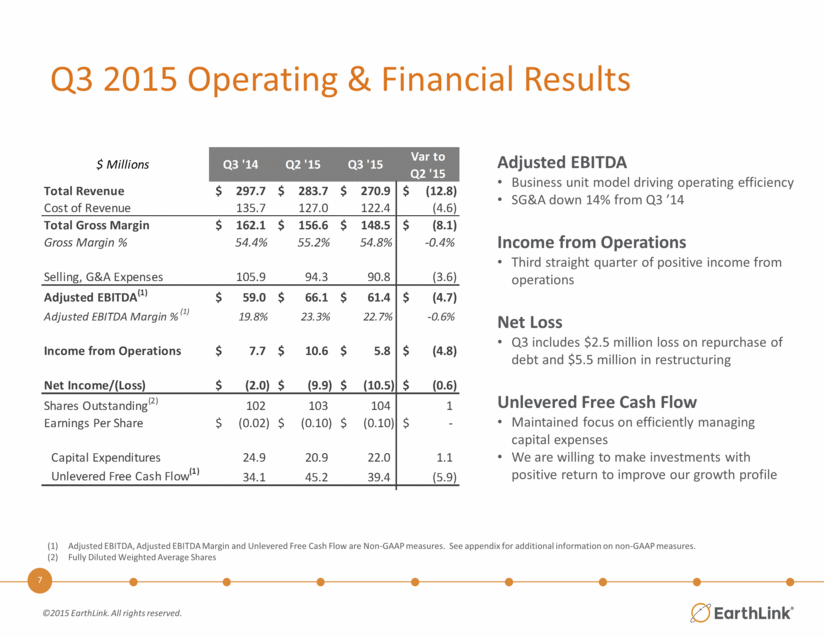
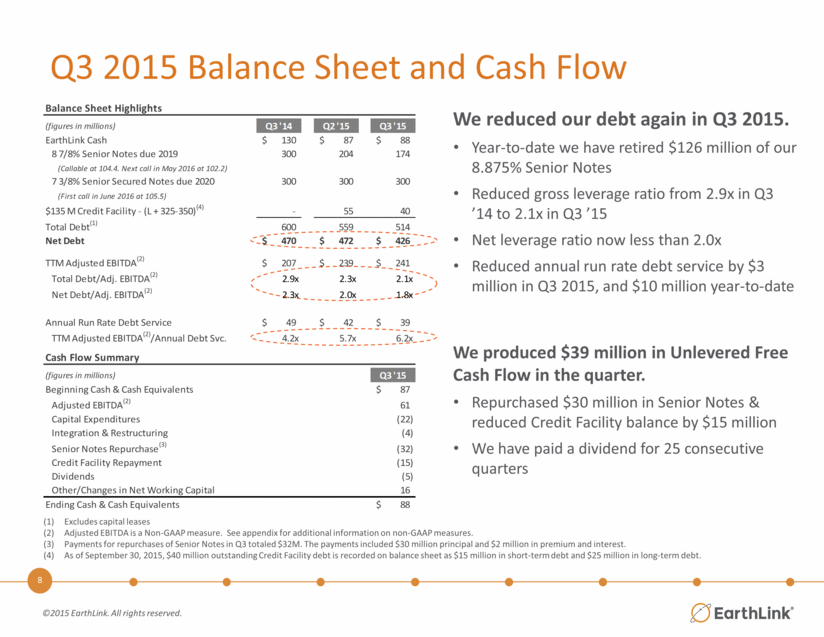
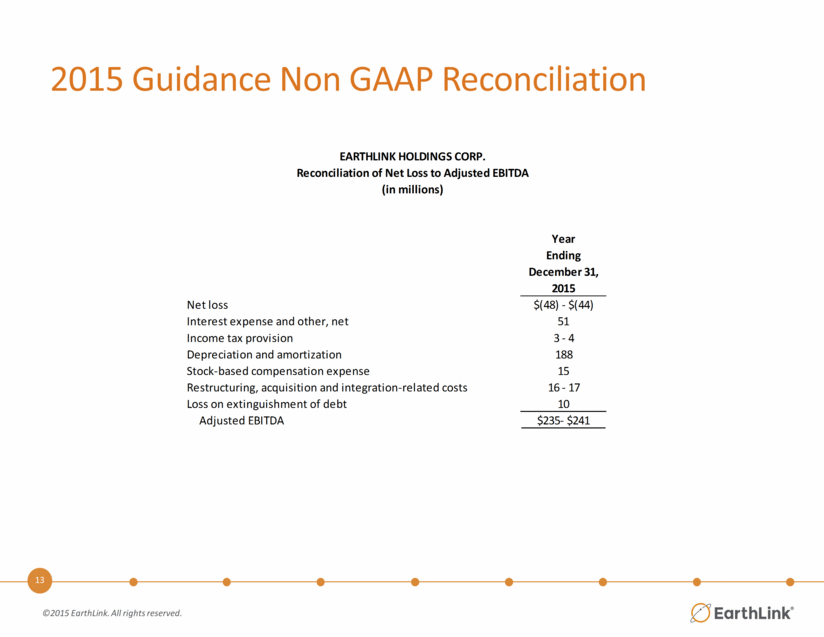
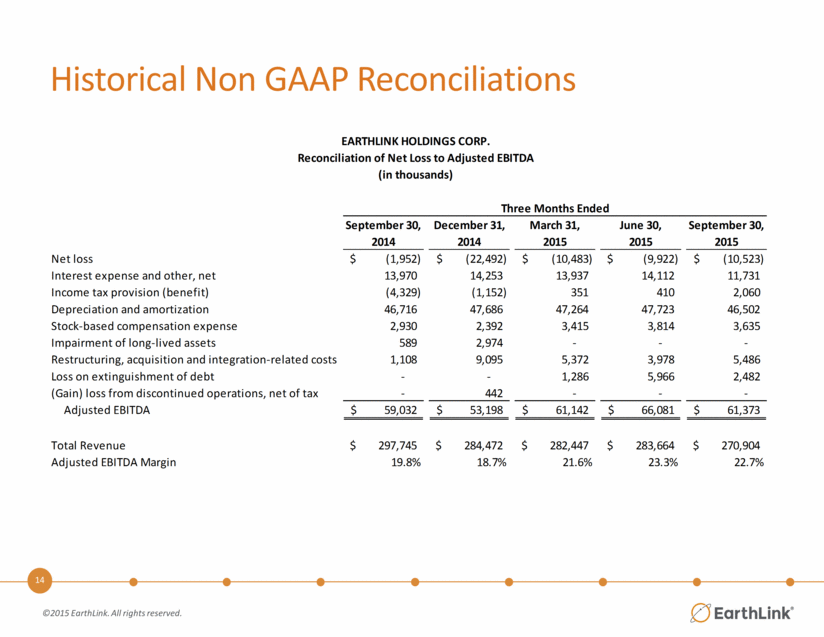
Additional Non GAAP Reconciliations September 30, December 31, March 31, June 30, September 30, September 30, September 30, September 30, 2014 2014 2015 2015 2015 2013 2014 2015 Net loss (1,952) $ (22,492) $ (10,483) $ (9,922) $ (10,523) $ (258,954) $ (50,260) $ (30,928) $ Interest expense and other, net 13,970 14,253 13,937 14,112 11,731 46,714 42,008 39,780 Income tax provision (benefit) (4,329) (1,152) 351 410 2,060 (40,029) (3,592) 2,821 Depreciation and amortization 46,716 47,686 47,264 47,723 46,502 134,314 139,186 141,489 Stock-based compensation expense 2,930 2,392 3,415 3,814 3,635 9,218 10,208 10,864 Impairment of goodwill and long-lived assets 589 2,974 - - - 255,599 11,360 - Restructuring, acquisition and integration-related costs 1,108 9,095 5,372 3,978 5,486 28,468 10,993 14,836 Loss on extinguishment of debt - - 1,286 5,966 2,482 - - 9,734 (Gain) loss from discontinued operations, net of tax - 442 - - - 1,622 (61) - Purchases of property and equipment (24,890) (28,624) (17,529) (20,873) (22,011) (109,647) (74,239) (60,413) Unlevered Free Cash Flow 34,142 $ 24,574 $ 43,613 $ 45,208 $ 39,362 $ 67,305 $ 85,603 $ 128,183 $ September 30, December 31, March 31, June 30, September 30, September 30, September 30, September 30, 2014 2014 2015 2015 2015 2013 2014 2015 Net cash provided by operating activities 62,063 $ 38,657 $ 18,865 $ 33,262 $ 73,962 $ 83,430 $ 101,338 $ 126,089 $ Income tax provision (benefit) (4,329) (1,152) 351 410 2,060 (10,029) (3,592) 2,821 Non-cash income taxes 4,391 (4,530) (185) (196) (151) 10,206 3,939 (532) Interest expense and other, net 13,970 14,253 15,223 14,112 11,731 46,714 42,008 39,780 Amortization of debt discount and issuance costs (1,029) (1,037) (1,029) (994) (849) (1,044) (3,067) (2,872) Restructuring, acquisition and integration-related costs 1,108 9,095 5,372 3,978 5,486 28,468 10,993 14,836 Changes in operating assets and liabilities (16,918) (2,578) 23,741 16,255 (30,951) 19,274 8,251 9,045 Purchases of property and equipment (24,890) (28,624) (17,529) (20,873) (22,011) (109,647) (74,239) (60,413) Other, net (224) 490 (1,196) (746) 85 (67) (28) (571) Unlevered Free Cash Flow 34,142 $ 24,574 $ 43,613 $ 45,208 $ 39,362 $ 67,305 $ 85,603 $ 128,183 $ Net cash used in investing activities (25,390) (28,624) (17,529) (20,873) (22,011) (78,533) (74,153) (60,413) Net cash used in financing activities (5,513) (5,512) (27,416) (33,080) (51,690) (46,615) (14,209) (112,186) EARTHLINK HOLDINGS CORP. Reconciliation of Net Loss to Unlevered Free Cash Flow (in thousands) Three Months Ended Nine Months Ended Three Months Ended EARTHLINK HOLDINGS CORP Reconciliation of Net Cash Provided by Operating Activities to Unlevered Free Cash Flow (in thousands) Nine Months Ended
