Exhibit 99.1
EarthLink®
EarthLink Investor Overview November 2016
Cautionary Information Regarding Forward-Looking Statements This document includes “forward-looking” statements (rather than historical facts) that are subject to risks and uncertainties that could cause actual results, including results relating to the expected timing and benefits of the proposed transaction between EarthLink Holdings Corp. (“EarthLink”) and Windstream Holdings, Inc. (“Windstream”), to differ materially from those described. Although we believe that the expectations expressed in these forward-looking statements are reasonable, we cannot promise that our expectations will turn out to be correct, and the actual results relating to the matters set forth in this document could be materially different from and worse than our expectations. Important factors that could cause actual results to differ materially from those indicated by such forward-looking statements include risks and uncertainties relating to: the ability to obtain the requisite Windstream and EarthLink stockholder approvals; the ability to satisfy the conditions to consummation of the transaction, including to obtain governmental and regulatory approvals required for the proposed transaction; the risk that required governmental and regulatory approvals may delay the proposed transaction or result in the imposition of conditions that could cause the parties to abandon the proposed transaction or materially impact the financial benefits of the proposed transaction; timing to consummate the proposed transaction; the risk that the businesses will not be integrated successfully; the risk that the cost savings and any other synergies from the proposed transaction may not be fully realized or may take longer to realize than expected; disruption from the proposed transaction making it more difficult to maintain relationships with customers, employees or suppliers; the diversion of management time on issues related to the proposed transaction; dividend policy changes for the combined company; the future cash requirements of the combined company; general worldwide economic conditions and related uncertainties; and the effect of changes in governmental regulations. The risks and uncertainties to which the forward-looking statements are subject additionally include, without limitation: (1) that the combined company may not be able to execute its strategy to successfully transition to a leading managed network, security and cloud services provider, which could adversely affect the combined company’s results of operations and cash flows; (2) that the combined company may not be able to increase revenues from growth products and services to offset declining revenues from traditional products and services, which could adversely affect the combined company’s results of operations and cash flows; (3) that if the combined company is unable to adapt to changes in technology and customer demands, the combined company may not remain competitive, and the combined company’s revenues and operating results could suffer; (4) that the combined company may not be able to achieve operating efficiencies and otherwise reduce costs or that operating efficiencies and costs reductions may take longer to achieve than expected; (5) that the combined company may have to undertake further restructuring plans that would require additional charges; (6) that the combined company may be unable to successfully divest non-strategic products, which could adversely affect the combined company’s results of operations; (7) that acquisitions the combined company completes could result in operating difficulties, dilution, increased liabilities, diversion of management attention and other adverse consequences, which could adversely affect the combined company’s results of operations; (8) that the combined company will face significant competition in its business markets, which could adversely affect the combined company’s results of operations; (9) that the combined company could fail to retain existing customers, which could adversely affect the combined company’s results of operations and cash flows; (10) that decisions by legislative or regulatory authorities, including the Federal Communications Commission, relieving incumbent carriers of certain regulatory requirements, and possible further deregulation in the future, may restrict the combined company’s ability to provide services and may increase the costs to provide these services; (11) that if the combined company is unable to interconnect with AT&T, Verizon and other incumbent carriers on acceptable terms, the combined company’s ability to offer competitively priced local telephone services will be adversely affected; (12) that the continued decline in switched access and reciprocal compensation revenue will adversely affect the combined company’s results of operations; (13) that failure to obtain and maintain necessary permits and rights-of-way could interfere with the combined company’s network infrastructure and operations; (14) that if the combined company’s larger carrier customers terminate the service they receive from the combined company, its wholesale revenue and results of operations could be adversely affected; (15) that the combined company will obtain a majority of its network equipment and software from a limited number of third-party suppliers; (16) that work stoppages experienced by other communications companies on whom the combined company will rely for service could adversely impact its ability to provision and service customers; (17) that the combined company’s commercial and alliance arrangements may not be renewed or may not generate expected benefits, which could adversely affect the combined company’s results of operations; (18) that the combined company’s consumer business is dependent on the availability of third-party network service providers; (19) that the combined company will face significant competition in the Internet access industry that could reduce profitability or make the combined company’s products less desirable; (20) that the decline of the combined company’s consumer access subscribers may adversely affect results of operations; (21) that lack of regulation governing wholesale Internet service providers could adversely affect the combined company’s operations; (22) that cyber security breaches could harm the combined company’s business; (23) that privacy concerns relating to the combined company’s business could damage its reputation and deter current and potential users from using its services; (24) that interruption or failure of the combined company’s network, information systems or other technologies could impair the combined company’s ability to provide services, which could damage the combined company’s reputation and harm its operating results; (25) that the combined company’s business will depend on effective business support systems and processes; (26) that if the combined company or other industry participants are unable to successfully defend against disputes or legal actions, the combined company could face substantial liabilities or suffer harm to its financial and operational prospects; (27) that the combined company may be accused of infringing upon the intellectual property rights of third parties, which is costly to defend and could limit our or the combined company’s ability to use certain technologies in the future; (28) that the combined company may not be able to protect its intellectual property; (29) that the combined company may be unable to hire and retain sufficient qualified personnel; (30) that unfavorable general economic conditions could harm the combined company’s business; (31) that government regulations could adversely affect the combined company’s business or force it to change our or its business practices; (32) that the combined company’s business may suffer if third parties are unable to provide services or terminate their relationships with the combined company; (33) that the combined company may be required to recognize impairment charges on goodwill and other intangible assets, which could adversely affect the combined company’s results of operations and financial position; (34) that the combined company may have exposure to greater than anticipated tax liabilities and the combined company may be limited in the use of our net operating losses and certain other tax attributes in the future; (35) that the combined company’s indebtedness could adversely affect its financial health and limit its ability to react to changes in its business and industry; (36) that the combined company may require substantial capital to support business growth, and this capital may not be available on acceptable terms, or at all; (37) that the combined company’s debt agreements will include restrictive covenants, and failure to comply with these covenants could trigger acceleration of payment of outstanding indebtedness; (38) that the combined company may reduce, or cease payment of, quarterly cash dividends; (39) that the combined company’s stock price may be volatile; (40) that provisions of the combined company’s certificate of incorporation and bylaws, and other elements of the combined company’s capital structure, could limit the combined company’s share price and delay a change of control of the combined company; (41) that our bylaws designate, and the combined company’s bylaws will designate, the Court of Chancery of the State of Delaware as the sole and exclusive forum for certain types of actions and proceedings that may be initiated by our or its stockholders, which could limit stockholders’ flexibility in obtaining a judicial forum for disputes with us or our, or with the combined company and its, directors, officers or employees; and (42) other risk factors and cautionary statements as detailed from time to time in each of our and Windstream’s reports filed with the U.S. Securities and Exchange Commission (the “SEC”). These risks and uncertainties, as well as other or new risks and uncertainties that may emerge from time to time impacting the proposed transaction or the combined company, are not intended to represent a complete list of all risks and uncertainties inherent in the proposed transaction or the business of the combined company. There can be no assurance that the proposed transaction or any other transaction described above will in fact be consummated in the manner described, or at all. You should not place undue reliance on these forward-looking statements, which speak only as of the date of this document. Unless legally required, EarthLink and Windstream undertake no obligation, and each expressly disclaims any such obligation, to update any forward-looking statements, whether as a result of new information, future events or otherwise.
NO OFFER OR SOLICITATION The information in this communication is for informational purposes only and is neither an offer to purchase, nor a solicitation of an offer to sell, subscribe for or buy any securities or the solicitation of any vote or approval in any jurisdiction pursuant to or in connection with the proposed transactions or otherwise, nor shall there be any sale, issuance or transfer of securities in any jurisdiction in contravention of applicable law. No offer of securities shall be made except by means of a prospectus meeting the requirements of Section 10 of the Securities Act of 1933, as amended, and otherwise in accordance with applicable law. ADDITIONAL INFORMATION AND WHERE TO FIND IT EarthLink and Windstream plan to submit the proposed transaction to their respective stockholders for their consideration. In connection with the proposed transaction, Windstream plans to file with the SEC a registration statement on Form S-4 (the “Registration Statement”), which will include a prospectus with respect to the shares to be issued in the proposed transaction and a preliminary and definitive joint proxy statement for the stockholders of EarthLink and Windstream (the “Joint Proxy Statement”), and each of EarthLink and Windstream plan to mail the Joint Proxy Statement to their respective stockholders and file other documents regarding the proposed transaction with the SEC. The definitive Registration Statement and the Joint Proxy Statement will contain important information about the proposed transaction and related matters. SECURITY HOLDERS ARE URGED AND ADVISED TO READ THE REGISTRATION STATEMENT AND THE JOINT PROXY STATEMENT CAREFULLY WHEN THEY BECOME AVAILABLE, AS WELL AS ANY OTHER RELEVANT DOCUMENTS FILED WITH THE SEC AND ANY AMENDMENTS OR SUPPLEMENTS TO THOSE DOCUMENTS, BECAUSE THEY WILL CONTAIN IMPORTANT INFORMATION. The Registration Statement, the Joint Proxy Statement and other relevant materials (when they become available) and any other documents filed or furnished by EarthLink or Windstream with the SEC may be obtained free of charge at the SEC's web site at www.sec.gov. PARTICIPANTS IN THE SOLICITATION EarthLink, Windstream, their respective directors and certain of their executive officers and employees may be deemed to be participants in the solicitation of proxies in connection with the proposed transaction. Information about EarthLink's directors and executive officers is set forth in its definitive proxy statement for its 2016 Annual Meeting of Stockholders, which was filed with the SEC on March 15, 2016, and information about Windstream's directors and executive officers is set forth in its definitive proxy statement for its 2016 Annual Meeting of Stockholders, which was filed with the SEC on April 1, 2016. These documents are available free of charge from the sources indicated above, from EarthLink by going to its investor relations page on its corporate website at www.earthlink.com and from Windstream by going to its investor relations page on its corporate website at www.windstream.com. Additional information regarding the interests of participants in the solicitation of proxies in connection with the proposed transaction will be included in the Registration Statement, the Joint Proxy Statement and other relevant materials EarthLink and Windstream intend to file with the SEC.
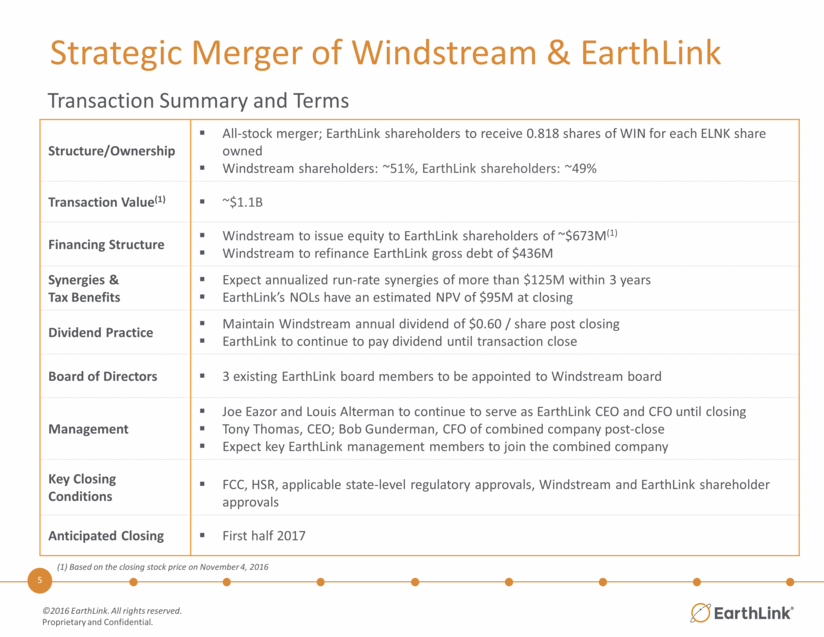
Strategic Merger of Windstream & EarthLink Structure/Ownership All-stock merger; EarthLink shareholders to receive 0.818 shares of WIN for each ELNK share owned Windstream shareholders: ~51%, EarthLink shareholders: ~49% Transaction Value(1) ~$1.1B Financing Structure Windstream to issue equity to EarthLink shareholders of ~$673M(1) Windstream to refinance EarthLink gross debt of $436M Synergies & Tax Benefits Expect annualized run-rate synergies of more than $125M within 3 years EarthLink’s NOLs have an estimated NPV of $95M at closing Dividend Practice Maintain Windstream annual dividend of $0.60 / share post closing EarthLink to continue to pay dividend until transaction close Board of Directors 3 existing EarthLink board members to be appointed to Windstream board Management Joe Eazor and Louis Alterman to continue to serve as EarthLink CEO and CFO until closing Tony Thomas, CEO; Bob Gunderman, CFO of combined company post-close Expect key EarthLink management members to join the combined company Key Closing Conditions FCC, HSR, applicable state-level regulatory approvals, Windstream and EarthLink shareholder approvals Anticipated Closing First half 2017 (1) Based on the closing stock price on November 4, 2016 Transaction Summary and Terms
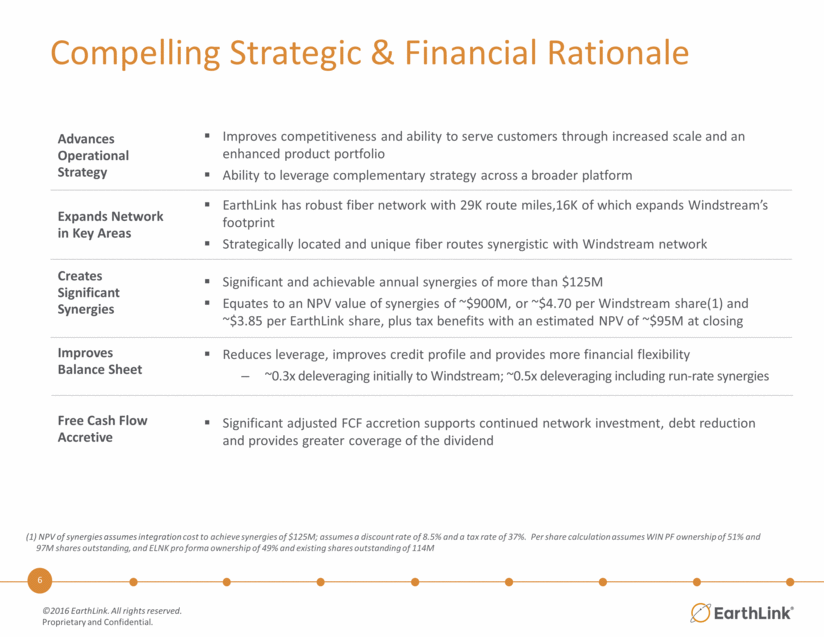
Compelling Strategic & Financial Rationale Improves Balance Sheet Creates Significant Synergies Expands Network in Key Areas Advances Operational Strategy EarthLink has robust fiber network with 29K route miles,16K of which expands Windstream’s footprint Strategically located and unique fiber routes synergistic with Windstream network Significant and achievable annual synergies of more than $125M Equates to an NPV value of synergies of ~$900M, or ~$4.70 per Windstream share(1) and ~$3.85 per EarthLink share, plus tax benefits with an estimated NPV of ~$95M at closing Reduces leverage, improves credit profile and provides more financial flexibility ~0.3x deleveraging initially to Windstream; ~0.5x deleveraging including run-rate synergies Significant adjusted FCF accretion supports continued network investment, debt reduction and provides greater coverage of the dividend Free Cash Flow Accretive Improves competitiveness and ability to serve customers through increased scale and an enhanced product portfolio Ability to leverage complementary strategy across a broader platform (1) NPV of synergies assumes integration cost to achieve synergies of $125M; assumes a discount rate of 8.5% and a tax rate of 37%. Per share calculation assumes WIN PF ownership of 51% and 97M shares outstanding, and ELNK pro forma ownership of 49% and existing shares outstanding of 114M
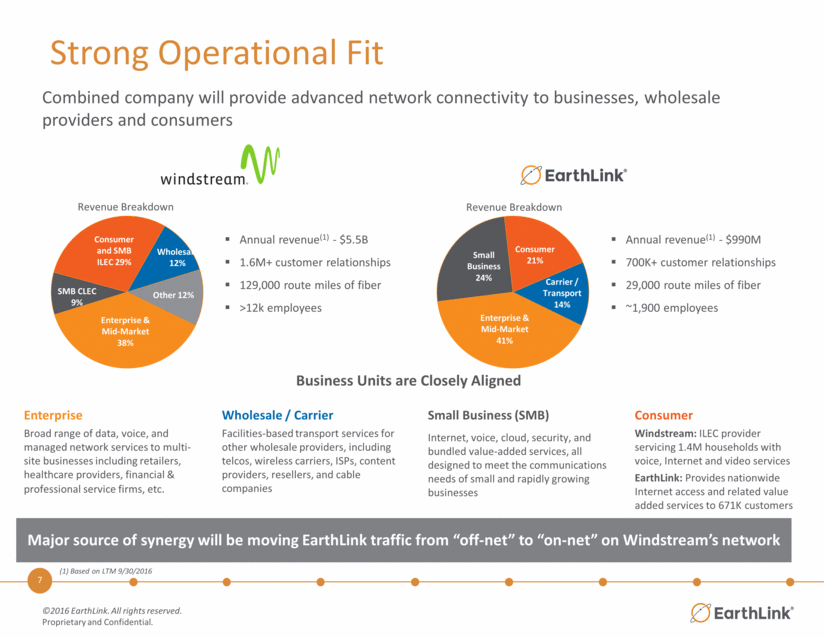
Combined company will provide advanced network connectivity to businesses, wholesale providers and consumers Enterprise Broad range of data, voice, and managed network services to multi-site businesses including retailers, healthcare providers, financial & professional service firms, etc. Annual revenue(1) - $990M 700K+ customer relationships 29,000 route miles of fiber ~1,900 employees Consumer Windstream: ILEC provider servicing 1.4M households with voice, Internet and video services EarthLink: Provides nationwide Internet access and related value added services to 671K customers Business Units are Closely Aligned Wholesale / Carrier Facilities-based transport services for other wholesale providers, including telcos, wireless carriers, ISPs, content providers, resellers, and cable companies Small Business (SMB) Internet, voice, cloud, security, and bundled value-added services, all designed to meet the communications needs of small and rapidly growing businesses Annual revenue(1) - $5.5B 1.6M+ customer relationships 129,000 route miles of fiber >12k employees (1) Based on LTM 9/30/2016 Revenue Breakdown Revenue Breakdown Strong Operational Fit Major source of synergy will be moving EarthLink traffic from “off-net” to “on-net” on Windstream’s network Enterprise & Mid - Market 41% Small Business 24% Consumer 21% Carrier / Transport 14% Enterprise & Mid - Market 38% SMB CLEC 9% Consumer and SMB ILEC 29% Wholesale 12% Other 12%
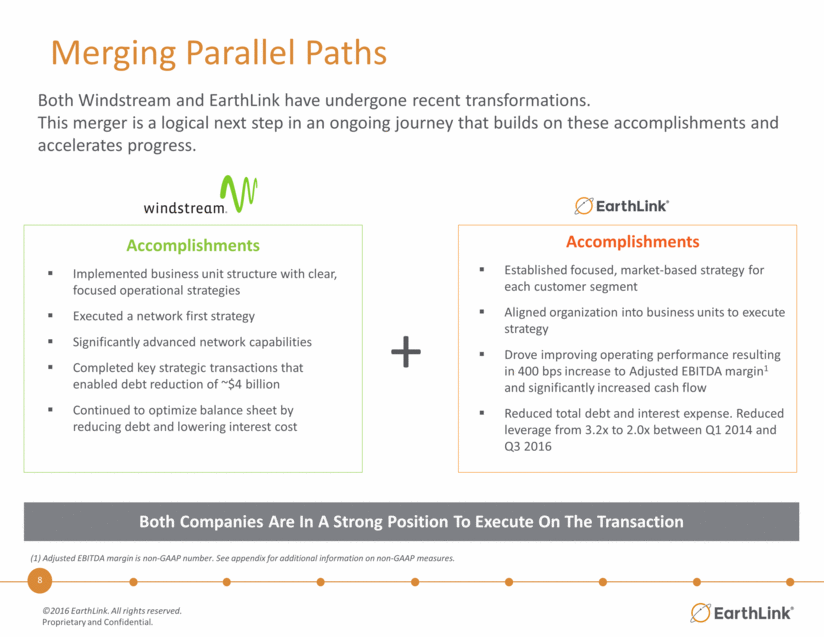
Merging Parallel Paths Both Companies Are In A Strong Position To Execute On The Transaction Both Windstream and EarthLink have undergone recent transformations. This merger is a logical next step in an ongoing journey that builds on these accomplishments and accelerates progress. Accomplishments Established focused, market-based strategy for each customer segment Aligned organization into business units to execute strategy Drove improving operating performance resulting in 400 bps increase to Adjusted EBITDA margin1 and significantly increased cash flow Reduced total debt and interest expense. Reduced leverage from 3.2x to 2.0x between Q1 2014 and Q3 2016 Accomplishments Implemented business unit structure with clear, focused operational strategies Executed a network first strategy Significantly advanced network capabilities Completed key strategic transactions that enabled debt reduction of ~$4 billion Continued to optimize balance sheet by reducing debt and lowering interest cost + (1) Adjusted EBITDA margin is non-GAAP number. See appendix for additional information on non-GAAP measures.
Combined Network Assets Key Highlights Combined network with 145,000 metro and intercity route miles of fiber Adds strategic routes in the southeast & the northeast that can be leveraged across the nationwide footprint Extensive national footprint improves the cost structure and provides new sales opportunities Combined expanded National IP network multiplies SD-WAN availability Nationwide Network With Deep Fiber Footprint Note: Includes Windstream’s announced fixed wireless and Western fiber expansion
EarthLink®
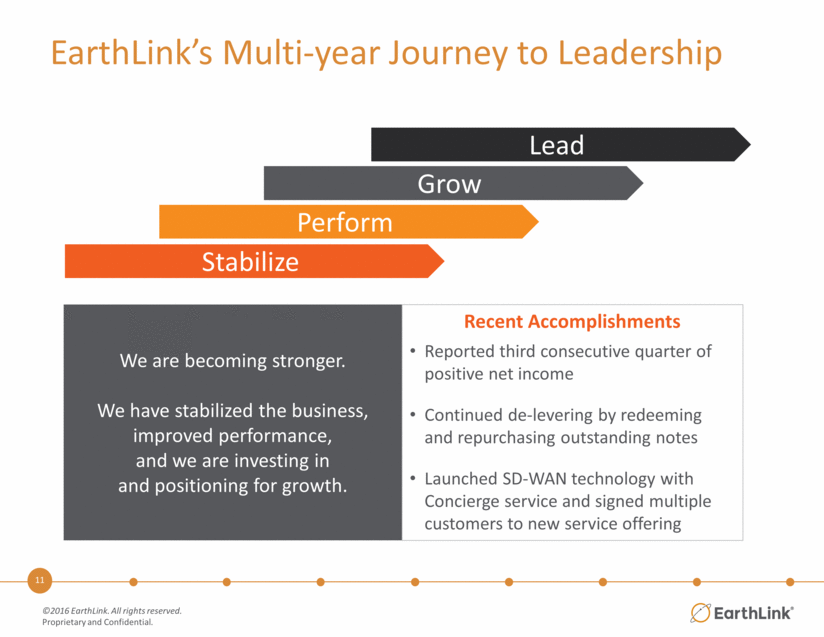
EarthLink’s Multi-year Journey to Leadership We are becoming stronger. We have stabilized the business, improved performance, and we are investing in and positioning for growth. Lead Grow Perform Stabilize Recent Accomplishments Reported third consecutive quarter of positive net income Continued de-levering by redeeming and repurchasing outstanding notes Launched SD-WAN technology with Concierge service and signed multiple customers to new service offering
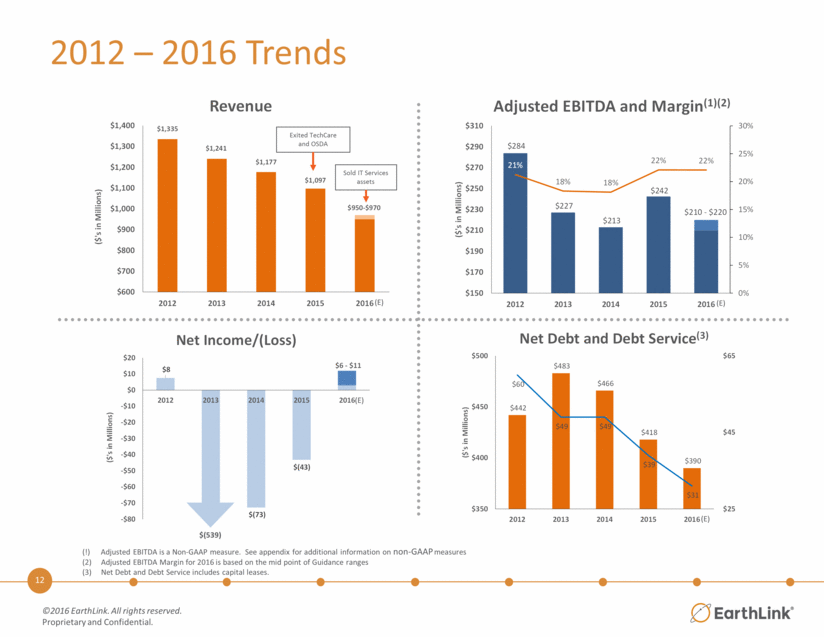
2012 – 2016 Trends (!) Adjusted EBITDA is a Non-GAAP measure. See appendix for additional information on non-GAAP measures Adjusted EBITDA Margin for 2016 is based on the mid point of Guidance ranges Net Debt and Debt Service includes capital leases. Exited TechCare and OSDA Sold IT Services assets $(539) (E) (E) (E) (E) $284 $227 $213 $242 21% 18% 18% 22% 22% 0% 5% 10% 15% 20% 25% 30% $150 $170 $190 $210 $230 $250 $270 $290 $310 2012 2013 2014 2015 2016 ($'s in Millions) Adjusted EBITDA and Margin (1)(2) $210 - $220 $1,335 $1,241 $1,177 $1,097 $950 - $970 $600 $700 $800 $900 $1,000 $1,100 $1,200 $1,300 $1,400 2012 2013 2014 2015 2016 ($'s in Millions) Revenue $8 $(73) $(43) -$80 -$70 -$60 -$50 -$40 -$30 -$20 -$10 $0 $10 $20 2012 2013 2014 2015 2016 ($'s in Millions) Net Income/(Loss) $6 - $11 $442 $483 $466 $418 $390 $60 $49 $49 $39 $31 $25 $45 $65 $350 $400 $450 $500 2012 2013 2014 2015 2016 ($'s in Millions) Net Debt and Debt Service (3)
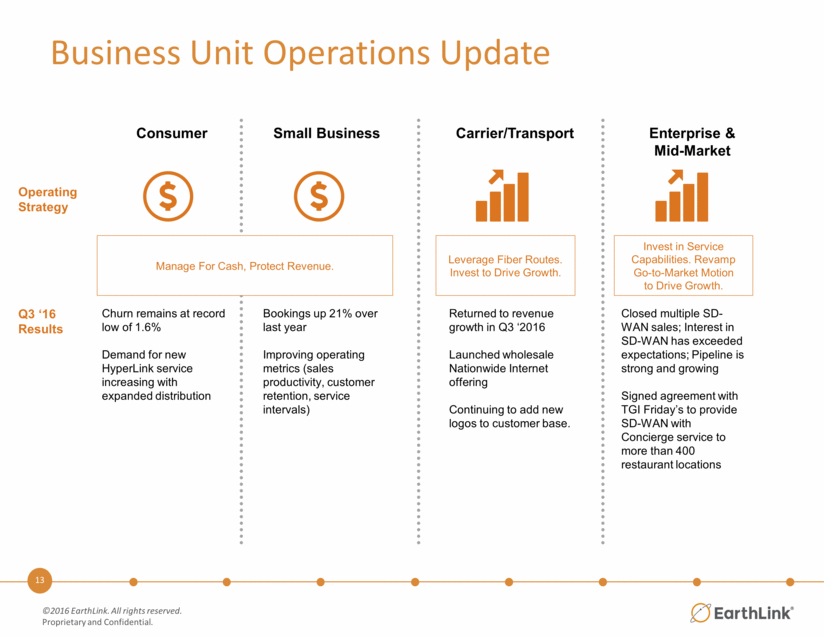
Business Unit Operations Update Operating Strategy Churn remains at record low of 1.6% Demand for new HyperLink service increasing with expanded distribution Q3 ‘16 Results Manage For Cash, Protect Revenue. Bookings up 21% over last year Improving operating metrics (sales productivity, customer retention, service intervals) Closed multiple SD-WAN sales; Interest in SD-WAN has exceeded expectations; Pipeline is strong and growing Signed agreement with TGI Friday’s to provide SD-WAN with Concierge service to more than 400 restaurant locations Leverage Fiber Routes. Invest to Drive Growth. Invest in Service Capabilities. Revamp Go-to-Market Motion to Drive Growth. Returned to revenue growth in Q3 ‘2016 Launched wholesale Nationwide Internet offering Continuing to add new logos to customer base. Consumer Small Business Carrier/Transport Enterprise & Mid-Market
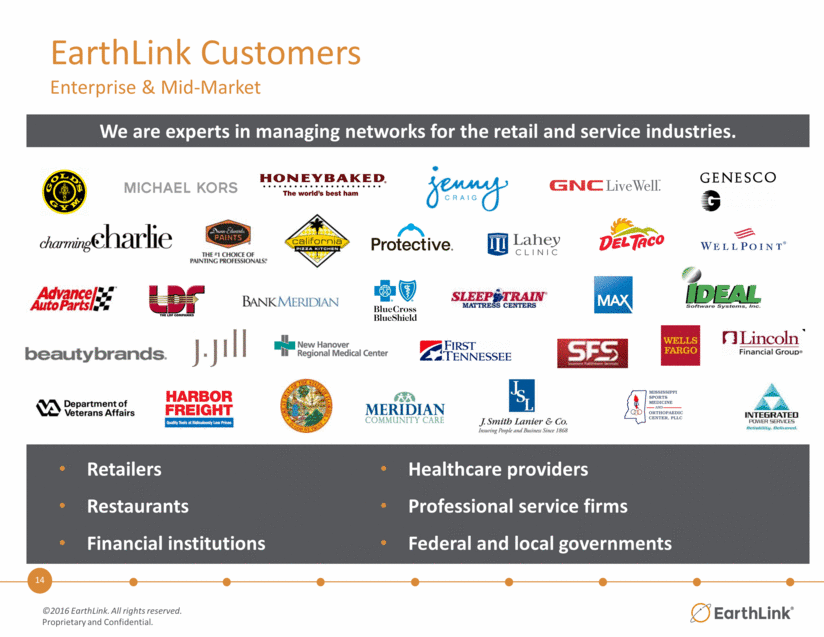
EarthLink Customers Enterprise & Mid-Market Retailers Restaurants Financial institutions Healthcare providers Professional service firms Federal and local governments We are experts in managing networks for the retail and service industries.
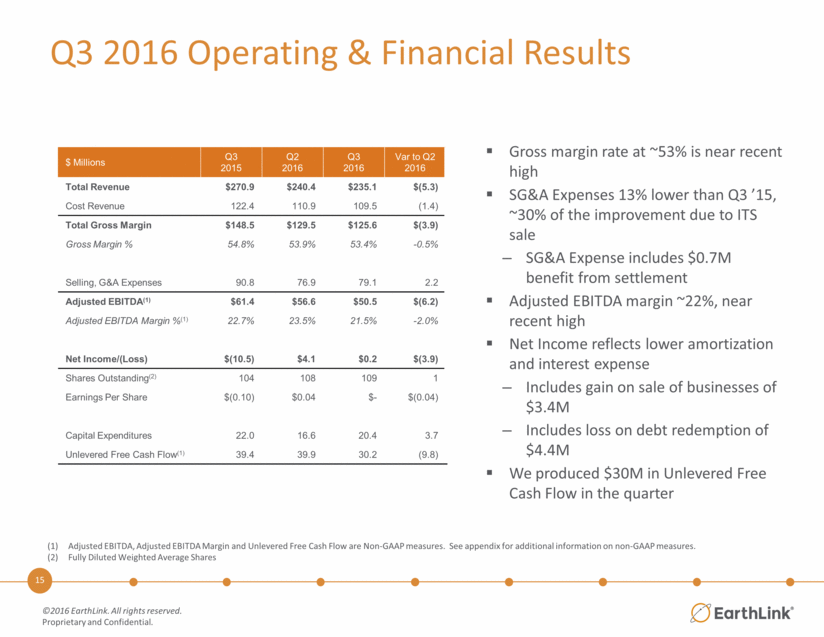
Q3 2016 Operating & Financial Results Adjusted EBITDA, Adjusted EBITDA Margin and Unlevered Free Cash Flow are Non-GAAP measures. See appendix for additional information on non-GAAP measures. Fully Diluted Weighted Average Shares Gross margin rate at ~53% is near recent high SG&A Expenses 13% lower than Q3 ’15, ~30% of the improvement due to ITS sale SG&A Expense includes $0.7M benefit from settlement Adjusted EBITDA margin ~22%, near recent high Net Income reflects lower amortization and interest expense Includes gain on sale of businesses of $3.4M Includes loss on debt redemption of $4.4M We produced $30M in Unlevered Free Cash Flow in the quarter $ Millions Q3 2015 Q2 2016 Q3 2016 Var to Q2 2016 Total Revenue $270.9 $240.4 $235.1 $(5.3) Cost Revenue 122.4 110.9 109.5 (1.4) Total Gross Margin $148.5 $129.5 $125.6 $(3.9) Gross Margin % 54.8% 53.9% 53.4% -0.5% Selling, G&A Expenses 90.8 76.9 79.1 2.2 Adjusted EBITDA(1) $61.4 $56.6 $50.5 $(6.2) Adjusted EBITDA Margin %(1) 22.7% 23.5% 21.5% -2.0% Net Income/(Loss) $(10.5) $4.1 $0.2 $(3.9) Shares Outstanding(2) 104 108 109 1 Earnings Per Share $(0.10) $0.04 $- $(0.04) Capital Expenditures 22.0 16.6 20.4 3.7 Unlevered Free Cash Flow(1) 39.4 39.9 30.2 (9.8)
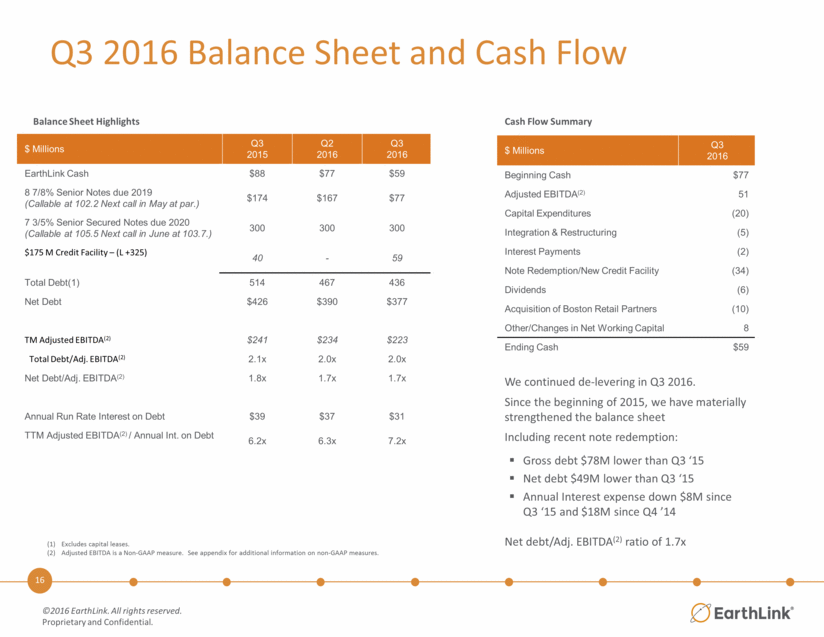
Q3 2016 Balance Sheet and Cash Flow $ Millions Q3 2015 Q2 2016 Q3 2016 EarthLink Cash $88 $77 $59 8 7/8% Senior Notes due 2019 (Callable at 102.2 Next call in May at par.) $174 $167 $77 7 3/5% Senior Secured Notes due 2020 (Callable at 105.5 Next call in June at 103.7.) 300 300 300 $175 M Credit Facility – (L +325) 40 - 59 Total Debt(1) 514 467 436 Net Debt $426 $390 $377 TM Adjusted EBITDA(2) $241 $234 $223 Total Debt/Adj. EBITDA(2) 2.1x 2.0x 2.0x Net Debt/Adj. EBITDA(2) 1.8x 1.7x 1.7x Annual Run Rate Interest on Debt $39 $37 $31 TTM Adjusted EBITDA(2) / Annual Int. on Debt 6.2x 6.3x 7.2x Balance Sheet Highlights Excludes capital leases. Adjusted EBITDA is a Non-GAAP measure. See appendix for additional information on non-GAAP measures. $ Millions Q3 2016 Beginning Cash $77 Adjusted EBITDA(2) 51 Capital Expenditures (20) Integration & Restructuring (5) Interest Payments (2) Note Redemption/New Credit Facility (34) Dividends (6) Acquisition of Boston Retail Partners (10) Other/Changes in Net Working Capital 8 Ending Cash $59 Cash Flow Summary We continued de-levering in Q3 2016. Since the beginning of 2015, we have materially strengthened the balance sheet Including recent note redemption: Gross debt $78M lower than Q3 ‘15 Net debt $49M lower than Q3 ‘15 Annual Interest expense down $8M since Q3 ‘15 and $18M since Q4 ’14 Net debt/Adj. EBITDA(2) ratio of 1.7x
Guidance as of February 2016 Revised Guidance as of May 2016 Revised Guidance as of August 2016 Revised Guidance as of November 2016 $ Millions Low High Low High Low High Low High Revenue $950 $975 $950 $975 $950 $970 $950 $970 Adjusted EBITDA(1) $205 $220 $205 $220 $210 $220 $210 $220 Capital Expenditures $85 $105 $85 $105 $85 $95 $80 $90 Net Income/(Loss) $(7) $1 $(1) $5 $3 $9 $6 $11 2016 Full Year Guidance Adjusted EBITDA is a Non-GAAP measure. See appendix for additional information on non-GAAP measures
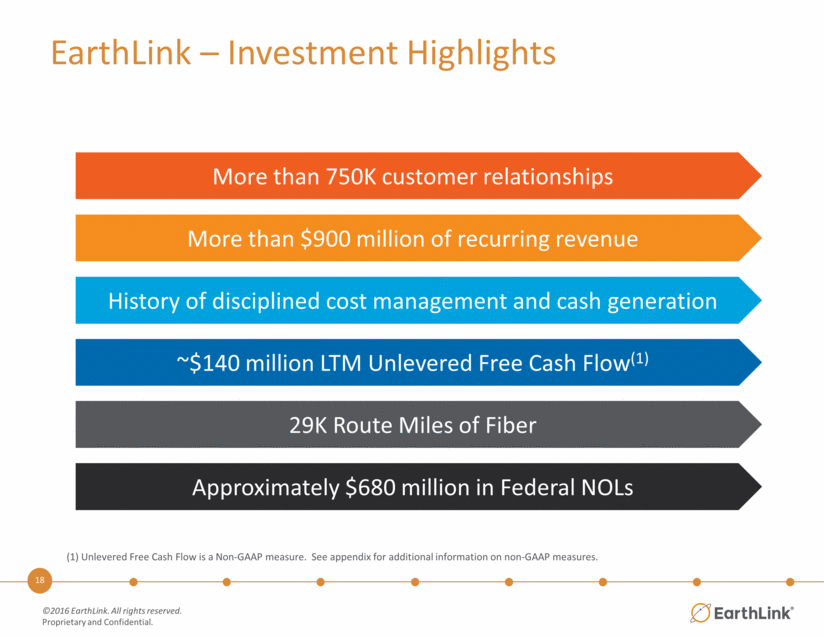
Approximately $680 million in Federal NOLs 29K Route Miles of Fiber ~$140 million LTM Unlevered Free Cash Flow(1) More than $900 million of recurring revenue Unlevered Free Cash Flow is a Non-GAAP measure. See appendix for additional information on non-GAAP measures. More than 750K customer relationships History of disciplined cost management and cash generation EarthLink – Investment Highlights
EarthLink®
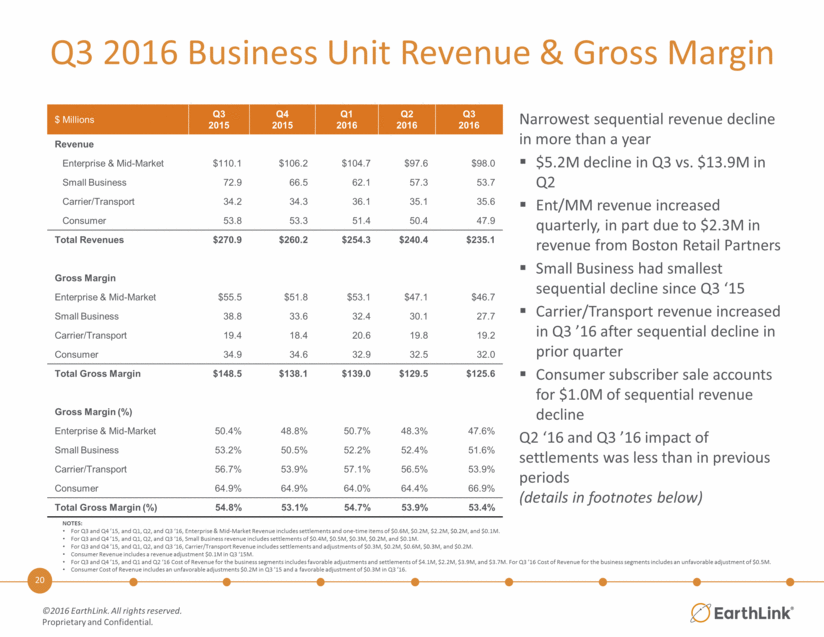
Q3 2016 Business Unit Revenue & Gross Margin Narrowest sequential revenue decline in more than a year $5.2M decline in Q3 vs. $13.9M in Q2 Ent/MM revenue increased quarterly, in part due to $2.3M in revenue from Boston Retail Partners Small Business had smallest sequential decline since Q3 ‘15 Carrier/Transport revenue increased in Q3 ’16 after sequential decline in prior quarter Consumer subscriber sale accounts for $1.0M of sequential revenue decline Q2 ‘16 and Q3 ’16 impact of settlements was less than in previous periods (details in footnotes below) $ Millions Q3 2015 Q4 2015 Q1 2016 Q2 2016 Q3 2016 Revenue Enterprise & Mid-Market $110.1 $106.2 $104.7 $97.6 $98.0 Small Business 72.9 66.5 62.1 57.3 53.7 Carrier/Transport 34.2 34.3 36.1 35.1 35.6 Consumer 53.8 53.3 51.4 50.4 47.9 Total Revenues $270.9 $260.2 $254.3 $240.4 $235.1 Gross Margin Enterprise & Mid-Market $55.5 $51.8 $53.1 $47.1 $46.7 Small Business 38.8 33.6 32.4 30.1 27.7 Carrier/Transport 19.4 18.4 20.6 19.8 19.2 Consumer 34.9 34.6 32.9 32.5 32.0 Total Gross Margin $148.5 $138.1 $139.0 $129.5 $125.6 Gross Margin (%) Enterprise & Mid-Market 50.4% 48.8% 50.7% 48.3% 47.6% Small Business 53.2% 50.5% 52.2% 52.4% 51.6% Carrier/Transport 56.7% 53.9% 57.1% 56.5% 53.9% Consumer 64.9% 64.9% 64.0% 64.4% 66.9% Total Gross Margin (%) 54.8% 53.1% 54.7% 53.9% 53.4% NOTES: For Q3 and Q4 ’15, and Q1, Q2, and Q3 ‘16, Enterprise & Mid-Market Revenue includes settlements and one-time items of $0.6M, $0.2M, $2.2M, $0.2M, and $0.1M. For Q3 and Q4 ’15, and Q1, Q2, and Q3 ‘16, Small Business revenue includes settlements of $0.4M, $0.5M, $0.3M, $0.2M, and $0.1M. For Q3 and Q4 ’15, and Q1, Q2, and Q3 ‘16, Carrier/Transport Revenue includes settlements and adjustments of $0.3M, $0.2M, $0.6M, $0.3M, and $0.2M. Consumer Revenue includes a revenue adjustment $0.1M in Q3 ‘15M. For Q3 and Q4 ’15, and Q1 and Q2 ‘16 Cost of Revenue for the business segments includes favorable adjustments and settlements of $4.1M, $2.2M, $3.9M, and $3.7M. For Q3 ’16 Cost of Revenue for the business segments includes an unfavorable adjustment of $0.5M. Consumer Cost of Revenue includes an unfavorable adjustments $0.2M in Q3 ’15 and a favorable adjustment of $0.3M in Q3 ’16.
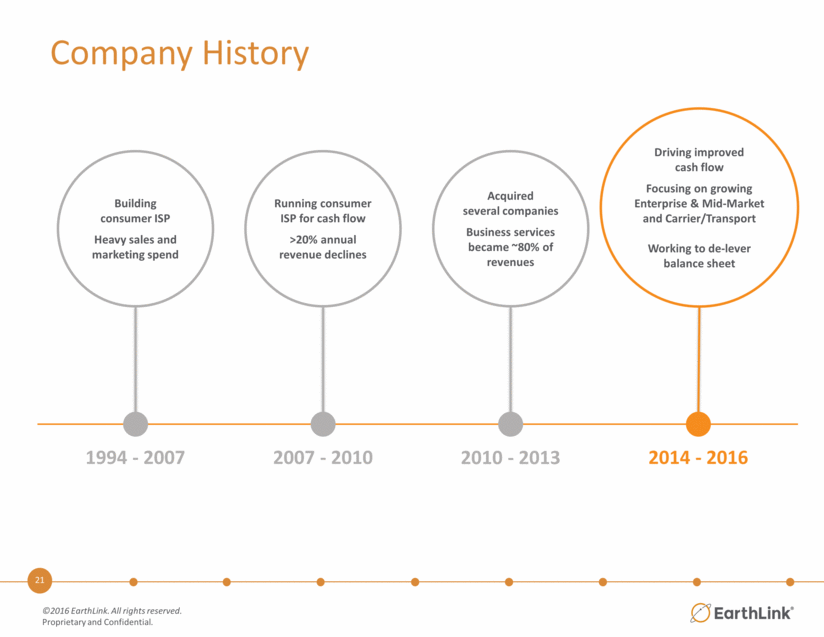
Driving improved cash flow Focusing on growing Enterprise & Mid-Market and Carrier/Transport Working to de-lever balance sheet Company History Building consumer ISP Heavy sales and marketing spend Acquired several companies Business services became ~80% of revenues Running consumer ISP for cash flow >20% annual revenue declines 1994 - 2007 2014 - 2016 2007 - 2010 2010 - 2013
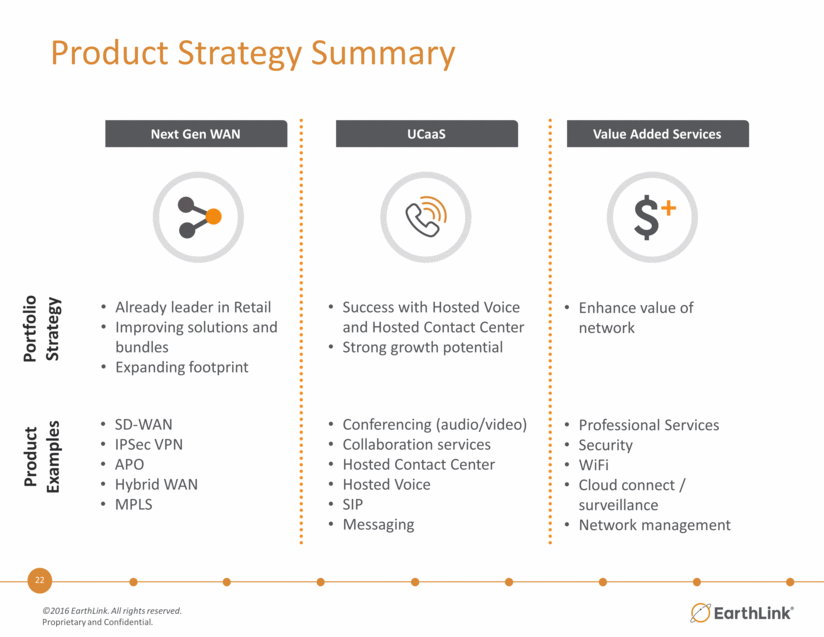
Product Strategy Summary Portfolio Strategy Next Gen WAN UCaaS Value Added Services Product Examples Conferencing (audio/video) Collaboration services Hosted Contact Center Hosted Voice SIP Messaging Professional Services Security WiFi Cloud connect / surveillance Network management Already leader in Retail Improving solutions and bundles Expanding footprint Success with Hosted Voice and Hosted Contact Center Strong growth potential Enhance value of network + SD-WAN IPSec VPN APO Hybrid WAN MPLS
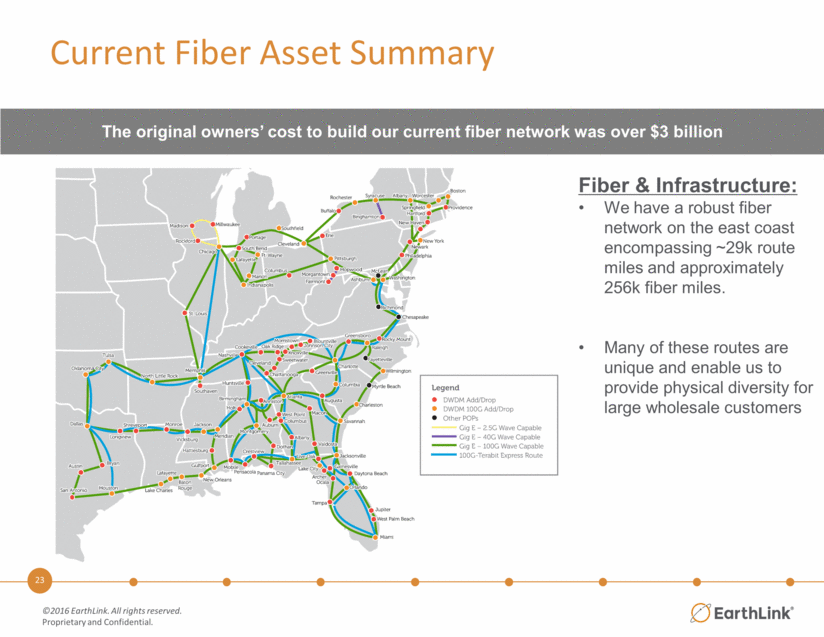
Fiber & Infrastructure: We have a robust fiber network on the east coast encompassing ~29k route miles and approximately 256k fiber miles. Many of these routes are unique and enable us to provide physical diversity for large wholesale customers Current Fiber Asset Summary The original owners’ cost to build our current fiber network was over $3 billion
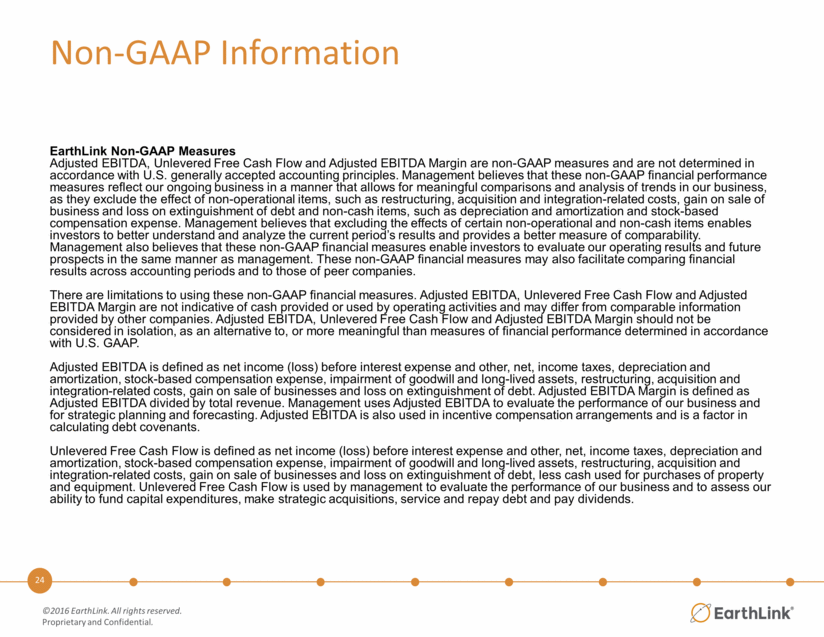
EarthLink Non-GAAP Measures Adjusted EBITDA, Unlevered Free Cash Flow and Adjusted EBITDA Margin are non-GAAP measures and are not determined in accordance with U.S. generally accepted accounting principles. Management believes that these non-GAAP financial performance measures reflect our ongoing business in a manner that allows for meaningful comparisons and analysis of trends in our business, as they exclude the effect of non-operational items, such as restructuring, acquisition and integration-related costs, gain on sale of business and loss on extinguishment of debt and non-cash items, such as depreciation and amortization and stock-based compensation expense. Management believes that excluding the effects of certain non-operational and non-cash items enables investors to better understand and analyze the current period’s results and provides a better measure of comparability. Management also believes that these non-GAAP financial measures enable investors to evaluate our operating results and future prospects in the same manner as management. These non-GAAP financial measures may also facilitate comparing financial results across accounting periods and to those of peer companies. There are limitations to using these non-GAAP financial measures. Adjusted EBITDA, Unlevered Free Cash Flow and Adjusted EBITDA Margin are not indicative of cash provided or used by operating activities and may differ from comparable information provided by other companies. Adjusted EBITDA, Unlevered Free Cash Flow and Adjusted EBITDA Margin should not be considered in isolation, as an alternative to, or more meaningful than measures of financial performance determined in accordance with U.S. GAAP. Adjusted EBITDA is defined as net income (loss) before interest expense and other, net, income taxes, depreciation and amortization, stock-based compensation expense, impairment of goodwill and long-lived assets, restructuring, acquisition and integration-related costs, gain on sale of businesses and loss on extinguishment of debt. Adjusted EBITDA Margin is defined as Adjusted EBITDA divided by total revenue. Management uses Adjusted EBITDA to evaluate the performance of our business and for strategic planning and forecasting. Adjusted EBITDA is also used in incentive compensation arrangements and is a factor in calculating debt covenants. Unlevered Free Cash Flow is defined as net income (loss) before interest expense and other, net, income taxes, depreciation and amortization, stock-based compensation expense, impairment of goodwill and long-lived assets, restructuring, acquisition and integration-related costs, gain on sale of businesses and loss on extinguishment of debt, less cash used for purchases of property and equipment. Unlevered Free Cash Flow is used by management to evaluate the performance of our business and to assess our ability to fund capital expenditures, make strategic acquisitions, service and repay debt and pay dividends. Non-GAAP Information
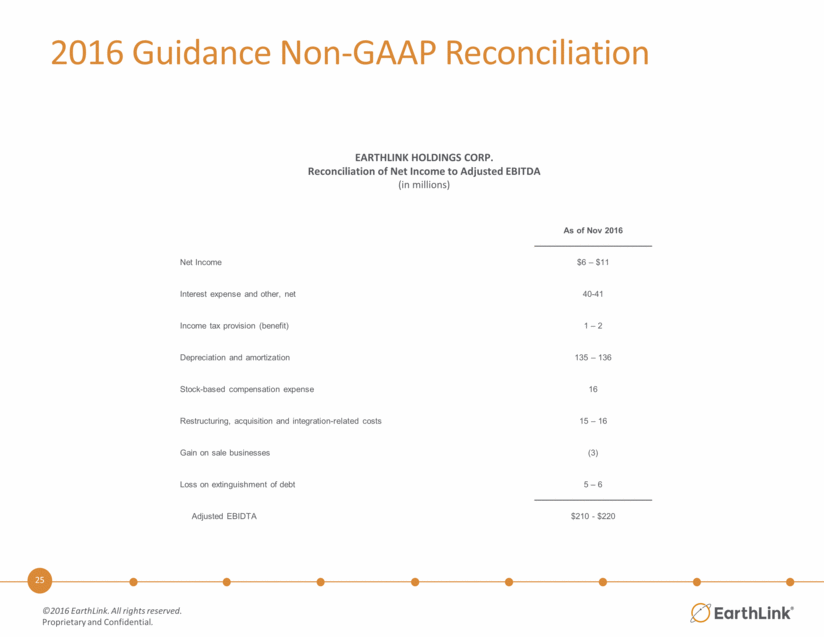
2016 Guidance Non-GAAP Reconciliation As of Nov 2016 Net Income $6 – $11 Interest expense and other, net 40-41 Income tax provision (benefit) 1 – 2 Depreciation and amortization 135 – 136 Stock-based compensation expense 16 Restructuring, acquisition and integration-related costs 15 – 16 Gain on sale businesses (3) Loss on extinguishment of debt 5 – 6 Adjusted EBIDTA $210 - $220 EARTHLINK HOLDINGS CORP. Reconciliation of Net Income to Adjusted EBITDA (in millions)
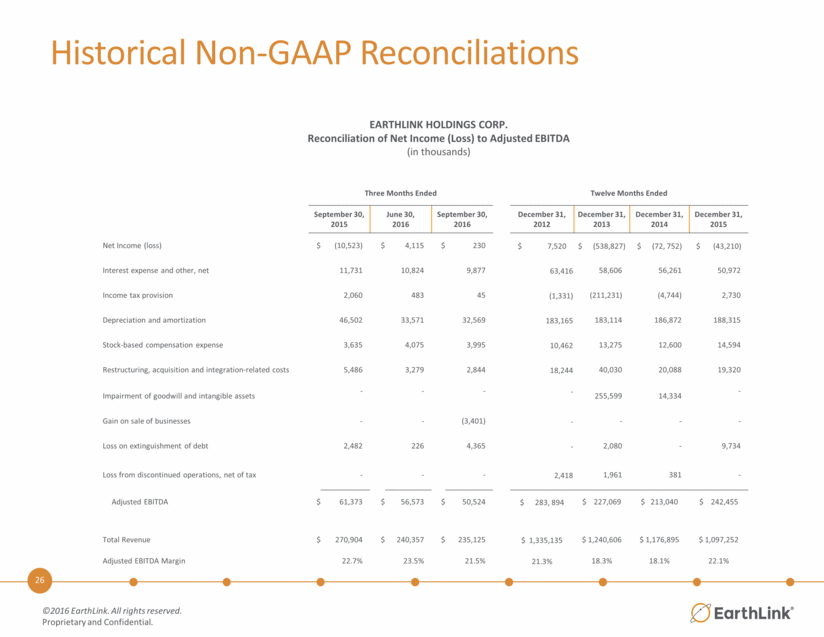
Historical Non-GAAP Reconciliations Three Months Ended Twelve Months Ended September 30, 2015 June 30, 2016 September 30, 2016 December 31, 2012 December 31, 2013 December 31, 2014 December 31, 2015 Net Income (loss) $ (10,523) $ 4,115 $ 230 $ 7,520 $ (538,827) $ (72, 752) $ (43,210) Interest expense and other, net 11,731 10,824 9,877 63,416 58,606 56,261 50,972 Income tax provision 2,060 483 45 (1,331) (211,231) (4,744) 2,730 Depreciation and amortization 46,502 33,571 32,569 183,165 183,114 186,872 188,315 Stock-based compensation expense 3,635 4,075 3,995 10,462 13,275 12,600 14,594 Restructuring, acquisition and integration-related costs 5,486 3,279 2,844 18,244 40,030 20,088 19,320 Impairment of goodwill and intangible assets - - - - 255,599 14,334 - Gain on sale of businesses - - (3,401) - - - - Loss on extinguishment of debt 2,482 226 4,365 - 2,080 - 9,734 Loss from discontinued operations, net of tax - - - 2,418 1,961 381 - Adjusted EBITDA $ 61,373 $ 56,573 $ 50,524 $ 283, 894 $ 227,069 $ 213,040 $ 242,455 Total Revenue $ 270,904 $ 240,357 $ 235,125 $ 1,335,135 $ 1,240,606 $ 1,176,895 $ 1,097,252 Adjusted EBITDA Margin 22.7% 23.5% 21.5% 21.3% 18.3% 18.1% 22.1% EARTHLINK HOLDINGS CORP. Reconciliation of Net Income (Loss) to Adjusted EBITDA (in thousands)
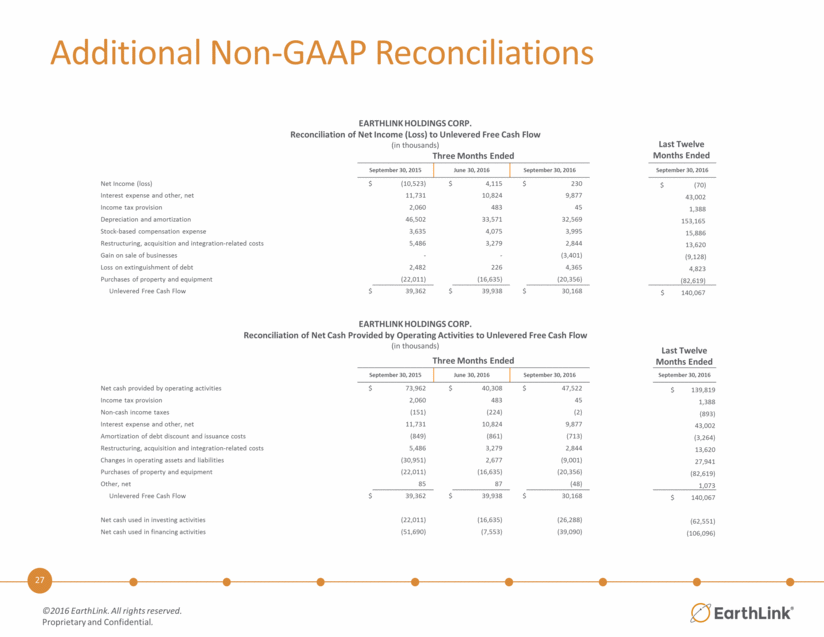
Additional Non-GAAP Reconciliations Three Months Ended September 30, 2015 June 30, 2016 September 30, 2016 September 30, 2016 Net Income (loss) $ (10,523) $ 4,115 $ 230 $ (70) Interest expense and other, net 11,731 10,824 9,877 43,002 Income tax provision 2,060 483 45 1,388 Depreciation and amortization 46,502 33,571 32,569 153,165 Stock-based compensation expense 3,635 4,075 3,995 15,886 Restructuring, acquisition and integration-related costs 5,486 3,279 2,844 13,620 Gain on sale of businesses - - (3,401) (9,128) Loss on extinguishment of debt 2,482 226 4,365 4,823 Purchases of property and equipment (22,011) (16,635) (20,356) (82,619) Unlevered Free Cash Flow $ 39,362 $ 39,938 $ 30,168 $ 140,067 EARTHLINK HOLDINGS CORP. Reconciliation of Net Income (Loss) to Unlevered Free Cash Flow (in thousands) Three Months Ended September 30, 2015 June 30, 2016 September 30, 2016 September 30, 2016 Net cash provided by operating activities $ 73,962 $ 40,308 $ 47,522 $ 139,819 Income tax provision 2,060 483 45 1,388 Non-cash income taxes (151) (224) (2) (893) Interest expense and other, net 11,731 10,824 9,877 43,002 Amortization of debt discount and issuance costs (849) (861) (713) (3,264) Restructuring, acquisition and integration-related costs 5,486 3,279 2,844 13,620 Changes in operating assets and liabilities (30,951) 2,677 (9,001) 27,941 Purchases of property and equipment (22,011) (16,635) (20,356) (82,619) Other, net 85 87 (48) 1,073 Unlevered Free Cash Flow $ 39,362 $ 39,938 $ 30,168 $ 140,067 Net cash used in investing activities (22,011) (16,635) (26,288) (62,551) Net cash used in financing activities (51,690) (7,553) (39,090) (106,096) EARTHLINK HOLDINGS CORP. Reconciliation of Net Cash Provided by Operating Activities to Unlevered Free Cash Flow (in thousands) Last Twelve Months Ended Last Twelve Months Ended
EarthLink®