UNITED STATES
SECURITIES AND EXCHANGE COMMISSION
WASHINGTON, D.C. 20549
FORM N-CSR
CERTIFIED SHAREHOLDER REPORT OF REGISTERED MANAGEMENT
INVESTMENT COMPANIES
Investment Company Act file number811-09781
PFS Funds
(Exact name of registrant as specified in charter)
1939 Friendship Drive, Suite C, El Cajon, CA 92020
(Address of principal executive offices) (Zip code)
CT Corporation System
155 Federal St., Suite 700, Boston, MA 02110
(Name and address of agent for service)
Registrant’s telephone number, including area code:(619) 588-9700
Date of fiscal year end:December 31
Date of reporting period:December 31, 2018
| Item 1. Reports to Stockholders. |

IMPORTANT NOTE:Beginning on January 1, 2021, as permitted by regulations adopted by the Securities and Exchange Commission, paper copies of the Fund's shareholder reports will no longer be sent by mail, unless you specifically request paper copies of the reports from the Fund or from your financial intermediary, such as a broker-dealer or bank. Instead, the reports will be made available on a website, and you will be notified by mail each time a report is posted and provided with a website link to access the report.
If you already elected to receive shareholder reports electronically, you will not be affected by this change and you need not take any action. You may elect to receive shareholder reports and other communications from the Fund or your financial intermediary electronically by calling or sending an email request.
You may elect to receive all future reports in paper free of charge. You can inform the Fund or your financial intermediary that you wish to continue receiving paper copies of your shareholder reports by calling or sending an email request. Your election to receive reports in paper will apply to all funds held with the fund complex/your financial intermediary.
Annual Report
December 31, 2018
BRTNX |
February 19, 2019
Dear Fellow Shareholders:
The Bretton Fund’s net asset value per share (NAV) as of December 31, 2018, was $30.01, and the total return for the year was -1.94% .
| Returns as of December 31, 2018(A) | | | | | | | | | |
| | | | | | Annualized | | Annualized | | Annualized | |
| | 4th Quarter | | 1 Year | | 3 Years | | 5 Years | | Since Inception | |
| Bretton Fund | -13.51% | | -1.94% | | 8.65% | | 5.64% | | 10.05% | |
| S&P 500 Index(B) | -13.52% | | -4.38% | | 9.26% | | 8.49% | | 12.33% | |
Calendar Year Total Returns(A)
| | Bretton Fund | | S&P 500 Index(B) | |
| 2018 | -1.94% | | -4.38% | |
| 2017 | 18.19% | | 21.83% | |
| 2016 | 10.68% | | 11.96% | |
| 2015 | -6.59% | | 1.38% | |
| 2014 | 9.79% | | 13.69% | |
| 2013 | 26.53% | | 32.39% | |
| 2012 | 15.66% | | 16.00% | |
| 2011 | 7.90% | | 2.11% | |
| 9/30/10–12/31/10 | 6.13% | | 10.76% | |
| Cumulative Since Inception | 120.47% | | 161.10% | |
(A)All returns include change in share prices and, in each case, include reinvestment of any dividends and capital gain distributions. The inception date of the Bretton Fund was September 30, 2010.
(B)The S&P 500® Index is a stock market index based on the market capitalizations of 500 leading companies publicly traded in the US stock market, as determined by Standard & Poor’s, and captures approximately 80% coverage of available market capitalization.
Performance data quoted represents past performance. Past performance does not guarantee future results. The investment return and principal value of an investment will fluctuate so that an investor’s shares, when redeemed, may be worth more or less than their original cost. Current performance may be lower or higher than the performance data quoted. You may obtain performance data current to the most recent month-end at http://brettonfund.com or by calling 800.231.2901.
All returns include change in share prices, reinvestment of any dividends, and capital gains distributions. Indices shown are broad-based, unmanaged indices commonly used to measure performance of US stocks. These indices do not incur expenses and are not available for investment. The fund’s expense ratio is 1.50% .The fund’s principal underwriter is Rafferty Capital Markets, LLC.

1
4th Quarter
In a rough fourth quarter for the stock market, the fund was hit hardest by the decline in Continental Building Products, which took 2.0% off fund performance. The company reported great earnings growth, but its stock price was hit by the negative sentiment surrounding the broader housing and building products sector. Like Continental, Alphabet announced positive earnings, but the market downturn pulled the stock down, taking 1.5% off the fund. TJX Companies hurt performance by 1.3% .
The only significant positive contributor in the quarter was AutoZone, which added 0.5% to the fund as both sentiment and earnings rebounded for the auto-parts retailer.
We added auto insurer Progressive to the fund, which we discuss below.
Contributors to Performance for 2018
For the year, the largest positive contributor was Mastercard, adding 1.3% to performance, as it keeps up its rapid growth. After a weak 2017, AutoZone had a nice rebound in 2018, adding 1.1% . TJX also had a bounceback year and added 0.8% .
Carter’s, a business we’ve owned since the fund’s inception, had the biggest negative impact on the fund last year, pulling down performance by –1.6% . Wells Fargo and Bank of America pulled performance down by –1.2% and –1.0% as investors became more concerned about a weakening economy toward the end of the year.
Taxes
The fund issued a long-term capital gains distribution of $0.259457 on December 19, which amounted to 0.9% of the reinvested NAV of $29.81. As a reminder, the fund did not pay any tax distributions in 2017, despite an 18.2% return that year, and 2016’s distribution was relatively modest as well. We don’t have a singular focus on reducing taxes (the easiest way to reduce your taxes is to stop making money), but we do try to minimize the taxes our shareholders face. The fund’s taxes over the past three years were about 90% less than the average fund in its category, according to Morningstar.
| Portfolio | | |
| |
| Security | % of Net Assets | |
| Alphabet, Inc. | 10.5% | |
| Union Pacific Corp. | 7.6% | |
| Ross Stores, Inc. | 6.4% | |
| MasterCard, Inc. | 6.3% | |
| Bank of America Corp. | 6.0% | |
| American Express Co. | 5.6% | |
| Berkshire Hathaway, Inc. | 5.5% | |
| Visa, Inc. | 5.5% | |
| The TJX Companies Inc. | 5.4% | |
| JPMorgan Chase & Co. | 5.4% | |
| AutoZone, Inc. | 5.2% | |
| Wells Fargo & Company | 4.9% | |
| Canadian Pacific Railway Limited | 4.7% | |
| Continental Building Products, Inc. | 4.5% | |
| Carter’s, Inc. | 4.1% | |
| NVR, Inc. | 3.5% | |
| Discovery Communications, Inc. | 3.0% | |
| Armanino Foods of Distinction, Inc. | 2.5% | |
| The Progressive Corporation | 2.5% | |
| Cash* | 0.9% | |
* Cash represents cash and other assets in excess of liabilities.
2
Consumer
Ross Stores and TJX continue to be two of the few bright spots in the retail business. In a year that saw Sears file for bankruptcy and other mainline retailers deteriorating, our “off-price” retailers flourished yet again, both growing earnings per share an estimated 25% last year. Ross’ stock returned 4.8%, while TJX returned 18.9% . Like most of our companies, 2018’s earnings figures were boosted significantly by the corporate tax cut, which, all things being equal, increased domestic net incomes by 22%.
A year and a half ago, investors were wringing their hands over the supposed imminent demise of AutoZone and the auto-parts retail sector due to online competition, despite no real signs of that happening. Mechanics require same-day delivery, often within 15 minutes, and do-it-yourself customers frequently rely on store personnel to help select and install the right part, often borrowing specialized tools. Sentiment can take a while to turn, and it finally did for AutoZone in 2018. More favorable weather also helped. AutoZone’s stock price increased 17.9%, while earnings per share increased 11%. We had added to the position when the stock took a sharp fall and have since trimmed a bit as it’s risen back to its all-time highs.
Carter’s stock price was hit hard, returning –29.3%, and earnings per share rose an estimated 5%, not a great number in a year in which most companies saw double-digit increases just from the lower tax rate. A handful of headwinds hit the company: operational stumbles in China, larger spending on long-term initiatives, and most of all, the liquidation of Toys “R” Us, one of its largest customers. Management expects to recapture at least 80% of that lost business, which represented 6% of its earnings, though it may take some time for customers to adjust. At a modest 12.5x earnings, the stock is the cheapest it’s been in almost eight years.
Our acquisition of NVR was poorly timed: even as NVR’s earnings increased, the stock dropped 17% below our purchase price in a matter of months as the overall housing market cooled from higher mortgage rates. While we expect increased mortgage rates to reduce house prices (or at least slow the rate of growth), we also think the US is significantly under-building new houses, particularly in the markets NVR serves, and we think they’ll be building an increasing number of new homes for a long time. Equally important, we think the stock’s a bargain.
Discovery completed its merger with Scripps, bringing on HGTV and Food Network, and has started to see the benefits of the merger. In addition to significant cost cuts, Discovery used its increased content heft, which now represents 20% of TV viewership, to push its way onto online subscription video platforms, most notably Hulu and Sling TV, easing its transition from cable TV to online video. Viewership patterns are changing as the world switches from organizing content by channel and time to organizing by show, and the cozy ecosystem where networks and the cable companies were sharing an endlessly increasing pie of subscription dollars is gone. That said, Discovery is still growing, and the current share price offers us something close to a 15% free cash flow yield, which we find fair compensation for the challenges. The stock rose 10.6% last year, and earnings per share was up an estimated 5%.
We’ve owned Armanino Foods of Distinction since 2013, and along with Ross Stores, it might be our most consistent, under-the-radar grower. On track to increase earnings per share 36%, the stock returned 15% last year including its large dividend. And their frozen pesto sauce continues to taste great.
Financials
After two really strong years, our banks stocks dropped a bit last year on lower optimism about the global economy, despite generally good earnings growth and cheap valuations. Bank of America increased earnings per share by 43% (!), while its stock returned –15.0% . JPMorgan Chase’s earnings per share increased 30%; its stock returned –6.6% . Both benefited from 1) higher interest rates, 2) loan growth, 3) fewer defaults, 4) larger
3
payouts to shareholders, and 5) a lower tax rate. Both stocks have done really well for us, and we think they’re still good investments.
Once labeled “best in class,” Wells Fargo’s recent performance has been awful in comparison. It continues to deal with the fallout from employees creating fake accounts to meet management’s unrealistic sales targets, and to compound matters, revenue has been flat and costs have crept up. Earnings per share increased only 6% (pre-tax earnings shrunk 3%), and its stock returned –21.8% . Longtime shareholders may remember when Wells Fargo’s “best in class” performance contributed regularly to the fund’s performance, while our Bank of America and JPMorgan investments struggled with regulatory problems and inflated costs. While Wells’ problems aren’t the same, we think the core business remains pretty good and will eventually work past its problems in a similar way the other two banks did.
The turnaround at American Express continues. Competition among card issuers for big spenders has eased, and American Express has more than replaced its lost Costco business. Earnings per share increased 24%, with the company seeing both healthy revenue growth and controlled costs. The stock returned -2.6% .
We added Progressive toward the end of the year and are down a modest 5.9% so far.
Information Technology
Alphabet’s stock was essentially flat last year (–0.8%), despite earnings per share increasing 37% on continued fast growth and lower taxes. The company does face a few challenges: a tougher regulatory environment, particularly in Europe; declining ad rates for certain types of ads; and weaker economics on its search-engine deal with Apple. Yet, its core business of search remains dominant and still grows fast, with even developed markets like the US and Europe growing around 20% a year. If it can maintain anywhere close to its historical growth, we think we’ll do pretty well in the stock in the years to come.
Consumers around the world keep using their Visas and Mastercards. Despite being up almost 50% in 2017, the duo’s stock prices rose sharply again, Mastercard up 25.3% and Visa up 16.5%, which was especially impressive in a down year for the market. Earnings per share rose 42% and 32% for Mastercard and Visa, respectively. The steep rise in their share prices has put them in the upper bounds of what we usually consider “reasonably valued,” but their earnings have also increased so much that we still find them relatively compelling.
Industrials
“Precision railroading” has reached a tipping point in North America. A couple decades ago, Canadian National Railway was the first large railroad to implement the relatively radical operating philosophy that relies on tighter adherence to schedules while running fewer, longer trains. The result is faster and more reliable delivery times for customers and significantly reduced operating costs for the railroad. It’s a superior operating model, but isn’t easy to do. CSX was the first to implement precision railroading at scale in the US a couple years ago, and after some hiccups, the results have been great. Last year Union Pacific announced it’s going to give it a go as well and hired a new chief operating officer away from precision-railroading pioneer Canadian National. For 2018, Union Pacific increased its earnings per share by 37%, and its stock returned 5.3% .
Canadian Pacific, long since colonized by precision railroaders, increased its earnings per share 27%, and its stock's total return was 6.6% .
Berkshire Hathaway, which owns the BNSF Railway (for now a precision railroading holdout) among a wide range of businesses, increased its book value per share by an estimated 6%, and its stock returned 2.8% . (Given that its earnings fluctuate widely
4
based on changes of its stock holdings, we find book value per share a little more relevant.)
Wallboard-maker Continental Building Products had a great 2018, increasing earnings per share by an estimated 53%, but negative sentiment on the housing market dragged down its stock by 9.6% .
Progressive
Progressive is the third-largest auto insurance company in the US, behind State Farm and GEICO (part of our very own Berkshire Hathaway). It is an old saw that insurance is sold, not bought, and most insurance companies work with an army of independent agents who go out and find customers. The agents receive a commission (typically 12–15%) for each customer they bring in and continue to clip renewal commissions (typically 5%) for each year a customer stays with a carrier. From the insurance company’s perspective, it’s a low-risk way to grow a business; the company only pays for the customers who actually sign up. But it’s an expensive and unwieldy tool for a sticky product like auto insurance, where customers often remain with a carrier for six to eight years. The direct companies—largely GEICO, Progressive, and USAA—pay for their own sales efforts, which requires a greater upfront investment, but then allows them to keep more of the lifetime value of the customer relationship. The direct companies have steadily, if slowly, taken share from the companies that use agents.
From a financial perspective, it is helpful to think about Progressive as two different companies: an insurance company that writes policies and pays claims and an investment company that handles the money put up by the policyholders.
On the insurance side, we expect Progressive to write about $35 billion worth of insurance next year. Roughly $25 billion will go back out the door in claims, and about $7.5 billion will go toward overhead and marketing, including almost $1 billion to bombard TV viewers with “Flo.” That leaves $2.5 billion in underwriting profit, which, adjusted for taxes and the 585 million shares outstanding, is about $3 per share net.
On the investment side, Progressive’s $35 billion portfolio is split between roughly $27 billion of debt and $8 billion of equity. The conservative bond portfolio should yield at least 3.5% for $950 million, and we’d expect its equity portfolio to earn at least 6% for another $480 million. All told, we expect the investment portfolio to yield about $2 per share after taxes over the medium term. However, it is important to note that accounting rules can introduce tremendous volatility in reported results: e.g., a rise in interest rates is reflected as a sudden loss in the investment portfolio, even though the company benefits from investing new funds at higher rates.
As a combined entity, we are looking for Progressive to generate slightly less than $5 per share in earnings next year, which means that at a share price of $60 we hold it for 12x. Progressive has consistently generated double-digit policy, revenue, and earnings growth, and while the top line may slow over time, we note that a slowdown in newer, more expensively acquired customers would increase profitability and earnings.
| Investments Initiated in 2018 | | |
| NVR. Inc. | | |
| The Progressive Corporation | | |
| |
| Investments Exited During 2018 | | |
| Investment | Internal Rate of Return | |
| Verisk | 14.9% | |
| PPG Industries, Inc. | 9.5% | |
5
Investing Climate
Ten years into an American economic expansion with steady growth and unemployment levels as about as low as they can get, there are risks on the horizon. There are nascent signs of inflation after a decade of price and wage stability. Interest rates are rising. The Federal Reserve is unwinding its balance sheet. The corporate tax cuts have increased the deficit. The high-yield market, which in the middle of 2018 was offering pre–financial crisis terms to borrowers, has seen massive outflows. There are trade tensions and tariffs with major trading partners. China just published its lowest annual growth rate since 1990. The UK flirts with a “hard exit” from the EU, the EU has yet to fully resolve the euro crisis, and Brazil limps from crisis to crisis. There is plenty of ground for pessimism.
At the same time, stock market multiples have contracted considerably. For people who are looking to buy earnings streams inexpensively, this is a major development. After years of struggling to find enough investments with a margin of safety to protect against economic shocks, we find ourselves in the somewhat unusual position of being modestly sanguine about the market. We’ve taken the opportunity presented by the market volatility to become fully invested and make upgrades to the portfolio. Of course, we have no idea what will happen over the short and medium terms, or if there will be a market crash or a recession in 2019, but we are quite optimistic about our current collection of good businesses at reasonable prices and think they’ll do well over the long term.
As always, thank you for investing.
Stephen Dodson
Portfolio Manager | Raphael de Balmann
Portfolio Manager |
6
Bretton Fund by Sectors
(as a percentage of Net Assets)
(Unaudited)
December 31, 2018
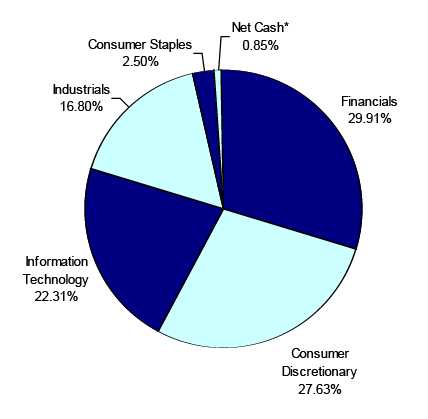
* Net Cash represents cash and other assets in excess of liabilities.
7
| Bretton Fund |
| | | | | | | Schedule of Investments |
| | | | | | | December 31, 2018 |
| Shares | | Cost | | Fair Value | | % of Net Assets |
| COMMON STOCKS | | | | | | | | |
| | | | | | | |
| Apparel & Other Finished Products of Fabrics & Similar Material | | | | | | |
| 14,000 | Carter's, Inc. | $ | 1,048,787 | | $ | 1,142,680 | | 4.08 | % |
| Cable & Other Pay Television Services | | | | | | | | |
| 33,500 | Discovery Communications, Inc. - Class A * | | 1,065,807 | | | 828,790 | | 2.96 | % |
| Canned, Frozen & Preserved Fruit, Vegetables & Food Specialties | | | | | | |
| 245,430 | Armanino Foods of Distinction, Inc. | | 241,491 | | | 699,476 | | 2.50 | % |
| Concrete, Gypsum & Plaster Products | | | | | | | | |
| 50,000 | Continental Building Products, Inc. * | | 1,207,224 | | | 1,272,500 | | 4.54 | % |
| Finance Services | | | | | | | | |
| 16,600 | American Express Company | | 1,162,234 | | | 1,582,312 | | 5.65 | % |
| Fire, Marine & Casualty Insurance | | | | | | | | |
| 7,500 | Berkshire Hathaway Inc. - Class B * | | 1,116,560 | | | 1,531,350 | | | |
| 11,500 | The Progressive Corporation | | 737,081 | | | 693,795 | | | |
| | | | 1,853,641 | | | 2,225,145 | | 7.94 | % |
| National Commercial Banks | | | | | | | | |
| 68,400 | Bank of America Corporation | | 1,087,675 | | | 1,685,376 | | | |
| 15,400 | JPMorgan Chase & Co. | | 824,087 | | | 1,503,348 | | | |
| 30,000 | Wells Fargo & Company | | 1,174,729 | | | 1,382,400 | | | |
| | | | 3,086,491 | | | 4,571,124 | | 16.32 | % |
| Operative Builders | | | | | | | | |
| 400 | NVR, Inc. * | | 1,176,309 | | | 974,796 | | 3.48 | % |
| Railroad, Line-Haul Operating | | | | | | | | |
| 7,400 | Canadian Pacific Railway Limited (Canada) | | 1,162,494 | | | 1,314,388 | | | |
| 15,350 | Union Pacific Corporation | | 1,243,057 | | | 2,121,830 | | | |
| | | | 2,405,551 | | | 3,436,218 | | 12.26 | % |
| Retail - Auto & Home Supply Stores | | | | | | | | |
| 1,750 | AutoZone, Inc. * | | 1,135,888 | | | 1,467,095 | | 5.24 | % |
| Retail - Family Clothing Stores | | | | | | | | |
| 21,700 | Ross Stores Inc. | | 519,491 | | | 1,805,440 | | | |
| 34,000 | The TJX Companies, Inc. | | 1,228,897 | | | 1,521,160 | | | |
| | | | 1,748,388 | | | 3,326,600 | | 11.87 | % |
| Services - Business Services, NEC | | | | | | | | |
| 9,380 | MasterCard Incorporated - Class A | | 849,356 | | | 1,769,537 | | | |
| 11,600 | Visa Inc. - Class A | | 962,813 | | | 1,530,504 | | | |
| | | | 1,812,169 | | | 3,300,041 | | 11.78 | % |
| Services - Computer Processing & Data Preparation | | | | | | | | |
| 2,850 | Alphabet Inc. - Class C * | | 2,082,582 | | | 2,951,489 | | 10.53 | % |
| Total for Common Stocks | $ | 20,026,562 | | $ | 27,778,266 | | 99.15 | % |
| Total Investment Securities | $ | 20,026,562 | | $ | 27,778,266 | | | |
| Other Assets in Excess of Liabilities | | | | $ | 238,390 | | 0.85 | % |
| Net Assets | | | | | $ | 28,016,656 | | 100.00 | % |
* Non-Income Producing Securities.
The accompanying notes are an integral part of these financial statements.
8
| Bretton Fund | | | |
| |
| Statement of Assets and Liabilities | | | |
| December 31, 2018 | | | |
| |
| Assets: | | | |
| Investment Securities at Fair Value | $ | 27,778,266 | |
| (Cost $20,026,562) | | | |
| Cash | | 265,839 | |
| Dividend Receivable | | 8,559 | |
| Receivable for Shareholder Purchases | | 187 | |
| Total Assets | | 28,052,851 | |
| Liabilities: | | | |
| Payable to Adviser (Note 4) | | 36,195 | |
| Total Liabilities | | 36,195 | |
| Net Assets | $ | 28,016,656 | |
| |
| Net Assets Consist of: | | | |
| Paid In Capital | $ | 20,264,938 | |
| Total Distributable Earnings | | 7,751,718 | |
| Net Assets, for 933,677 Shares Outstanding | $ | 28,016,656 | |
| (Unlimited shares authorized) | | | |
| Net Asset Value, Offering Price and Redemption Price Per Share | | | |
| ($28,016,656/933,677 shares) | $ | 30.01 | |
| |
| Statement of Operations | | | |
| For the fiscal year ended December 31, 2018 | | | |
| |
| Investment Income: | | | |
| Dividends (Net of foreign withholding taxes and fees of $2,000) | $ | 322,992 | |
| Interest | | 908 | |
| Total Investment Income | | 323,900 | |
| Expenses: | | | |
| Management Fees (Note 4) | | 460,818 | |
| Total Expenses | | 460,818 | |
| |
| Net Investment Income (Loss) | | (136,918 | ) |
| |
| Realized and Unrealized Gain (Loss) on Investments: | | | |
| Realized Gain (Loss) on Investments | | 453,925 | |
| Net Change in Unrealized Appreciation (Depreciation) on Investments | | (1,015,630 | ) |
| Net Realized and Unrealized Gain (Loss) on Investments | | (561,705 | ) |
| |
| Net Increase (Decrease) in Net Assets from Operations | $ | (698,623 | ) |
The accompanying notes are an integral part of these financial statements.
9
| Bretton Fund |
| | |
| Statements of Changes in Net Assets | | | | | | | | |
| | | 1/1/2018 | | | | 1/1/2017 | | |
| | | to | | | | to | | |
| | | 12/31/2018 | | | | 12/31/2017 | | |
| From Operations: | | | | | | | | |
| Net Investment Income (Loss) | $ | (136,918 | ) | | $ | (139,958 | ) | |
| Net Realized Gain (Loss) on Investments | | 453,925 | | | | 113,191 | | |
| Net Change in Unrealized Appreciation (Depreciation) on Investments | | (1,015,630 | ) | | | 4,705,620 | | |
| Increase (Decrease) in Net Assets from Operations | | (698,623 | ) | | | 4,678,853 | | |
| | |
| From Distributions to Shareholders: | | (240,110 | ) | | | - | | |
| | |
| From Capital Share Transactions: | | | | | | | | |
| Proceeds From Sale of Shares | | 3,842,585 | | | | 1,583,724 | | |
| Shares Issued on Reinvestment of Distributions | | 240,110 | | | | - | | |
| Cost of Shares Redeemed | | (5,843,520 | ) | | | (203,858 | ) | |
| Net Increase (Decrease) from Shareholder Activity | | (1,760,825 | ) | | | 1,379,866 | | |
| | |
| Net Increase (Decrease) in Net Assets | | (2,699,558 | ) | | | 6,058,719 | | |
| | |
| Net Assets at Beginning of Period | | 30,716,214 | | | | 24,657,495 | | |
| Net Assets at End of Period | $ | 28,016,656 | | | $ | 30,716,214 | | (a) |
| | |
| Share Transactions: | | | | | | | | |
| Issued | | 118,438 | | | | 58,371 | | |
| Reinvested | | 8,055 | | | | - | | |
| Redeemed | | (187,763 | ) | | | (7,378 | ) | |
| Net Increase (Decrease) in Shares | | (61,270 | ) | | | 50,993 | | |
| Shares Outstanding Beginning of Period | | 994,947 | | | | 943,954 | | |
| Shares Outstanding End of Period | | 933,677 | | | | 994,947 | | |
| Financial Highlights | | | | | | | | | | | | | | | | | | | |
| Selected data for a share outstanding | | | | | | | | | | | | | | | | | | | |
| throughout the period: | | 1/1/2018 | | | | 1/1/2017 | | | | 1/1/2016 | | | | 1/1/2015 | | | | 1/1/2014 | |
| | | to | | | | to | | | | to | | | | to | | | | to | |
| | | 12/31/2018 | | | | 12/31/2017 | | | | 12/31/2016 | | | | 12/31/2015 | | | | 12/31/2014 | |
| Net Asset Value - | | | | | | | | | | | | | | | | | | | |
| Beginning of Period | $ | 30.87 | | | $ | 26.12 | | | $ | 23.98 | | | $ | 25.72 | | | $ | 23.44 | |
| Net Investment Income (Loss)(b) | | (0.14 | ) | | | (0.14 | ) | | | (0.11 | ) | | | (0.01 | ) | | | 0.01 | |
| Net Gain (Loss) on Investments | | | | | | | | | | | | | | | | | | | |
| (Realized and Unrealized) | | (0.46 | ) | | | 4.89 | | | | 2.68 | | | | (1.69 | ) | | | 2.28 | |
| Total from Investment Operations | | (0.60 | ) | | | 4.75 | | | | 2.57 | | | | (1.70 | ) | | | 2.29 | |
| |
| Distributions (From Net Investment Income) | | - | | | | - | | | | - | | | | - | | | | (0.01 | ) |
| Distributions (From Realized Capital Gains) | | (0.26 | ) | | | - | | | | (0.43 | ) | | | (0.04 | ) | | | - | |
| Total Distributions | | (0.26 | ) | | | - | | | | (0.43 | ) | | | (0.04 | ) | | | (0.01 | ) |
| |
| Net Asset Value - | | | | | | | | | | | | | | | | | | | |
| End of Period | $ | 30.01 | | | $ | 30.87 | | | $ | 26.12 | | | $ | 23.98 | | | $ | 25.72 | |
| Total Return(c) | | (1.94)% | | | | 18.19% | | | | 10.68% | | | | (6.59)% | | | | 9.79% | |
| Ratios/Supplemental Data | | | | | | | | | | | | | | | | | | | |
| Net Assets - End of Period (Thousands) | $ | 28,017 | | | $ | 30,716 | | | $ | 24,657 | | | $ | 20,531 | | | $ | 10,549 | |
| Ratio of Expenses to Average Net Assets | | 1.50% | | | | 1.50% | | | | 1.50% | | | | 1.50% | | | | 1.50% | |
| Ratio of Net Investment Income (Loss) to | | | | | | | | | | | | | | | | | | | |
| Average Net Assets | | -0.45% | | | | -0.53% | | | | -0.47% | | | | -0.05% | | | | 0.05% | |
| Portfolio Turnover Rate | | 11.40% | | | | 10.81% | | | | 16.27% | | | | 26.81% | | | | 10.68% | |
| | (a) As of December 31, 2017, Accumulated Undistributed Net Investment Income was $0.
(b) Per share amounts were calculated using the average shares method.
(c) Total return represents the rate that the investor would have earned or lost on an investment
in the Fund assuming reinvestment of dividends and distributions.
The accompanying notes are an integral part of these financial statements. |
10
Notes to Financial Statements
Bretton Fund
December 31, 2018
1.) ORGANIZATION
Bretton Fund (the “Fund”) was organized as a non-diversified series of the PFS Funds (the “Trust”) on September 21, 2010. The Trust was established under the laws of Massachusetts by an Agreement and Declaration of Trust dated January 13, 2000, which was amended and restated January 20, 2011. The Trust is registered as an open-end investment company under the Investment Company Act of 1940, as amended. The Trust may offer an unlimited number of shares of beneficial interest in a number of separate series, each series representing a distinct fund with its own investment objectives and policies. As of December 31, 2018, there were seven series authorized by the Trust. The Fund commenced operations on September 30, 2010. The Fund’s investment objective is to seek long-term capital appreciation. The investment adviser to the Fund is Bretton Capital Management, LLC (the “Adviser”).
2.) SIGNIFICANT ACCOUNTING POLICIES
The Fund is an investment company and accordingly follows the investment company accounting and reporting guidance of the Financial Accounting Standards Board (“FASB”) Accounting Standards Codification Topic 946Financial Services - Investment Companies. The financial statements are prepared in conformity with accounting principles generally accepted in the United States of America (“GAAP”). The Fund follows the significant accounting policies described in this section.
SECURITY VALUATION:
All investments in securities are recorded at their estimated fair value, as described in Note 3.
SHARE VALUATION:
The net asset value (the “NAV”) is generally calculated as of the close of trading on the New York Stock Exchange (the “Exchange”) (normally 4:00 p.m. Eastern time) every day the Exchange is open. The NAV is calculated by taking the total value of the Fund’s assets, subtracting its liabilities, and then dividing by the total number of shares outstanding, rounded to the nearest cent. The offering price and redemption price per share are equal to the net asset value per share.
FEDERAL INCOME TAXES:
The Fund’s policy is to continue to comply with the requirements of the Internal Revenue Code that are applicable to regulated investment companies and to distribute all of its taxable income to shareholders. Therefore, no federal income tax provision is required. It is the Fund’s policy to distribute annually, prior to the end of the calendar year, dividends sufficient to satisfy excise tax requirements of the Internal Revenue Code. This Internal Revenue Code requirement may cause an excess of distributions over the book year-end accumulated income. In addition, it is the Fund’s policy to distribute annually, after the end of the fiscal year, any remaining net investment income and net realized capital gains.
The Fund recognizes the tax benefits of certain tax positions only where the position is “more likely than not” to be sustained assuming examination by tax authorities. Management has analyzed the Fund’s tax positions, and has concluded that no liability for unrecognized tax benefits should be recorded related to uncertain tax positions taken on returns filed for open tax years. The Fund identifies its major tax jurisdictions as U.S. Federal tax authorities; however, the Fund is not aware of any tax positions for which it is reasonably possible that the total amounts of unrecognized tax benefits will change materially in the next 12 months. The Fund recognizes interest and penalties, if any, related to unrecognized tax benefits as income tax expense in the Statement of Operations. During the fiscal year ended December 31, 2018, the Fund did not incur any interest or penalties.
DISTRIBUTIONS TO SHAREHOLDERS:
Distributions to shareholders, which are determined in accordance with income tax regulations, are recorded on the ex-dividend date.
The treatment for financial reporting purposes of distributions made to shareholders during the period from net investment income or net realized capital gains may differ from their ultimate treatment for federal income tax purposes. These differences are caused primarily by differences
11
Notes to Financial Statements - continued
in the timing of the recognition of certain components of income, expense, or realized capital gain for federal income tax purposes. Where such differences are permanent in nature, they are reclassified in the components of the net assets based on their ultimate characterization for federal income tax purposes. Any such reclassifications will have no effect on net assets, results of operations, or net asset value per share of the Fund. As of December 31, 2018, total distributable earnings was increased by $136,918 and paid in capital was decreased by $136,918. The adjustment was attributed to the reclassiffication of net investment loss.
USE OF ESTIMATES:
The financial statements are prepared in accordance with GAAP, which requires management to make estimates and assumptions that affect the reported amounts of assets and liabilities and disclosure of contingent assets and liabilities at the date of the financial statements and the reported amounts of increases and decreases in net assets from operations during the reporting period. Actual results could differ from those estimates.
EXPENSES:
Expenses incurred by the Trust that do not relate to a specific fund of the Trust are allocated to the individual funds based on each fund’s relative net assets or another appropriate basis.
CASH:
The Fund maintains cash at its custodian which, at times, may exceed United States federally insured limits.
OTHER:
The Fund records security transactions based on the trade date. Dividend income is recognized on the ex-dividend date. Interest income, if any, is recognized on an accrual basis. The Fund uses the specific identification method in computing gain or loss on sales of investment securities. Withholding taxes on foreign dividends have been provided for in accordance with the Fund’s understanding of the applicable country’s tax rules and rates.
3.) SECURITIES VALUATIONS
As described in Note 2, the Fund utilizes various methods to measure the fair value of most of its investments on a recurring basis. GAAP establishes a hierarchy that prioritizes inputs to valuation methods. The three levels of inputs are:
Level 1 - Unadjusted quoted prices in active markets for identical assets or liabilities that the Fund has the ability to access.
Level 2 - Observable inputs other than quoted prices included in level 1 that are observable for the asset or liability, either directly or indirectly. These inputs may include quoted prices for the identical instrument in an inactive market, prices for similar instruments, interest rates, prepayment speeds, credit risk, yield curves, default rates, and similar data.
Level 3 - Unobservable inputs for the asset or liability, to the extent relevant observable inputs are not available, representing the Fund’s own assumptions about the assumptions a market participant would use in valuing the asset or liability, and would be based on the best information available.
The availability of observable inputs can vary from security to security and is affected by a wide variety of factors, including, for example, the type of security, whether the security is new and not yet established in the marketplace, the liquidity of markets, and other characteristics particular to the security. To the extent that valuation is based on models or inputs that are less observable or unobservable in the market, the determination of fair value requires more judgment. Accordingly, the degree of judgment exercised in determining fair value is greatest for instruments categorized in level 3.
The inputs used to measure fair value may fall into different levels of the fair value hierarchy. In such cases, for disclosure purposes, the level in the fair value hierarchy within which the fair value measurement falls in its entirety, is determined based on the lowest level input that is significant to the fair value measurement in its entirety.
FAIR VALUE MEASUREMENTS
A description of the valuation techniques applied to the Fund’s major categories of assets and liabilities measured at fair value on a recurring basis follows.
12
Notes to Financial Statements - continued
Equity securities (common stocks). Equity securities generally are valued by using market quotations, but may be valued on the basis of prices furnished by a pricing service when the Adviser believes such prices accurately reflect the fair value of such securities. Securities that are traded on any stock exchange or on the NASDAQ over-the-counter market are generally valued by the pricing service at the last quoted sale price. Lacking a last sale price, an equity security is generally valued by the pricing service at its last bid price. Generally, if the security is traded in an active market and is valued at the last sale price, the security is categorized as a level 1 security. When market quotations are not readily available, when the Adviser determines that the market quotation or the price provided by the pricing service does not accurately reflect the current fair value, or when restricted securities are being valued, such securities are valued as determined in good faith by the Adviser, subject to review of the Board of Trustees (the “Trustees” or the “Board”) and are categorized in level 2 or level 3, when appropriate.
In accordance with the Trust’s good faith pricing guidelines, the Adviser is required to consider all appropriate factors relevant to the value of securities for which it has determined other pricing sources are not available or reliable as described above. There is no single standard for determining fair value controls, since fair value depends upon the circumstances of each individual case. As a general principle, the current fair value of an issue of securities being valued by the Adviser would appear to be the amount which the owner might reasonably expect to receive for them upon their current sale. Methods which are in accordance with this principle may, for example, be based on (i) a multiple of earnings; (ii) a discount from market of a similar freely traded security (including a derivative security or a basket of securities traded on other markets, exchanges or among dealers); or (iii) yield to maturity with respect to debt issues, or a combination of these and other methods.
The following table summarizes the inputs used to value the Fund’s assets measured at fair value as of December 31, 2018:
| Valuation Inputs of Assets | | Level 1 | | Level 2 | | Level 3 | | Total |
| Common Stocks | | $27,778,266 | | $0 | | $0 | | $27,778,266 |
| Total Investments in Securities | | $27,778,266 | | $0 | | $0 | | $27,778,266 |
Refer to the Fund’s Schedule of Investments for a listing of securities by industry. The Fund did not hold any Level 3 assets during the fiscal year ended December 31, 2018. There were no transfers into or out of the levels during the fiscal year ended December 31, 2018. It is the Fund’s policy to consider transfers into or out of the levels as of the end of the reporting period.
The Fund did not invest in derivative instruments during the fiscal year ended December 31, 2018.
4.) INVESTMENT ADVISORY AGREEMENT AND RELATED PARTY TRANSACTIONS
The Fund has entered into an investment advisory agreement (“Management Agreement”) with the Adviser. The Adviser manages the investment portfolio of the Fund, subject to policies adopted by the Trust’s Board of Trustees, and, at its own expense and without reimbursement from the Fund, furnishes office space and all necessary office facilities, equipment, and executive personnel necessary for managing the Fund. The Adviser pays the expenses of the Fund except for the management fee, all brokerage fees and commissions, taxes, borrowing costs (such as (a) interest and (b) dividend expenses on securities sold short), fees and expenses of acquired funds, extraordinary or non-recurring expenses as may arise, including litigation to which the Fund may be a party and indemnification of the Trust’s Trustees and officers with respect thereto. For its services, the Adviser receives a management fee equal to 1.50% of the average daily net assets of the Fund.
For the fiscal year ended December 31, 2018, the Adviser earned management fees totaling $460,818, of which $36,195 was due to the Adviser at December 31, 2018.
5.) RELATED PARTY TRANSACTIONS
Mr. Jeffrey R. Provence of Premier Fund Solutions, Inc. (the “Administrator”) also serves as trustee/officer of the Fund. This individual receives benefits from the Administrator resulting from administration fees paid to the Administrator of the Fund by the Adviser.
The Trustees who are not interested persons of the Trust each received $1,500, for a total of $4,500, in Trustees’ fees plus travel and related expenses related to the Bretton Fund for the fiscal year ended December 31, 2018. Under the Management Agreement, the Adviser pays these fees.
13
Notes to Financial Statements - continued
6.) PURCHASES AND SALES OF SECURITIES
For the fiscal year ended December 31, 2018, purchases and sales of investment securities other than U.S. Government obligations and short-term investments aggregated $3,411,233 and $4,053,730, respectively. Purchases and sales of U.S. Government obligations aggregated $0 and $0, respectively.
7.) CONTROL OWNERSHIP
The beneficial ownership, either directly or indirectly, of more than 25% of the voting shares of a fund creates a presumption of control of the fund, under Section 2(a)(9) of the Investment Company Act of 1940. As of December 31, 2018, YDB LLC, beneficially held, in aggregate, approximately 35.84% of the Fund and Thao Dodson, held, in aggregate, approximately 29.35% of the Fund and therefore, each may be deemed to control the Fund.
8.) TAX MATTERS
For Federal income tax purposes, the cost of investments owned at December 31, 2018, was $20,026,562. At December 31, 2018, the composition of unrealized appreciation (the excess of value over tax cost) and depreciation (the excess of tax cost over value) was as follows:
| | Appreciation | | (Depreciation) | | Net Appreciation (Depreciation) |
| | $8,384,946 | | ($633,242) | | $7,751,704 |
As of December 31, 2018, there are no differences between book basis and tax basis unrealized appreciation.
The tax character of distributions was as follows:
| | | 2018 | | | 2017 | |
| Ordinary Income. | | $ -0- | | | $ -0- | |
| Long-Term Capital Gain | | 240,110 | | | -0- | |
| | | $ 240,110 | | | $ -0- | |
As of December 31, 2018, the components of distributable earnings (accumulated losses) on a tax basis were as follows:
| Undistributed capital gains | | $14 |
| Unrealized appreciation (depreciation) | | 7,751,704 |
| | | $7,751,718 |
During the fiscal year ended December 31, 2018, the Fund utilized $213,801 of capital loss carryforwards.
9.) SUBSEQUENT EVENTS
Subsequent events after the date of the Statement of Assets and Liabilities have been evaluated through the date the financial statements were issued. Management has concluded that there is no impact requiring adjustment to or disclosure in the financial statements.
14
REPORT OF INDEPENDENT REGISTERED PUBLIC ACCOUNTING FIRM
To the Shareholders of Bretton Fund and
Board of Trustees of PFS Funds
Opinion on the Financial Statements
We have audited the accompanying statement of assets and liabilities, including the schedule of investments, of Bretton Fund (the “Fund”), a series of PFS Funds, as of December 31, 2018, and the related statement of operations for the year then ended, the statements of changes in net assets for each of the two years in the period then ended, including the related notes, and the financial highlights for each of the five years in the period then ended (collectively referred to as the “financial statements”). In our opinion, the financial statements present fairly, in all material respects, the financial position of the Fund as of December 31, 2018, the results of its operations for the year then ended, the changes in its net assets for each of the two years in the period then ended, and the financial highlights for each of the five years in the period then ended, in conformity with accounting principles generally accepted in the United States of America.
Basis for Opinion
These financial statements are the responsibility of the Fund’s management. Our responsibility is to express an opinion on the Fund’s financial statements based on our audits. We are a public accounting firm registered with the Public Company Accounting Oversight Board (United States) (“PCAOB”) and are required to be independent with respect to the Fund in accordance with the U.S. federal securities laws and the applicable rules and regulations of the Securities and Exchange Commission and the PCAOB.
We conducted our audits in accordance with the standards of the PCAOB. Those standards require that we plan and perform the audit to obtain reasonable assurance about whether the financial statements are free of material misstatement, whether due to error or fraud.
Our audits included performing procedures to assess the risks of material misstatement of the financial statements, whether due to error or fraud, and performing procedures that respond to those risks. Such procedures included examining, on a test basis, evidence regarding the amounts and disclosures in the financial statements. Our procedures included confirmation of securities owned as of December 31, 2018, by correspondence with the custodian. Our audits also included evaluating the accounting principles used and significant estimates made by management, as well as evaluating the overall presentation of the financial statements. We believe that our audits provide a reasonable basis for our opinion.
We have served as the Fund’s auditor since 2010.

COHEN & COMPANY, LTD.
Cleveland, Ohio
February 19, 2019
15
Additional Information
December 31, 2018
(Unaudited)
1.) AVAILABILITY OF QUARTERLY SCHEDULE OF INVESTMENTS
The Fund files its complete schedule of portfolio holdings with the Securities and Exchange Commission (“SEC”) for the first and third quarters of each fiscal year on Form N-Q. The Fund’s Form N-Q is available on the SEC’s website at http://www.sec.gov. The Fund’s Form N-Q may also be reviewed and copied at the SEC’s Public Reference Room in Washington, DC. Information on the operation of the Public Reference Room may be obtained by calling 800.SEC.0330.
2.) PROXY VOTING GUIDELINES
Bretton Capital Management, LLC, the Fund’s investment adviser (“Adviser”), is responsible for exercising the voting rights associated with the securities held by the Fund. A description of the policies and procedures used by the Adviser in fulfilling this responsibility is availablewithout charge on the Fund’s website at www.brettonfund.com. It is also included in the Fund’s Statement of Additional Information, which is available on the SEC’s website at http://www.sec.gov.
Information regarding how the Fund voted proxies, Form N-PX, relating to portfolio securities during the most recent 12-month period ended June 30, is available without charge, upon request, by calling our toll free number (800.231.2901) . This information is also available on the SEC’s website at http://www.sec.gov.
3.) DISCLOSURE OF EXPENSES
As a shareholder of the Fund, you incur ongoing expenses consisting solely of management fees. You will be assessed fees for outgoing wire transfers, returned checks and stop payment orders at prevailing rates charged by Mutual Shareholder Services, LLC, the Fund’s transfer agent, and IRA accounts will be charged an $8.00 annual maintenance fee. This Example is intended to help you understand your ongoing costs (in dollars) of investing in the Fund and to compare these costs with the ongoing costs of investing in other mutual funds.
The Example is based on an investment of $1,000 invested in the Fund on July 1, 2018, and held through December 31, 2018.
Actual Expenses
The first line of the table below provides information about actual account values and actual expenses. You may use the information in this line, together with the amount you invested, to estimate the expenses that you paid over the period. Simply divide your account value by $1,000 (for example, an $8,600 account value divided by $1,000 = 8.6), then multiply the result by the number in the first line under the heading entitled “Expenses Paid During Period” to estimate the expenses you paid on your account during this period.
Hypothetical Example for Comparison Purposes
The second line of the table below provides information about hypothetical account values and hypothetical expenses based on the Fund’s actual expense ratio and an assumed rate of return of 5% per year before expenses, which is not the Fund’s actual return. The hypothetical account values and expenses may not be used to estimate the actual ending account balance or expenses you paid for the period. You may use this information to compare the ongoing costs of investing in this Fund and other funds. To do so, compare this 5% hypothetical example with the 5% hypothetical examples that appear in the shareholder reports of the other funds.
Please note that the expenses shown in the table are meant to highlight your ongoing costs only and do not reflect any transactional costs, such as sales charges (loads) or the charges assessed by Mutual Shareholder Services, LLC as described above. Therefore, the second line of the table is useful in comparing ongoing costs only, and will not help you determine the relative cost of owning different funds. In addition, if these transactional costs were included, your cost could have been higher.
16
| Additional Information (Unaudited) - continued | | |
| |
| | | | | | | Expenses Paid |
| | | Beginning | | Ending | | During the Period* |
| | | Account Value | | Account Value | | July 1, 2018 to |
| | | July 1, 2018 | | December 31, 2018 | | December 31, 2018 |
| |
| Actual | | $1,000.00 | | $944.79 | | $7.35 |
| |
| Hypothetical | | $1,000.00 | | $1,017.64 | | $7.63 |
| (5% annual return | | | | | | |
| before expenses) | | | | | | |
| * | Expenses are equal to the Fund’s annualized expense ratio of 1.50%, multiplied by the average account value over the period, multiplied by 184/365 (to reflect the one-half year period ended December 31, 2018). |
| |
17
Trustees and Officers
(Unaudited)
The Board of Trustees supervises the business activities of the Trust. The names of the Trustees and executive officers of the Trust are shown below. For more information regarding the Trustees, please refer to the Statement of Additional Information, which is available upon request by calling 800.231.2901. Each Trustee serves until the Trustee sooner dies, resigns, retires, or is removed.
The Trustees and Officers of the Trust and their principal business activities during the past five years are:
Interested Trustees and Officers
| | | | | Number of | |
| | | | Principal | Portfolios In | Other |
| Name, | Position(s) | Term of Office | Occupation(s) | Fund | Directorships |
| Address(1), | Held With | and Length of | During | Complex | Held By |
| and Year of Birth | the Trust | Time Served | Past 5 Years | Overseen By | Trustee |
| | | | | Trustee | |
| |
| Ross C. Provence, | President | Indefinite Term; | General Partner and Portfolio | N/A | N/A |
| Year of Birth: 1938 | | Since 2000 | Manager for Value Trend Capital | | |
| | | | Management, LP (1995 to current). | | |
| | | | Estate planning attorney (1963 to | | |
| current). |
| |
| Jeffrey R. Provence(2), | Trustee, | Indefinite Term; | CEO, Premier Fund Solutions, Inc. | 7 | Blue Chip |
| Year of Birth: 1969 | Secretary | Since 2000 | (2001 to current). General Partner | | Investor Funds |
| | and | | and Portfolio Manager for Value | | Meeder Funds |
| | Treasurer | | Trend Capital Management, LP | | |
| | | | (1995 to current). | | |
| |
| Julian G. Winters, | Chief | Indefinite Term; | Managing Member, Watermark | N/A | N/A |
| Year of Birth: 1968 | Compliance | Since 2010 | Solutions LLC (investment compli- | | |
| | Officer | | ance and consulting) (2007 to cur- | | |
| rent). |
(1)The address of each trustee and officer is c/o PFS Funds, 1939 Friendship Drive, Suite C, El Cajon, California 92020.
(2)Jeffrey R. Provence is considered an "interested person" as defined in Section 2(a)(19) of the Investment Company Act of 1940 by virtue of his position with the Trust.
| | | | | Number of | |
| | | | Principal | Portfolios In | Other |
| Name, | Position | Term of Office | Occupation(s) | Fund | Directorships |
| Address(1), | Held With | and Length of | During | Complex | Held By |
| and Year of Birth | the Trust | Time Served | Past 5 Years | Overseen By | Trustee |
| | | | | Trustee | |
| |
| Thomas H. Addis III, | Independent | Indefinite Term; | Executive Director/CEO, Southern | 7 | None |
| Year of Birth: 1945 | Trustee | Since 2000 | California PGA (2006 to current). | | |
| |
| Allen C. Brown, | Independent | Indefinite Term; | Law Office of Allen C. Brown, | 7 | Blue Chip |
| Year of Birth: 1943 | Trustee | Since 2010 | estate planning and business attor- | | Investor Funds |
| | | | ney (1970 to current). | | |
| |
| George Cossolias, CPA, | Independent | Indefinite Term; | Partner of CWDL, CPAs (February 1, | 7 | Blue Chip |
| Year of Birth: 1935 | Trustee | Since 2000 | 2014 to current). Owner of George | | Investor Funds |
| | | | Cossolias & Company, CPAs (1972 | | |
| | | | to January 31, 2014). President of | | |
| | | | LubricationSpecialists, Inc. (1996 to | | |
| current). |
(1)The address of each trustee and officer is c/o PFS Funds, 1939 Friendship Drive, Suite C, El Cajon, California 92020.
18

Investment Adviser
Bretton Capital Management, LLC
Legal Counsel
Practus, LLP
Custodian
US Bank, N.A.
Dividend Paying Agent,
Shareholders’ Servicing Agent,
Transfer Agent
Mutual Shareholder Services, LLC
Fund Administrator
Premier Fund Solutions, Inc.
Independent Registered Public Accounting Firm
Cohen & Company, Ltd.
Distributor
Rafferty Capital Markets, LLC |
This report is provided for the general information of the shareholders of the Bretton
Fund. This report is not intended for distribution to prospective investors in the Fund,
unless preceded or accompanied by an effective prospectus. |
Item 2. Code of Ethics.
The registrant has adopted a code of ethics that applies to the registrant’s principal executive officer and the principal financial officer. The registrant has not made any amendments to its code of ethics during the covered period. The registrant has not granted any waivers from any provisions of the code of ethics during the covered period. A copy of the registrant’s Code of Ethics is filed herewith.
Item 3. Audit Committee Financial Expert.
The registrant’s Board of Trustees has determined that George Cossolias is an audit committee finical expert. Mr. Cossolias is independent for purposes of this Item 3.
Item 4. Principal Accountant Fees and Services.
(a-d) The following table details the aggregate fees billed for each of the last two fiscal years for audit fees, audit-related fees, tax fees and other fees by the principal accountant to the registrant. The principal accountant has provided no services to the adviser or any entity controlled by, or under common control with the adviser that provides ongoing services to the registrant.
| | | FYE 12/31/18 | | FYE 12/31/17 |
| Audit Fees | | $13,250 | | $13,250 |
| Audit-Related Fees | | $0 | | $0 |
| Tax Fees | | $3,000 | | $2,500 |
| All Other Fees | | $750 | | $750 |
Nature of Tax Fees: preparation of Excise Tax Statement and 1120 RIC.
All Other Fees: Semi-Annual Report Review
(e) (1) The audit committee approves all audit and non-audit related services and, therefore, has not adopted pre-approval policies and procedures described in paragraph (c)(7) of Rule 2-01 of Regulation S-X.
(e) (2) None of the services described in paragraph (b) through (d) of this Item were approved by the audit committee pursuant to paragraph (c)(7)(i)(C) of Rule 2-01 of Regulation S-X.
(f) All of the principal accountant’s hours spent on auditing the registrant’s financial statements were attributed to work performed by full-time permanent employees of the principal accountant.
(g) The following table indicates the aggregate non-audit fees billed by the registrant’s principal accountant for services to the registrant , the registrant’s investment adviser (not sub-adviser), and any entity controlling, controlled by, or under common control with the adviser that provides ongoing services to the registrant, for the last two years.
| Non-Audit Fees | | FYE 12/31/18 | | FYE 12/31/17 |
| Registrant | | $3,750 | | $3,250 |
| Registrant’s Investment Adviser | | $0 | | $0 |
(h) The principal accountant provided no services to the investment adviser or any entity controlling, controlled by, or under common control with the adviser that provides ongoing services to the registrant.
Item 5. Audit Committee of Listed Companies.Not applicable.
Item 6. Investments.
(a) Not applicable. Schedule filed with Item 1.
(b) Not applicable.
Item 7. Disclosure of Proxy Voting Policies and Procedures for Closed-End Management Investment Companies.Not applicable.
Item 8. Portfolio Managers of Closed End Management Investment Companies.Not applicable.
Item 9. Purchases of Equity Securities by Closed-End Management Investment Companies and Affiliated Purchasers.Not applicable.
Item 10. Submission of Matters to a Vote of Security Holders.
The registrant has not adopted procedures by which shareholders may recommend nominees to the registrant’s board of trustees.
Item 11. Controls and Procedures.
(a) The Registrant’s president and chief financial officer concluded that the disclosure controls and procedures (as defined in Rule 30a-3(c) under the Act (17 CFR 270.30a -3(c))) as of a date within 90 days of the filing date of the report that includes the disclosure required by this paragraph, based on the evaluation of these controls and procedures required by Rule 30a-3(b) under the Act (17 CFR 270.30a -3(b)) and Rules 13a-15(b) or 15d-15(b) under the Exchange Act (17 CFR 240.13a -15(b) or 240.15d -15(b)).
(b) There were no changes in the registrant’s internal control over financial reporting (as defined in Rule 30a-3(d) under the Act (17 CFR 270.30a -3(d)) that occurred during the period covered by this report that has materially affected, or is reasonably likely to materially affect, the registrant’s internal control over financial reporting.
Item 12. Disclosure of Securities Lending Activities for Closed-End Management Investment Companies.
Not applicable.
Item 13. Exhibits.
(a)(1) Code of Ethics. Filed herewith.
(a)(2) Certifications pursuant to Section 302 of the Sarbanes-Oxley Act of 2002.Filed herewith.
(a)(3)Not applicable.
(a)(4) Not applicable.
(b)Certification pursuant to Section 906 of the Sarbanes-Oxley Act of 2002.Filed herewith.
Pursuant to the requirements of the Securities Exchange Act of 1934 and the Investment Company Act of 1940, the registrant has duly caused this report to be signed on its behalf by the undersigned, thereunto duly authorized.
| | By:/s/Ross C. Provence
Ross C. Provence
President |
Pursuant to the requirements of the Securities Exchange Act of 1934 and the Investment Company Act of 1940, this report has been signed below by the following persons on behalf of the registrant and in the capacities and on the dates indicated.
| | By:/s/Ross C. Provence
Ross C. Provence
President |
| | By:/s/Jeffrey R. Provence
Jeffrey R. Provence
Chief Financial Officer |