UNITED STATES
SECURITIES AND EXCHANGE COMMISSION
WASHINGTON, D.C. 20549
FORM N-CSR
CERTIFIED SHAREHOLDER REPORT OF REGISTERED MANAGEMENT
INVESTMENT COMPANIES
Investment Company Act file number811-09781
PFS Funds
(Exact name of registrant as specified in charter)
1939 Friendship Drive, Suite C, El Cajon, CA 92020
(Address of principal executive offices) (Zip code)
CT Corporation System
155 Federal St., Suite 700, Boston, MA 02110
(Name and address of agent for service)
Registrant’s telephone number, including area code:(619) 588-9700
Date of fiscal year end:December 31
Date of reporting period:December 31, 2019
Item 1. Report to Stockholders.

| | IMPORTANT NOTE:Beginning on January 1, 2021, as permitted by regulations adopted by the
Securities and Exchange Commission, paper copies of the Fund's shareholder reports will no longer be
sent by mail, unless you specifically request paper copies of the reports from the Fund or from your
financial intermediary, such as a broker-dealer or bank. Instead, the reports will be made available on a
website, and you will be notified by mail each time a report is posted and provided with a website link to
access the report.
If you already elected to receive shareholder reports electronically, you will not be affected by this change
and you need not take any action. You may elect to receive shareholder reports and other
communications from the Fund or your financial intermediary electronically by calling or sending an email
request.
You may elect to receive all future reports in paper free of charge. You can inform the Fund or your
financial intermediary that you wish to continue receiving paper copies of your shareholder reports by
calling or sending an email request. Your election to receive reports in paper will apply to all funds held
with the fund complex/your financial intermediary. |
Annual Report
December 31, 2019
BRTNX |
February 14, 2020
Dear Fellow Shareholders:
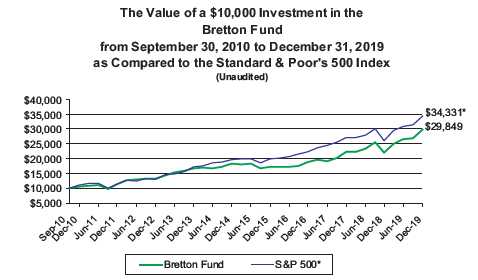
The Bretton Fund’s net asset value per share (NAV) as of December 31, 2019, was $40.63, and the total return for the year was 35.39% .
Returns as of December 31, 2019(A)
| | | | | | Annualized | | Annualized | | Annualized | |
| | 4th Quarter | | 1 Year | | 3 Years | | 5 Years | | Since Inception | |
| Bretton Fund | 10.65% | | 35.39% | | 16.20% | | 10.16% | | 12.55% | |
| S&P 500 Index(B) | 9.07% | | 31.49% | | 15.27% | | 11.70% | | 14.26% | |
Calendar Year Total Returns(A)
| | Bretton Fund | | S&P 500 Index(B) | |
| 2019 | 35.39% | | 31.49% | |
| 2018 | -1.94% | | -4.38% | |
| 2017 | 18.19% | | 21.83% | |
| 2016 | 10.68% | | 11.96% | |
| 2015 | -6.59% | | 1.38% | |
| 2014 | 9.79% | | 13.69% | |
| 2013 | 26.53% | | 32.39% | |
| 2012 | 15.66% | | 16.00% | |
| 2011 | 7.90% | | 2.11% | |
| 9/30/10–12/31/10 | 6.13% | | 10.76% | |
| Cumulative Since Inception | 198.49% | | 243.31% | |
(A)All returns include change in share prices and, in each case, include reinvestment of any dividends and capital gain distributions. The inception date of the Bretton Fund was September 30, 2010.
(B)The S&P 500® Index is a stock market index based on the market capitalizations of 500 leading companies publicly traded in the US stock market, as determined by Standard & Poor’s, and captures approximately 80% coverage of available market capitalization.
Performance data quoted represents past performance. Past performance does not guarantee future results. The investment return and principal value of an investment will fluctuate so that an investor’s shares, when redeemed, may be worth more or less than their original cost. Current performance may be lower or higher than the performance data quoted. You may obtain performance data current to the most recent month-end at http://brettonfund.com or by calling 800.231.2901.
All returns include change in share prices, reinvestment of any dividends, and capital gains distributions. Indices shown are broad-based, unmanaged indices commonly used to measure performance of US stocks. These indices do not incur expenses and are not available for investment. The fund’s expense ratio is 1.35% (effective January 1, 2020).The fund’s principal underwriter is Rafferty Capital Markets, LLC.
1
4th Quarter
Continental Building Products, our Virginia-based maker of drywall, announced in November that it was being acquired by French construction-materials giant Saint-Gobain for $37 per share in cash, 37% above where the stock was trading at the beginning of the quarter and 52% above our average cost. This nice little windfall boosted the fund by 1.6% in the quarter.
Our banks rallied in the quarter on improved interest rates and trading activity. Bank of America added 1.1% to the fund, while JPMorgan Chase added 0.9% .
The two laggards this quarter were Progressive and Armanino Foods, which took off 0.3% and 0.1%, respectively.
Contributors to Performance for 2019
In a big year for the market, none of our holdings declined in value. The largest contributors were Mastercard, which boosted the fund by 2.9%, Alphabet 2.4%, NVR 2.2%, and Bank of America 2.1% . Homebuilder NVR’s contribution was especially notable. A year ago, the sentiment on homebuilders was bleak and the stock beaten up, even though the business fundamentals were fine. A year later, NVR is building and selling houses at the same rate, and its stock is up 56%.
Even though all our stocks appreciated, a handful lagged the market materially, most notably Berkshire Hathaway, which still did contribute +0.5% to performance. A combination of Berkshire’s inability to deploy its growing pile of excess cash into productive investments and its collection of slow-but-steady businesses left it trailing a hot market.
Taxes
For the second time in three years, we avoided making any tax distributions to shareholders despite the market appreciation. A combination of low turnover and attentiveness to tax implications has put our three-year tax burden 95% below the average fund in our category according to Morningstar.
Expense Ratio
As the fund has grown, we’ve been better able to cover operating costs, so we’ve lowered the expense ratio from 1.50% to 1.35%, effective January 1, 2020.
Portfolio
| Security | % of Net Assets | |
| Alphabet, Inc. | 9.1% | |
| MasterCard, Inc. | 6.7% | |
| Union Pacific Corp. | 6.6% | |
| Ross Stores, Inc. | 6.0% | |
| Continental Building Products, Inc. | 5.9% | |
| Bank of America Corp. | 5.7% | |
| NVR, Inc. | 5.4% | |
| Visa, Inc. | 5.2% | |
| JPMorgan Chase & Co. | 5.1% | |
| AutoZone, Inc. | 5.0% | |
| The TJX Companies Inc. | 5.0% | |
| American Express Co. | 4.9% | |
| The Progressive Corporation | 4.7% | |
| Wells Fargo & Company | 4.6% | |
| Canadian Pacific Railway Limited | 4.5% | |
| Carter’s, Inc. | 4.4% | |
| Berkshire Hathaway, Inc. | 4.0% | |
| Discovery Communications, Inc. | 2.6% | |
| Microsoft Corporation | 2.1% | |
2
| Armanino Foods of Distinction, Inc. | 2.0 | % |
| Cash* | 0.5 | % |
* Cash represents cash and other assets in excess of liabilities.
Consumer
We’ve now owned Ross Stores close to 10 years, and it’s been nothing if not consistently great. Off-price retail remains a thriving oasis in the retail apocalypse. Visits to the mall are down, but both Ross and TJX keep seeing more shoppers in their stores and do quite well among young shoppers, the demographic most likely to buy online. For enough of a bargain and the right “treasure hunt” experience, people are more than happy to get in their cars and peruse the aisles. Ross is on track to increase earnings per share an estimated 9% and TJX 7%. Earnings growth was a little below the usual pace as costs were a bit elevated due to higher wages and some infrastructure investments. Ross returned 41.3% last year and TJX 38.8% .
NVR was one of our best performers last year with its 56.3% return and a 14% earnings per share increase. We estimate earnings per share increased 9%.
AutoZone’s stock continued its rebound after an investor panic a couple of years ago over its susceptibility to being “Amazoned,” which didn’t end up materializing. AutoZone’s stock followed up a strong 2018—up 18%—with a 42.1% appreciation in 2019. Earnings per share increased 30%, in part from the prior-year tax law changes and partly from strong operating performance. “Good” weather, which in AutoZone’s case means lots of snow and rain that drive auto-parts purchases, also helped.
In yet another retail comeback story, Carter’s, our worst performer in 2018, bounced back with a 36.8% total return. Challenges remain—tariffs, the loss of Toys “R” Us, declining US births—but its core business of selling great, affordable baby clothes remains healthy. We estimate earnings per share increased 4%.
Discovery, having now digested the Scripps acquisition that brought Food Network and HGTV into its fold, has delivered on its promised benefits. It’s producing free cash flow of $3 billion, more than double its pre-acquisition levels. Debt has been paid down, and stock buybacks have resumed. It’s now on all the major online live-TV platforms (e.g., Hulu Live TV, YouTube TV), and its nascent efforts to directly build subscription video services for “superfans” of various interests like golf and cooking have started to bear fruit. Naturally, a cable TV company in a cord-cutting world has its work cut out for it, but the financials have held up well and the company is growing. We estimate last year’s earnings per share increased 78%; the stock rose 32.3% .
Armanino Foods’ earnings are on pace to increase a bit over the prior year, and the stock returned 26.4% . People keep buying frozen pesto sauce, and we keep seeing the returns.
Financials|
Since our 2011 purchase of JPMorgan Chase, our total return is 182%, nearly a triple. In 2019 alone, the stock returned 47.3% as earnings per share increased 19%. Despite that run, it still trades for a mere 13 times earnings compared to 20 times for the rest of the market. After the financial crisis, banks were almost untouchable, and while both earnings and sentiment have since significantly improved, they’re still relatively out of favor. There will be another recession sooner than later, and our banks will see larger loans losses, but we think this is more than priced into the stock, and our banks are well reserved for that eventuality. Bank of America’s total return was 46.2% and earnings per share up 12%. Problem child Wells Fargo remains in the regulatory penalty box. Earnings per share declined 4% and the stock’s total return was 21.4% . We think highly of new CEO Charlie Scharf, and we also believe the regulatory and cost control issues will be manageable in the long run. We are concerned about its shrinking revenue and
3
the timing of the regulatory relief, but we feel the stock is so cheap at these levels that we’ll do well from here.
American Express quietly put up a strong year, returning 32.5% and increasing earnings per share 12%. It expanded its merchant coverage to narrow the gap with Visa and Mastercard, fought off stiffer competition for its high-spending cardholders, and expanded its lending while maintaining pristine credit costs. Similar to the banks, it remains significantly undervalued compared to the rest of the market even with its above-average profitability and growth.
Progressive, whose results can be lumpy due to the nature of insurance underwriting and investment returns, saw a surge in premiums (+15%), policies in force (+10%) revenue (+22%), and earnings per share (+52%). Auto insurance in general isn’t a great business—the industry as a whole doesn’t break even on an underwriting basis—but through a combination of a direct-to-consumer business model, clever marketing, cost advantages from scale, and superior data analysis, Progressive both grows faster and is more profitable than the rest of the industry. We think its ability to collect and analyze more data, partly through its usage-based insurance program, is giving it an increasing competitive advantage. Despite its fast growth, its market share is still only 11%; it’s got a very long runway ahead of it. Its return was 25.1% last year.
Information Technology
Alphabet, better known by its main business Google, returned 29.1% and had another year of great revenue growth (+22%) but less-great earnings per share growth (+12%). Much of the increased costs came from ramping up its investments into future lines of business, some of which are likely to pay off handsomely, while others are likely to destroy shareholder value. The problem is that it’s not clear which ones are which. Google lumps these efforts into a category called “Other Bets,” which includes its much-touted self-driving-car initiative Waymo as well as its now-defunct effort to measure insulin levels in diabetics via chip-enabled contact lenses. If we had our druthers, we’d rather Google dial back its Other Bets a bit, but the core business is so strong that it’s unlikely to impact our investment too much. The company also announced cofounder Larry Page would transition the CEO role to Sundar Pichai, who’s been running the Google division for years. We don’t know much about Pichai’s capital allocation strategy and philosophy around corporate focus, but we do know cofounders Page and Sergey Brin were especially enamored of side projects.
Mastercard and Visa continued their run of great performance, increasing earnings per share 23% and 18%, and returning 59.2% and 43.3%, respectively. The stocks are no longer cheap, but with so many years of strong growth ahead of them, we think they’ll do well over the long run.
We added Microsoft to the fund in the fourth quarter and are up 14% to date. We describe the investment more fully below.
Industrials
Despite a 6% drop in freight volume, Union Pacific increased its earnings per share by 6%. There remains no cheaper way to ship bulk goods across the US than rail, and it’s effectively impossible to duplicate its network from scratch today. Its recent embrace of “precision railroading” has gone as well as can be expected, leading to improved on-time performance and significant cost reduction that’s allowed it to increase earnings in a year when volume contracted. We think there’s even more improvement to be had. Its stock returned 33.1% . Canadian Pacific enjoys similar structural competitive advantages as its US counterparts, yet with even greater profitability. Earnings per share improved 13%, and total return was 38.1% .
Berkshire Hathaway can be thought of as three distinct businesses: 1) a collection of wholly-owned, mostly industrial businesses like BNSF Railway and Benjamin Moore; 2)
4
insurance, including GEICO and one of the world’s largest reinsurers; and 3) an investment function that manages the insurance business’s reserves (“float”). Investing insurance float, which is essentially borrowed money from policyholders, into businesses and stocks amplifies their returns. The operating businesses generate significant amounts of cash, and when combined with the ever-increasing float from insurance premiums, Berkshire is constantly putting greater amounts of cash to work. In a somewhat expensive market, that’s hard to do at scale, and Berkshire now has over $100 billion burning a hole in its pocket. Despite the cash drag, we estimate it increased book value per share by 20% last year, while its stock appreciated 11.0% . We think its collection of great businesses leveraged by its insurance operations will do quite well over time.
When we first bought Continental Building Products in 2016, we suspected it would be an acquisition target, but definitely weren’t counting on it. The business has grown nicely while returning capital to shareholders. The total return for the year was 43.1% .
Microsoft
It’s difficult to find the right vantage point to look at Microsoft. It is so massive that each of its three operating divisions (Office, Cloud, and Windows/Xbox) would, if spun off, be the second largest pure-play software company in the world. Its cash balance is about the size of the book equity of Goldman Sachs and U.S. Bank—put together. For over a decade and a half after the beginning of its antitrust litigation in 1998, it drifted on a strange form of cruise control: stupendously profitable and seemingly unconcerned with the future or even the present. Internet search took off, and Microsoft took a dozen years to respond to Google. Apple—rescued by a $150 million infusion of Microsoft cash in 1997—built its renaissance on easy-to-use, aesthetically pleasing devices; Microsoft left the field to its hardware customers. Apple built an innovative, simple phone operating system; Microsoft tried to make Windows run on a phone. The company seemed to be slowly drifting into irrelevance. Revenue growth slowed down to a mere 5–6% while Google and Apple were regularly putting up 20% and 50% growth rates.
Then a couple things happened: Microsoft got a new CEO, and corporate IT departments began shifting their computing operations to the cloud en masse. We are generally skeptical of attributing much corporate performance to the person who happens to be CEO. If a company has a genuine competitive advantage, we expect the leader to be replaceable. That said, the switch from Steve Ballmer to Satya Nadella was material, and we wish we had realized it sooner. Nadella came from the cloud-computing business and was able to end a corporate culture that prioritized Windows over all else. And, after flirting with outsourced computing for decades, businesses are now realizing the security, cost, and technical advantages of having Microsoft run their IT systems for them. The results have been extraordinary. Revenue is now growing in the mid-teens, pulled up by the 70% growth in its outsourced computing business, Azure. The shift to cloud computing is just getting under way. We are a little wary of owning such a goliath for 30 times earnings, but we think this is a special company.
Investments Initiated in 2019
Microsoft Corporation
Investments Exited During 2019
The fund did not exit any investments in 2019.
Investing Climate
Last year, we wrote, “Stock market multiples have contracted considerably. For people who are looking to buy earnings streams inexpensively, this is a major development. After years of struggling to find enough investments with a margin of safety to protect against economic shocks, we find ourselves in the somewhat unusual position of being modestly sanguine about the market.”
5
The market is up about a third, so, in a way, we’re a third less sanguinely optimistic. Stocks are more expensive than their historical average, but not excessively so, like the 1999–2000 market. This could mean the next 10 years won’t be as great as the last 10, which saw the S&P 500 return an annualized 14%. The average return for stocks is about 10% before inflation, so a repeat of the last 10 years isn’t likely, but that doesn’t mean the next 10 are going to be awful. We believe stocks still represent the most compelling asset class out there, and we feel our small collection of good businesses at reasonable prices will do quite well in the years to come.
As always, thank you for investing.
Stephen Dodson
Portfolio Manager | Raphael de Balmann
Portfolio Manager |
6
Bretton Fund by Sectors
(as a percentage of Net Assets)
(Unaudited)
December 31, 2019 |
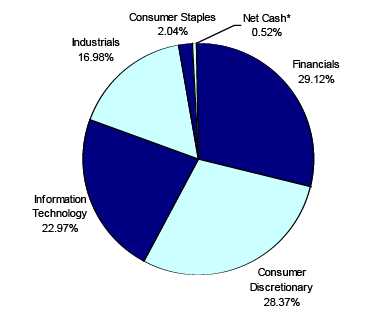
* Net Cash represents cash and other assets in excess of liabilities.
7
| Bretton Fund | |
| | | | | | | Schedule of Investments |
| | | | | | | December 31, 2019 |
| Shares | | Cost | | Fair Value | | % of Net Assets |
| COMMON STOCKS | | | | | | | | |
| | | | | | | |
| Apparel & Other Finished Products of Fabrics & Similar Material | | | | | | |
| 17,000 | Carter's, Inc. | $ | 1,300,331 | | $ | 1,858,780 | | 4.42 | % |
| Cable & Other Pay Television Services | | | | | | | | |
| 33,500 | Discovery Communications, Inc. - Class A * | | 1,065,807 | | | 1,096,790 | | 2.61 | % |
| Canned, Frozen & Preserved Fruit, Vegetables & Food Specialties | | | | | | |
| 245,430 | Armanino Foods of Distinction, Inc. | | 241,491 | | | 859,005 | | 2.04 | % |
| Concrete, Gypsum & Plaster Products | | | | | | | | |
| 68,000 | Continental Building Products, Inc. * | | 1,657,875 | | | 2,477,240 | | 5.89 | % |
| Finance Services | | | | | | | | |
| 16,600 | American Express Company | | 1,162,234 | | | 2,066,534 | | 4.91 | % |
| Fire, Marine & Casualty Insurance | | | | | | | | |
| 7,500 | Berkshire Hathaway Inc. - Class B * | | 1,116,560 | | | 1,698,750 | | | |
| 27,500 | The Progressive Corporation | | 1,807,417 | | | 1,990,725 | | | |
| | | | 2,923,977 | | | 3,689,475 | | 8.77 | % |
| National Commercial Banks | | | | | | | | |
| 68,400 | Bank of America Corporation | | 1,087,675 | | | 2,409,048 | | | |
| 15,400 | JPMorgan Chase & Co. | | 824,088 | | | 2,146,760 | | | |
| 36,000 | Wells Fargo & Company | | 1,448,449 | | | 1,936,800 | | | |
| | | | 3,360,212 | | | 6,492,608 | | 15.44 | % |
| Operative Builders | | | | | | | | |
| 600 | NVR, Inc. * | | 1,692,501 | | | 2,285,046 | | 5.43 | % |
| Railroad, Line-Haul Operating | | | | | | | | |
| 7,400 | Canadian Pacific Railway Limited (Canada) | | 1,162,494 | | | 1,886,630 | | | |
| 15,350 | Union Pacific Corporation | | 1,243,056 | | | 2,775,127 | | | |
| | | | 2,405,550 | | | 4,661,757 | | 11.09 | % |
| Retail - Auto & Home Supply Stores | | | | | | | | |
| 1,750 | AutoZone, Inc. * | | 1,135,888 | | | 2,084,792 | | 4.96 | % |
| Retail - Family Clothing Stores | | | | | | | | |
| 21,700 | Ross Stores Inc. | | 519,491 | | | 2,526,314 | | | |
| 34,000 | The TJX Companies, Inc. | | 1,228,897 | | | 2,076,040 | | | |
| | | | 1,748,388 | | | 4,602,354 | | 10.95 | % |
| Services - Business Services, NEC | | | | | | | | |
| 9,380 | MasterCard Incorporated - Class A | | 849,356 | | | 2,800,774 | | | |
| 11,600 | Visa Inc. - Class A | | 962,813 | | | 2,179,640 | | | |
| | | | 1,812,169 | | | 4,980,414 | | 11.85 | % |
| Services - Computer Processing & Data Preparation | | | | | | | | |
| 2,850 | Alphabet Inc. - Class C * | | 2,082,582 | | | 3,810,507 | | 9.06 | % |
| Services - Prepackaged Software | | | | | | | | |
| 5,500 | Microsoft Corporation | | 761,045 | | | 867,350 | | 2.06 | % |
| Total for Common Stocks | $ | 23,350,050 | | $ | 41,832,652 | | 99.48 | % |
| Total Investments | $ | 23,350,050 | | $ | 41,832,652 | | | |
| Other Assets in Excess of Liabilities | | | | $ | 218,948 | | 0.52 | % |
| Net Assets | | | | | $ | 42,051,600 | | 100.00 | % |
| | * Non-Income Producing Securities.
The accompanying notes are an integral part of these financial statements. |
8
| Bretton Fund | | | |
| |
| Statement of Assets and Liabilities | | | |
| December 31, 2019 | | | |
| |
| Assets: | | | |
| Investments at Fair Value | $ | 41,832,652 | |
| (Cost $23,350,050) | | | |
| Cash | | 261,809 | |
| Dividend Receivable | | 10,116 | |
| Total Assets | | 42,104,577 | |
| Liabilities: | | | |
| Payable to Adviser (Note 4) | | 52,977 | |
| Total Liabilities | | 52,977 | |
| Net Assets | $ | 42,051,600 | |
| |
| Net Assets Consist of: | | | |
| Paid In Capital | $ | 23,568,998 | |
| Total Distributable Earnings | | 18,482,602 | |
| Net Assets, for 1,034,883 Shares Outstanding | $ | 42,051,600 | |
| (Unlimited shares authorized) | | | |
| Net Asset Value, Offering Price and Redemption Price Per Share | | | |
| ($42,051,600/1,034,883 shares) | $ | 40.63 | |
| |
| Statement of Operations | | | |
| For the fiscal year ended December 31, 2019 | | | |
| |
| Investment Income: | | | |
| Dividends (Net of foreign withholding taxes and fees of $2,485) | $ | 462,326 | |
| Interest | | 17 | |
| Total Investment Income | | 462,343 | |
| Expenses: | | | |
| Management Fees (Note 4) | | 544,512 | |
| Total Expenses | | 544,512 | |
| |
| Net Investment Income (Loss) | | (82,169 | ) |
| |
| Realized and Unrealized Gain (Loss) on Investments: | | | |
| Realized Gain (Loss) on Investments | | - | |
| Net Change in Unrealized Appreciation (Depreciation) on Investments | | 10,730,898 | |
| Net Realized and Unrealized Gain (Loss) on Investments | | 10,730,898 | |
| |
| Net Increase (Decrease) in Net Assets from Operations | $ | 10,648,729 | |
The accompanying notes are an integral part of these financial statements.
9
| Bretton Fund |
| | |
| Statements of Changes in Net Assets | | | | | | | | |
| | | 1/1/2019 | | | | 1/1/2018 | | |
| | | to | | | | to | | |
| | | 12/31/2019 | | | | 12/31/2018 | | |
| From Operations: | | | | | | | | |
| Net Investment Income (Loss) | $ | (82,169 | ) | | $ | (136,918 | ) | |
| Net Realized Gain (Loss) on Investments | | - | | | | 453,925 | | |
| Net Change in Unrealized Appreciation (Depreciation) on Investments | | 10,730,898 | | | | (1,015,630 | ) | |
| Increase (Decrease) in Net Assets from Operations | | 10,648,729 | | | | (698,623 | ) | |
| | |
| From Distributions to Shareholders: | | - | | | | (240,110 | ) | |
| | |
| From Capital Share Transactions: | | | | | | | | |
| Proceeds From Sale of Shares | | 3,658,038 | | | | 3,842,585 | | |
| Shares Issued on Reinvestment of Distributions | | - | | | | 240,110 | | |
| Cost of Shares Redeemed | | (271,823 | ) | | | (5,843,520 | ) | |
| Net Increase (Decrease) from Shareholder Activity | | 3,386,215 | | | | (1,760,825 | ) | |
| | |
| Net Increase (Decrease) in Net Assets | | 14,034,944 | | | | (2,699,558 | ) | |
| | |
| Net Assets at Beginning of Period | | 28,016,656 | | | | 30,716,214 | | |
| Net Assets at End of Period | $ | 42,051,600 | | | $ | 28,016,656 | | |
| | |
| Share Transactions: | | | | | | | | |
| Issued | | 109,142 | | | | 118,438 | | |
| Reinvested | | - | | | | 8,055 | | |
| Redeemed | | (7,936 | ) | | | (187,763 | ) | |
| Net Increase (Decrease) in Shares | | 101,206 | | | | (61,270 | ) | |
| Shares Outstanding Beginning of Period | | 933,677 | | | | 994,947 | | |
| Shares Outstanding End of Period | | 1,034,883 | | | | 933,677 | | |
| Financial Highlights | | | | | | | | | | | | | | | | | | | |
| Selected data for a share outstanding | | | | | | | | | | | | | | | | | | | |
| throughout the period: | | 1/1/2019 | | | | 1/1/2018 | | | | 1/1/2017 | | | | 1/1/2016 | | | | 1/1/2015 | |
| | | to | | | | to | | | | to | | | | to | | | | to | |
| | | 12/31/2019 | | | | 12/31/2018 | | | | 12/31/2017 | | | | 12/31/2016 | | | | 12/31/2015 | |
| Net Asset Value - | | | | | | | | | | | | | | | | | | | |
| Beginning of Period | $ | 30.01 | | | $ | 30.87 | | | $ | 26.12 | | | $ | 23.98 | | | $ | 25.72 | |
| Net Investment Income (Loss)(a) | | (0.08 | ) | | | (0.14 | ) | | | (0.14 | ) | | | (0.11 | ) | | | (0.01 | ) |
| Net Gain (Loss) on Investments | | | | | | | | | | | | | | | | | | | |
| (Realized and Unrealized) | | 10.70 | | | | (0.46 | ) | | | 4.89 | | | | 2.68 | | | | (1.69 | ) |
| Total from Investment Operations | | 10.62 | | | | (0.60 | ) | | | 4.75 | | | | 2.57 | | | | (1.70 | ) |
| |
| Distributions (From Net Investment Income) | | - | | | | - | | | | - | | | | - | | | | - | |
| Distributions (From Realized Capital Gains) | | - | | | | (0.26 | ) | | | - | | | | (0.43 | ) | | | (0.04 | ) |
| Total Distributions | | - | | | | (0.26 | ) | | | - | | | | (0.43 | ) | | | (0.04 | ) |
| |
| Net Asset Value - | | | | | | | | | | | | | | | | | | | |
| End of Period | $ | 40.63 | | | $ | 30.01 | | | $ | 30.87 | | | $ | 26.12 | | | $ | 23.98 | |
| Total Return(b) | | 35.39% | | | | (1.94)% | | | | 18.19% | | | | 10.68% | | | | (6.59)% | |
| Ratios/Supplemental Data | | | | | | | | | | | | | | | | | | | |
| Net Assets - End of Period (Thousands) | $ | 42,052 | | | $ | 28,017 | | | $ | 30,716 | | | $ | 24,657 | | | $ | 20,531 | |
| Ratio of Expenses to Average Net Assets | | 1.50% | | | | 1.50% | | | | 1.50% | | | | 1.50% | | | | 1.50% | |
| Ratio of Net Investment Income (Loss) to | | | | | | | | | | | | | | | | | | | |
| Average Net Assets | | -0.23% | | | | -0.45% | | | | -0.53% | | | | -0.47% | | | | -0.05% | |
| Portfolio Turnover Rate | | 0.00% | | | | 11.40% | | | | 10.81% | | | | 16.27% | | | | 26.81% | |
(a) Per share amounts were calculated using the average shares method.
(b) Total return represents the rate that the investor would have earned or lost on an in the Fund assuming reinvestment of dividends and distributions.
The accompanying notes are an integral part of these financial statements.
10
Notes to Financial Statements
Bretton Fund
December 31, 2019
1.) ORGANIZATION
Bretton Fund (the “Fund”) was organized as a non-diversified series of the PFS Funds (the “Trust”) on September 21, 2010. The Trust was established under the laws of Massachusetts by an Agreement and Declaration of Trust dated January 13, 2000, which was amended and restated January 20, 2011. The Trust is registered as an open-end investment company under the Investment Company Act of 1940, as amended. The Trust may offer an unlimited number of shares of beneficial interest in a number of separate series, each series representing a distinct fund with its own investment objectives and policies. As of December 31, 2019, there were nine series authorized by the Trust. The Fund commenced operations on September 30, 2010. The Fund’s investment objective is to seek long-term capital appreciation. The investment adviser to the Fund is Bretton Capital Management, LLC (the “Adviser”).
2.) SIGNIFICANT ACCOUNTING POLICIES
The Fund is an investment company and accordingly follows the investment company accounting and reporting guidance of the Financial Accounting Standards Board (“FASB”) Accounting Standards Codification Topic 946Financial Services - Investment Companies. The financial statements are prepared in conformity with accounting principles generally accepted in the United States of America (“GAAP”). The Fund follows the significant accounting policies described in this section.
SECURITY VALUATION:
All investments in securities are recorded at their estimated fair value, as described in Note 3.
SHARE VALUATION:
The net asset value (the “NAV”) is generally calculated as of the close of trading on the New York Stock Exchange (the “Exchange”) (normally 4:00 p.m. Eastern time) every day the Exchange is open. The NAV is calculated by taking the total value of the Fund’s assets, subtracting its liabilities, and then dividing by the total number of shares outstanding, rounded to the nearest cent. The offering price and redemption price per share are equal to the net asset value per share.
FEDERAL INCOME TAXES:
The Fund’s policy is to continue to comply with the requirements of the Internal Revenue Code that are applicable to regulated investment companies and to distribute all of its taxable income to shareholders. Therefore, no federal income tax provision is required. It is the Fund’s policy to distribute annually, prior to the end of the calendar year, dividends sufficient to satisfy excise tax requirements of the Internal Revenue Code. This Internal Revenue Code requirement may cause an excess of distributions over the book year-end accumulated income. In addition, it is the Fund’s policy to distribute annually, after the end of the fiscal year, any remaining net investment income and net realized capital gains.
The Fund recognizes the tax benefits of certain tax positions only where the position is “more likely than not” to be sustained assuming examination by tax authorities. Management has analyzed the Fund’s tax positions, and has concluded that no liability for unrecognized tax benefits should be recorded related to uncertain tax positions taken on returns filed for open tax years. The Fund identifies its major tax jurisdictions as U.S. Federal tax authorities; however, the Fund is not aware of any tax positions for which it is reasonably possible that the total amounts of unrecognized tax benefits will change materially in the next 12 months. The Fund recognizes interest and penalties, if any, related to unrecognized tax benefits as income tax expense in the Statement of Operations. During the fiscal year ended December 31, 2019, the Fund did not incur any interest or penalties.
DISTRIBUTIONS TO SHAREHOLDERS:
Distributions to shareholders, which are determined in accordance with income tax regulations, are recorded on the ex-dividend date.
The treatment for financial reporting purposes of distributions made to shareholders during the period from net investment income or net realized capital gains may differ from their ultimate treatment for federal income tax purposes. These differences are caused primarily by differences
11
Notes to Financial Statements - continued
in the timing of the recognition of certain components of income, expense, or realized capital gain for federal income tax purposes. Where such differences are permanent in nature, they are reclassified in the components of the net assets based on their ultimate characterization for federal income tax purposes. Any such reclassifications will have no effect on net assets, results of operations, or net asset value per share of the Fund. As of December 31, 2019, total distributable earnings was increased by $82,155 and paid in capital was decreased by $82,155. The adjustment was primarily related to the reclassification of net investment loss.
USE OF ESTIMATES:
The financial statements are prepared in accordance with GAAP, which requires management to make estimates and assumptions that affect the reported amounts of assets and liabilities and disclosure of contingent assets and liabilities at the date of the financial statements and the reported amounts of increases and decreases in net assets from operations during the reporting period. Actual results could differ from those estimates.
EXPENSES:
Expenses incurred by the Trust that do not relate to a specific fund of the Trust are allocated to the individual funds based on each fund’s relative net assets or another appropriate basis.
CASH:
The Fund maintains cash at its custodian which, at times, may exceed United States federally insured limits.
OTHER:
The Fund records security transactions based on the trade date. Dividend income is recognized on the ex-dividend date. Interest income, if any, is recognized on an accrual basis. The Fund uses the specific identification method in computing gain or loss on sales of investment securities. Withholding taxes on foreign dividends have been provided for in accordance with the Fund’s understanding of the applicable country’s tax rules and rates.
3.) SECURITIES VALUATIONS
As described in Note 2, the Fund utilizes various methods to measure the fair value of most of its investments on a recurring basis. GAAP establishes a hierarchy that prioritizes inputs to valuation methods. The three levels of inputs are:
Level 1 - Unadjusted quoted prices in active markets for identical assets or liabilities that the Fund has the ability to access.
Level 2 - Observable inputs other than quoted prices included in level 1 that are observable for the asset or liability, either directly or indirectly. These inputs may include quoted prices for the identical instrument in an inactive market, prices for similar instruments, interest rates, prepayment speeds, credit risk, yield curves, default rates, and similar data.
Level 3 - Unobservable inputs for the asset or liability, to the extent relevant observable inputs are not available, representing the Fund’s own assumptions about the assumptions a market participant would use in valuing the asset or liability, and would be based on the best information available.
The availability of observable inputs can vary from security to security and is affected by a wide variety of factors, including, for example, the type of security, whether the security is new and not yet established in the marketplace, the liquidity of markets, and other characteristics particular to the security. To the extent that valuation is based on models or inputs that are less observable or unobservable in the market, the determination of fair value requires more judgment. Accordingly, the degree of judgment exercised in determining fair value is greatest for instruments categorized in level 3.
The inputs used to measure fair value may fall into different levels of the fair value hierarchy. In such cases, for disclosure purposes, the level in the fair value hierarchy within which the fair value measurement falls in its entirety, is determined based on the lowest level input that is significant to the fair value measurement in its entirety.
FAIR VALUE MEASUREMENTS
A description of the valuation techniques applied to the Fund’s major categories of assets and liabilities measured at fair value on a recurring basis follows.
12
Notes to Financial Statements - continued
Equity securities (common stocks). Equity securities generally are valued by using market quotations, but may be valued on the basis of prices furnished by a pricing service when the Adviser believes such prices accurately reflect the fair value of such securities. Securities that are traded on any stock exchange or on the NASDAQ over-the-counter market are generally valued by the pricing service at the last quoted sale price. Lacking a last sale price, an equity security is generally valued by the pricing service at its last bid price. Generally, if the security is traded in an active market and is valued at the last sale price, the security is categorized as a level 1 security, and if an equity security is valued by the pricing service at its last bid, it is generally categorized as a level 2 security. When market quotations are not readily available, when the Adviser determines that the market quotation or the price provided by the pricing service does not accurately reflect the current fair value, or when restricted securities are being valued, such securities are valued as determined in good faith by the Adviser, subject to review of the Board of Trustees (the “Trustees” or the “Board”) and are categorized in level 2 or level 3, when appropriate.
In accordance with the Trust’s good faith pricing guidelines, the Adviser is required to consider all appropriate factors relevant to the value of securities for which it has determined other pricing sources are not available or reliable as described above. There is no single standard for determining fair value controls, since fair value depends upon the circumstances of each individual case. As a general principle, the current fair value of an issue of securities being valued by the Adviser would appear to be the amount which the owner might reasonably expect to receive for them upon their current sale. Methods which are in accordance with this principle may, for example, be based on (i) a multiple of earnings; (ii) a discount from market of a similar freely traded security (including a derivative security or a basket of securities traded on other markets, exchanges or among dealers); or (iii) yield to maturity with respect to debt issues, or a combination of these and other methods.
The following table summarizes the inputs used to value the Fund’s assets measured at fair value as of December 31, 2019:
| Valuation Inputs of Assets | | Level 1 | | Level 2 | | Level 3 | | Total |
| Common Stocks | | $41,832,652 | | $0 | | $0 | | $41,832,652 |
The Fund did not hold any Level 3 assets during the fiscal year ended December 31, 2019.
The Fund did not invest in derivative instruments during the fiscal year ended December 31, 2019.
4.) INVESTMENT ADVISORY AGREEMENT AND RELATED PARTY TRANSACTIONS
The Fund has entered into an investment advisory agreement (“Management Agreement”) with the Adviser. The Adviser manages the investment portfolio of the Fund, subject to policies adopted by the Trust’s Board of Trustees, and, at its own expense and without reimbursement from the Fund, furnishes office space and all necessary office facilities, equipment, and executive personnel necessary for managing the Fund. The Adviser pays the expenses of the Fund except for the management fee, all brokerage fees and commissions, taxes, borrowing costs (such as (a) interest and (b) dividend expenses on securities sold short), ADR fees, fees and expenses of acquired funds, extraordinary or non-recurring expenses as may arise, including litigation to which the Fund may be a party and indemnification of the Trust’s Trustees and officers with respect thereto. For its services during the fiscal year, the Adviser received a management fee equal to 1.50% of the average daily net assets of the Fund. Effective January 1, 2020, the Adviser receivesa management fee equal to 1.35% of the average daily net assets of the Fund.
For the fiscal year ended December 31, 2019, the Adviser earned management fees totaling $544,512, of which $52,977 was due to the Adviser at December 31, 2019.
5.) RELATED PARTY TRANSACTIONS
Mr. Jeffrey R. Provence of Premier Fund Solutions, Inc. (the “Administrator”) also serves as trustee/officer of the Fund. This individual receives benefits from the Administrator resulting from administration fees paid to the Administrator of the Fund by the Adviser.
The Trustees who are not interested persons of the Fund were each paid $1,500, for a total of $4,500, in Trustees’ fees for their services to the Fund for the fiscal year ended December 31, 2019. These fees were paid by the Adviser.
13
Notes to Financial Statements - continued
6.) PURCHASES AND SALES OF SECURITIES
For the fiscal year ended December 31, 2019, purchases and sales of investment securities other than U.S. Government obligations and short-term investments aggregated $3,323,488 and $0, respectively. Purchases and sales of U.S. Government obligations aggregated $0 and $0, respectively.
7.) CONTROL OWNERSHIP
The beneficial ownership, either directly or indirectly, of more than 25% of the voting shares of a fund creates a presumption of control of the fund, under Section 2(a)(9) of the Investment Company Act of 1940. As of December 31, 2019, YDB LLC, beneficially held, in aggregate, approximately 32.34% of the Fund and Thao Dodson, held, in aggregate, approximately 35.57% of the Fund and therefore, each may be deemed to control the Fund.
8.) TAX MATTERS
For Federal income tax purposes, the cost of investments owned at December 31, 2019, was $23,350,050. At December 31, 2019, the composition of unrealized appreciation (the excess of value over tax cost) and depreciation (the excess of tax cost over value) was as follows:
| | Appreciation | | (Depreciation) | | Net Appreciation (Depreciation) |
| | $18,515,138 | | ($32,536) | | $18,482,602 |
The tax character of distributions was as follows:
| | | 2019 | | | 2018 | |
| Ordinary Income. | | $ -0- | | | $ -0- | |
| Long-Term Capital Gain | | -0- | | | 240,110 | |
| | | $ -0- | | | $ 240,110 | |
As of December 31, 2019, the components of distributable earnings (accumulated losses) on a tax basis were as follows:
| Unrealized appreciation (depreciation) | | $18,482,602 |
| Total distributable earnings | | $18,482,602 |
As of December 31, 2019, there are no differences between book basis and tax basis unrealized appreciation.
9.) SUBSEQUENT EVENTS
Effective January 1, 2020 the management fees for the Fund have been reduced from 1.50% to 1.35% . Subsequent events after the date of the Statement of Assets and Liabilities have been evaluated through the date the financial statements were issued. Other than the subsequent reduction of the management fees described in this note, management has concluded that there is no impact requiring adjustment to or disclosure in the financial statements.
14
REPORT OF INDEPENDENT REGISTERED PUBLIC ACCOUNTING FIRM
To the Shareholders of Bretton Fund and
Board of Trustees of PFS Funds
Opinion on the Financial Statements
We have audited the accompanying statement of assets and liabilities, including the schedule of investments, of Bretton Fund (the “Fund”), a series of PFS Funds, as of December 31, 2019, the related statement of operations for the year then ended, the statements of changes in net assets for each of the two years in the period then ended, including the related notes, and the financial highlights for each of the five years in the period then ended (collectively referred to as the “financial statements”). In our opinion, the financial statements present fairly, in all material respects, the financial position of the Fund as of December 31, 2019, the results of its operations for the year then ended, the changes in its net assets for each of the two years in the period then ended, and the financial highlights for each of the five years in the period then ended, in conformity with accounting principles generally accepted in the United States of America.
Basis for Opinion
These financial statements are the responsibility of the Fund’s management. Our responsibility is to express an opinion on the Fund’s financial statements based on our audits. We are a public accounting firm registered with the Public Company Accounting Oversight Board (United States) (“PCAOB”) and are required to be independent with respect to the Fund in accordance with the U.S. federal securities laws and the applicable rules and regulations of the Securities and Exchange Commission and the PCAOB.
We conducted our audits in accordance with the standards of the PCAOB. Those standards require that we plan and perform the audit to obtain reasonable assurance about whether the financial statements are free of material misstatement whether due to error or fraud.
Our audits included performing procedures to assess the risks of material misstatement of the financial statements, whether due to error or fraud, and performing procedures that respond to those risks. Such procedures included examining, on a test basis, evidence regarding the amounts and disclosures in the financial statements. Our procedures included confirmation of securities owned as of December 31, 2019, by correspondence with the custodian. Our audits also included evaluating the accounting principles used and significant estimates made by management, as well as evaluating the overall presentation of the financial statements. We believe that our audits provide a reasonable basis for our opinion.
We have served as the Fund’s auditor since 2010.

COHEN & COMPANY, LTD.
Cleveland, Ohio
February 14, 2020
15
Additional Information
December 31, 2019
(Unaudited) |
1.) AVAILABILITY OF QUARTERLY SCHEDULE OF INVESTMENTS
The Fund files its complete schedule of portfolio holdings with the Securities and Exchange Commission (“SEC”) for the first and third quarters of each fiscal year on Form N-Q. The Fund’s Form N-Q is available on the SEC’s website at http://www.sec.gov.
2.) PROXY VOTING GUIDELINES
Bretton Capital Management, LLC, the Fund’s investment adviser (“Adviser”), is responsible for exercising the voting rights associated with the securities held by the Fund. A description of the policies and procedures used by the Adviser in fulfilling this responsibility is availablewithout charge on the Fund’s website at www.brettonfund.com. It is also included in the Fund’s Statement of Additional Information, which is available on the SEC’s website at http://www.sec.gov.
Information regarding how the Fund voted proxies, Form N-PX, relating to portfolio securities during the most recent 12-month period ended June 30, is available without charge, upon request, by calling our toll free number (800.231.2901) . This information is also available on the SEC’s website at http://www.sec.gov.
3.) DISCLOSURE OF EXPENSES
As a shareholder of the Fund, you incur ongoing expenses consisting solely of management fees. You will be assessed fees for outgoing wire transfers, returned checks and stop payment orders at prevailing rates charged by Mutual Shareholder Services, LLC, the Fund’s transfer agent, and IRA accounts will be charged an $8.00 annual maintenance fee. This Example is intended to help you understand your ongoing costs (in dollars) of investing in the Fund and to compare these costs with the ongoing costs of investing in other mutual funds.
The Example is based on an investment of $1,000 invested in the Fund on July 1, 2019, and held through December 31, 2019.
Actual Expenses
The first line of the table below provides information about actual account values and actual expenses. You may use the information in this line, together with the amount you invested, to estimate the expenses that you paid over the period. Simply divide your account value by $1,000 (for example, an $8,600 account value divided by $1,000 = 8.6), then multiply the result by the number in the first line under the heading entitled “Expenses Paid During Period” to estimate the expenses you paid on your account during this period.
Hypothetical Example for Comparison Purposes
The second line of the table below provides information about hypothetical account values and hypothetical expenses based on the Fund’s actual expense ratio and an assumed rate of return of 5% per year before expenses, which is not the Fund’s actual return. The hypothetical account values and expenses may not be used to estimate the actual ending account balance or expenses you paid for the period. You may use this information to compare the ongoing costs of investing in this Fund and other funds. To do so, compare this 5% hypothetical example with the 5% hypothetical examples that appear in the shareholder reports of the other funds.
Please note that the expenses shown in the table are meant to highlight your ongoing costs only and do not reflect any transactional costs, such as sales charges (loads) or the charges assessed by Mutual Shareholder Services, LLC as described above. Therefore, the second line of the table is useful in comparing ongoing costs only, and will not help you determine the relative cost of owning different funds. In addition, if these transactional costs were included, your cost could have been higher.
16
| Additional Information (Unaudited) - continued | | |
| |
| | | | | | | Expenses Paid |
| | | Beginning | | Ending | | During the Period* |
| | | Account Value | | Account Value | | July 1, 2019 to |
| | | July 1, 2019 | | December 31, 2019 | | December 31, 2019 |
| |
| Actual | | $1,000.00 | $ | 1,125.17 | $ | 8.03 |
| |
| Hypothetical | | $1,000.00 | $ | 1,017.64 | $ | 7.63 |
| (5% annual return | | | | | | |
| before expenses) | | | | | | |
| * | Expenses are equal to the Fund’s annualized expense ratio of 1.50%, multiplied by the average account value over the period, multiplied by 184/365 (to reflect the one-half year period ended December 31, 2019). |
| |
17
Trustees and Officers
(Unaudited) |
The Board of Trustees supervises the business activities of the Trust. The names of the Trustees and executive officers of the Trust are shown below. For more information regarding the Trustees, please refer to the Statement of Additional Information, which is available upon request by calling 800.231.2901. Each Trustee serves until the Trustee sooner dies, resigns, retires, or is removed.
The Trustees and Officers of the Trust and their principal business activities during the past five years are:
Interested Trustees and Officers
| | | | | Number of | |
| | | | Principal | Portfolios In | Other |
| Name, | Position(s) | Term of Office | Occupation(s) | Fund | Directorships |
| Address(1), | Held With | and Length of | During | Complex | Held By |
| and Year of Birth | the Trust | Time Served | Past 5 Years | Overseen By | Trustee |
| | | | | Trustee | |
| |
| Ross C. Provence, | President | Indefinite Term; | General Partner and Portfolio | N/A | N/A |
| Year of Birth: 1938 | | Since 2000 | Manager for Value Trend Capital | | |
| | | | Management, LP (1995 to current). | | |
| | | | Estate planning attorney (1963 to | | |
| current). |
| |
| Jeffrey R. Provence(2), | Trustee, | Indefinite Term; | CEO, Premier Fund Solutions, Inc. | 9 | Blue Chip |
| Year of Birth: 1969 | Secretary | Since 2000 | (2001 to current). General Partner | | Investor Funds, |
| | and | | and Portfolio Manager for Value | | Meeder Funds |
| | Treasurer | | Trend Capital Management, LP | | |
| | | | (1995 to current). | | |
| |
| Julian G. Winters, | Chief | Indefinite Term; | Managing Member, Watermark | N/A | N/A |
| Year of Birth: 1968 | Compliance | Since 2010 | Solutions LLC (investment compli- | | |
| | Officer | | ance and consulting) (2007 to cur- | | |
| rent). |
(1)The address of each trustee and officer is c/o PFS Funds, 1939 Friendship Drive, Suite C, El Cajon, California 92020.
(2)Jeffrey R. Provence is considered an "interested person" as defined in Section 2(a)(19) of the Investment Company Act of 1940 by virtue of his position with the Trust.
| | | | | Number of | |
| | | | Principal | Portfolios In | Other |
| Name, | Position | Term of Office | Occupation(s) | Fund | Directorships |
| Address(1), | Held With | and Length of | During | Complex | Held By |
| and Year of Birth | the Trust | Time Served | Past 5 Years | Overseen By | Trustee |
| | | | | Trustee | |
| |
| Thomas H. Addis III, | Independent | Indefinite Term; | Executive Director/CEO, Southern | 9 | None |
| Year of Birth: 1945 | Trustee | Since 2000 | California PGA (2006 to current). | | |
| |
| Allen C. Brown, | Independent | Indefinite Term; | Law Office of Allen C. Brown, | 9 | Blue Chip |
| Year of Birth: 1943 | Trustee | Since 2010 | estate planning and business attor- | | Investor Funds |
| | | | ney (1970 to current). | | |
| |
| George Cossolias, CPA, | Independent | Indefinite Term; | Partner of CWDL, CPAs (February 1, | 9 | Blue Chip |
| Year of Birth: 1935 | Trustee | Since 2000 | 2014 to current). Owner of George | | Investor Funds, |
| | | | Cossolias & Company, CPAs (1972 | | Neiman Funds |
| | | | to January 31, 2014). President of | | |
| | | | LubricationSpecialists, Inc. (1996 to | | |
| current). |
(1)The address of each trustee and officer is c/o PFS Funds, 1939 Friendship Drive, Suite C, El Cajon, California 92020.
18

Investment Adviser
Bretton Capital Management, LLC
Legal Counsel
Practus, LLP
Custodian
US Bank, N.A.
Dividend Paying Agent,
Shareholders’ Servicing Agent,
Transfer Agent
Mutual Shareholder Services, LLC
Fund Administrator
Premier Fund Solutions, Inc.
Independent Registered Public Accounting Firm
Cohen & Company, Ltd.
Distributor
Rafferty Capital Markets, LLC |
This report is provided for the general information of the shareholders of the Bretton
Fund. This report is not intended for distribution to prospective investors in the Fund,
unless preceded or accompanied by an effective prospectus. |
Item 2. Code of Ethics.
The registrant has adopted a code of ethics that applies to the registrant’s principal executive officer and the principal financial officer. The registrant has not made any amendments to its code of ethics during the covered period. The registrant has not granted any waivers from any provisions of the code of ethics during the covered period. A copy of the registrant’s Code of Ethics is filed herewith.
Item 3. Audit Committee Financial Expert.
The registrant’s Board of Trustees has determined that George Cossolias is an audit committee finical expert. Mr. Cossolias is independent for purposes of this Item 3.
Item 4. Principal Accountant Fees and Services.
(a-d) The following table details the aggregate fees billed for each of the last two fiscal years for audit fees, audit-related fees, tax fees and other fees by the principal accountant to the registrant. The principal accountant has provided no services to the adviser or any entity controlled by, or under common control with the adviser that provides ongoing services to the registrant.
| | | FYE 12/31/19 | | FYE 12/31/18 |
| Audit Fees | | $13,750 | | $13,250 |
| Audit-Related Fees | | $0 | | $0 |
| Tax Fees | | $3,000 | | $3,000 |
| All Other Fees | | $750 | | $750 |
Nature of Tax Fees: preparation of Excise Tax Statement and 1120 RIC.
All Other Fees: Semi-Annual Report Review
(e) (1) The audit committee approves all audit and non-audit related services and, therefore, has not adopted pre-approval policies and procedures described in paragraph (c)(7) of Rule 2-01 of Regulation S-X.
(e) (2) None of the services described in paragraph (b) through (d) of this Item were approved by the audit committee pursuant to paragraph (c)(7)(i)(C) of Rule 2-01 of Regulation S-X.
(f) All of the principal accountant’s hours spent on auditing the registrant’s financial statements were attributed to work performed by full-time permanent employees of the principal accountant.
(g) The following table indicates the aggregate non-audit fees billed by the registrant’s principal accountant for services to the registrant , the registrant’s investment adviser (not sub-adviser), and any entity controlling, controlled by, or under common control with the adviser that provides ongoing services to the registrant, for the last two years.
| Non-Audit Fees | | FYE 12/31/19 | | FYE 12/31/18 |
| Registrant | | $3,750 | | $3,750 |
| Registrant’s Investment Adviser | | $0 | | $0 |
(h) The principal accountant provided no services to the investment adviser or any entity controlling, controlled by, or under common control with the adviser that provides ongoing services to the registrant.
Item 5. Audit Committee of Listed Companies.Not applicable.
Item 6. Investments.
(a) Not applicable. Schedule filed with Item 1.
(b) Not applicable.
Item 7. Disclosure of Proxy Voting Policies and Procedures for Closed-End Management Investment Companies.Not applicable.
Item 8. Portfolio Managers of Closed End Management Investment Companies.Not applicable.
Item 9. Purchases of Equity Securities by Closed-End Management Investment Companies and Affiliated Purchasers.Not applicable.
Item 10. Submission of Matters to a Vote of Security Holders.
The registrant has not adopted procedures by which shareholders may recommend nominees to the registrant’s board of trustees.
Item 11. Controls and Procedures.
(a) The Registrant’s president and chief financial officer concluded that the disclosure controls and procedures (as defined in Rule 30a-3(c) under the Act (17 CFR 270.30a -3(c))) as of a date within 90 days of the filing date of the report that includes the disclosure required by this paragraph, based on the evaluation of these controls and procedures required by Rule 30a-3(b) under the Act (17 CFR 270.30a -3(b)) and Rules 13a-15(b) or 15d-15(b) under the Exchange Act (17 CFR 240.13a -15(b) or 240.15d -15(b)).
(b) There were no changes in the registrant’s internal control over financial reporting (as defined in Rule 30a-3(d) under the Act (17 CFR 270.30a -3(d)) that occurred during the period covered by this report that has materially affected, or is reasonably likely to materially affect, the registrant’s internal control over financial reporting.
Item 12. Disclosure of Securities Lending Activities for Closed-End Management Investment Companies.
Not applicable.
Item 13. Exhibits.
(a)(1) Code of Ethics. Filed herewith.
(a)(2) Certifications pursuant to Section 302 of the Sarbanes-Oxley Act of 2002.Filed herewith.
(a)(3)Not applicable.
(a)(4) Not applicable.
(b)Certification pursuant to Section 906 of the Sarbanes-Oxley Act of 2002.Filed herewith.
Pursuant to the requirements of the Securities Exchange Act of 1934 and the Investment Company Act of 1940, the registrant has duly caused this report to be signed on its behalf by the undersigned, thereunto duly authorized.
| | By:/s/Ross C. Provence
Ross C. Provence
President |
Pursuant to the requirements of the Securities Exchange Act of 1934 and the Investment Company Act of 1940, this report has been signed below by the following persons on behalf of the registrant and in the capacities and on the dates indicated.
| | By:/s/Ross C. Provence
Ross C. Provence
President |
| | By:/s/Jeffrey R. Provence
Jeffrey R. Provence
Chief Financial Officer |