UNITED STATES
SECURITIES AND EXCHANGE COMMISSION
WASHINGTON, D.C. 20549
CERTIFIED SHAREHOLDER REPORT OF REGISTERED MANAGEMENT INVESTMENT COMPANIES
Investment Company Act file number 811-09781
PFS Funds
(Exact name of registrant as specified in charter)
1939 Friendship Drive, Suite C, El Cajon, CA 92020
(Address of principal executive offices) (Zip code)
CT Corporation System
155 Federal St., Suite 700, Boston, MA 02110
(Name and address of agent for service) |
Registrant’s telephone number, including area code: (619) 588-9700
Date of fiscal year end: June 30
Date of reporting period: June 30, 2022
Item 1. Report to Stockholders.
Conquer Risk Funds
Conquer Risk Defensive Bull Fund
Ticker CRDBX
Conquer Risk Managed Volatility Fund
Ticker CRMVX
Conquer Risk Tactical Opportunities Fund
Ticker CRTOX
Conquer Risk Tactical Rotation Fund
Ticker CRTBX
ANNUAL REPORT
June 30, 2022 |
| Table of Contents | |
| |
| |
| |
| CONQUER RISK FUNDS | |
| Shareholder Report | 2 |
| Sector Allocation | 5 |
| Performance Information | 7 |
| Schedules of Investments | 11 |
| Statements of Assets and Liabilities | 15 |
| Statements of Operations | 15 |
| Statements of Changes in Net Assets | 17 |
| Financial Highlights | 19 |
| NOTES TO FINANCIAL STATEMENTS | 23 |
| REPORT OF INDEPENDENT REGISTERED PUBLIC ACCOUNTING FIRM | 29 |
| DISCLOSURE OF EXPENSES | 30 |
| ADDITIONAL INFORMATION | 32 |
| TRUSTEES & OFFICERS | 36 |
2022 Annual Report 1
Shareholder Report
June 30, 2022 |
Potomac Fund Management
The third quarter of calendar year 2021 saw a continuation of the choppy trading that has been on display for most of the first half of the 2022 calendar year. However, this choppiness may not be evident if one were to simply look at the S&P 500® Index. As the Large Cap index continued to move higher, the median stock was not following suit. This could be seen in the performance of the Value Line Geometric Index, which was flat during the quarter.
Also, under the surface of the market, rotation remained a key theme. This rotation was driven by the inflation narrative. Investors grappled with a key question: “will inflation be transitory?” Trends in the market during the early part of the quarter pointed to investors taking the side of the “transitory narrative. This led to a reversal of the bullish trend in the Energy sector and a continuation of strength in the Technology space.
Additionally, Treasury prices moved higher, sending the yield in the opposite direction in the opening weeks of the third quarter. As the yield fell, there was a rotation back into the long-duration sectors of the equity market, such as Technology, Communication Services, and parts of the Consumer Discretionary sector. At the same time, the groups that saw the biggest benefit from the prospect of higher rates caused by inflation, Materials, Industrials, and Energy, came under pressure.
Sticking with the theme of calendar year 2021, rotation made another appearance as September began. The S&P 500 quickly recorded a 5% decline. The catalyst for the decline was the fact that investors once again changed their tune on inflation, concluding that it may not be transitory. In turn, the 10-Year Yield rallied above 1.5% as the quarter ended. As yields moved higher, investors rotated back into the cyclical parts of the equity market and into commodities.
For the S&P 500® Index, the September swoon found a bottom in the early days of the fourth quarter of calendar year 2021. Buying the dip was once again rewarded at the index level as the S&P 500 closed the year near record levels despite choppy trading in late November and early December.
However, the market continued to be turbulent under the surface. Once again, the main driver of the turbulence was inflation and, in turn, interest rates. The Federal Reserve began to send a clear message that interest rates were going to move higher in calendar year 2022. The 10-Year Yield began to move higher as the quarter ended, threatening to move above the 2021 peak near 1.8% .
As this view began to crystalize for investors, there was an underly bid to the cyclical sectors of the equity market. Groups such as Energy, Materials, and Industrials rebounded from the lows that were seen in early October to close the year near record levels.
Additionally, as rates moved higher, so did commodities, as there tends to be a positive correlation between the two asset classes. The Bloomberg Commodity Index rebounded from a November selloff to close the year just shy of record levels.
While it might not be easy to remember now, the first quarter of calendar year 2022 looked promising in its early days. After closing 2021 near record levels, the S&P 500® Index traded higher to open the year. The index set a record on January 4th. However, the new year celebration in the stock market proved to be short-lived, and the index went on to see a nearly 15% decline before staging a rebound throughout most of March.
2022 Annual Report 2
Russia’s invasion of Ukraine was cited as a catalyst for declines in the equity markets along with strength in the commodities, especially those related to Energy and Agriculture. However, bullish trends were already on display across the commodity complex for more than a year before the invasion. Interestingly, using the invasion as the catalyst to finally shift into commodities and the equity leveraged to them would prove to be a late reaction as many are now trading at the same levels as they were prior to the catalyst.
However, the equity market has been sending a message of “risk-off,” confirmed by key Intermarket relationships that we track across equities, fixed income, and commodities. While investors are not in the mood to take on risk, readers might expect to see the treasury market act as a port in the storm. However, no such port was to be found in the first half of the year. The closely watched 10-Year Note remained under intense pressure, pushing toward as 3.20% before abating somewhat.
At the same time, the difference between the 10-Year rate and the 2-Year rate continues to collapse, sending a message of an economic slowdown. Despite this clear message, the Federal Reserve is seemingly intent on raising interest rates until inflation, which is near 40-year highs, is under control.
Moving into the second quarter of calendar year 2022, it was more of the same. In this case, the same as what was witnessed during the first quarter of the year. When combined, the first and second quarters of 2022 registered one of the worst first-half performances on record.
Unfortunately for balanced investors, there was also more of the same in the treasury market. The 10-Year Note continued to trend to the downside, pushing the rate higher. In early June, the Note undercut the 2018 lows before staging a mild rebound.
As pressure intensified across asset markets, investors were reminded that noting is immune in a bear market. The once-hot commodity complex began to come under pressure as it became clearer that the Federal Reserve would continue to hike despite the further message of a global economic slowdown. In fact, despite inflation reaching levels not seen since the early 1980s, the only haven was the U.S. Dollar, which saw outsized strength relative to the Euro and the Japanese Yen.
Our approach remains systematic and does not aim to predict what trends will unfold next.
Fund Performance (Fiscal Year Ending June 30, 2022):
Conquer Risk Defensive Bull Fund
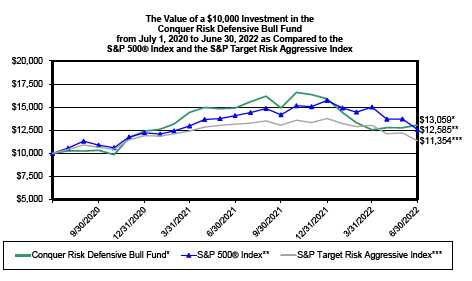
For the fiscal year ended June 30, 2022, the Conquer Risk Defensive Bull Fund returned -12.38% . The Fund’s primary benchmark index, the S&P 500® Index, returned -10.62% in the same period. Performance relative to the benchmark was hindered by leveraged long positions in the ETFs that track the S&P 500, with the underperformance taking place in the first half of the calendar year 2022. The S&P 500 exited calendar year 2021 near record levels, supported by positive breadth dynamics. This tilted our systematic strategy to long positions, which was employed with leverage from products such as the Direxion Daily S&P 500 Bull 3x ETF (SPXL) and the ProShares UltraPro S&P500 (UPRO).
Conquer Risk Tactical Opportunities Fund
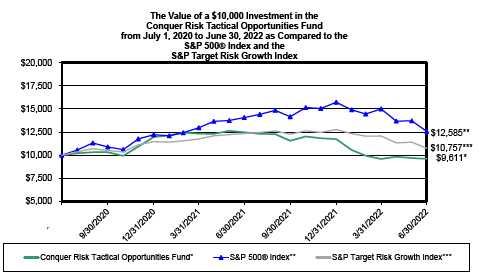
For the fiscal year ended June 30, 2022, the Conquer Risk Tactical Opportunities Fund returned -23.00%, while its primary benchmark index, the S&P 500® Index, returned -10.62% in the same period. The Tactical Opportunities Fund seeks granular exposure to specific themes and trends that are playing out in asset markets. Performance relative to the benchmark was hindered by constant rotation under the surface of the equity market during the back half of calendar year 2021. A rotation away from commodity-levered equity funds, such as the Global X Uranium ETF (URA), the VanEck Vectors Oil Services ETF (OIH), and the
2022 Annual Report 3
SPDR S&P Metals & Mining ETF (XME), functioned as a performance drag during second half of calendar year 2021. During the same time, exposure to broad market index ETFs such as the Invesco QQQ Trust (QQQ) and the iShare Core S&P 500 ETF (IVV) helped performance. During the 1HCY2022, these dynamics were flipped. Leveraged long exposure via the ProShares UltraPro QQQ (TQQQ) acted as a drag. This drag was offset by exposures identified by our momentum strategy, in particular commodity exposure via the Invesco Optimum Yield Diversified Commodity Strategy No K-1 ETF (PDBC).
Conquer Risk Tactical Rotation Fund
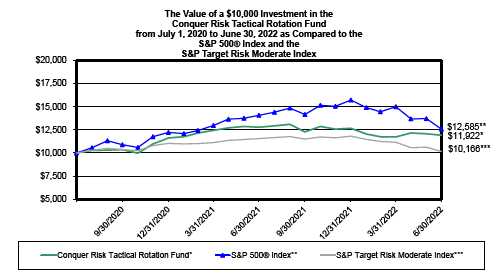
For the fiscal year ended June 30, 2022, the Conquer Risk Tactical Rotation Fund returned -6.74%, while its primary benchmark index, the S&P 500® Index, returned -10.62% in the same period. The Tactical Rotation Fund seeks to identify broad-based trends and themes across asset markets. Performance was helped by exposure to broad equity indexes via ETFs, such as the Invesco S&P 500 Equal Weight ETF (RSP), and the Invesco QQQ Trust (QQQ), during the second half of calendar year 2021. As 2022 began, the broad indexes began to selloff, and performance was hindered by exposure to the S&P 500, as well as by exposure to the Vanguard Real Estate Index Fund (VNQ) and the iShares MSCI Quality Factor ETF (QUAL). This drag was offset by trends that were identified by our momentum strategy, such as the iShares U.S. Medical Devices ETF (IHI), the VanEck Vectors Gold Miners ETF (GDX), and the Utilities Select Sector SPDR Fund ETF (XLU).
Conquer Risk Managed Volatility Fund
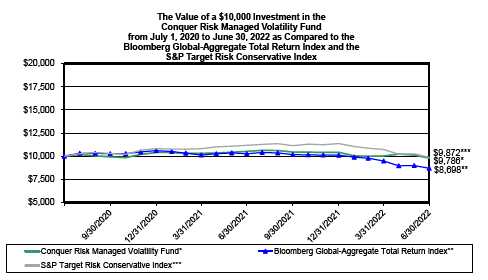
For the fiscal year ended June 30, 2022, the Conquer Risk Managed Volatility Fund returned -7.15%, while its primary benchmark index, the Bloomberg Global Aggregate Total Return Index, returned -15.25% . Performance was helped by exposures that moved inverse to the treasury bond prices such as the Simplify Interest Rate Hedge ETF (PFIX) and the Direxion Daily 20-Year Treasury Bear 3X (TMV). Additionally, exposure to managed futures via the IMGP DBI Managed Futures Strategy ETF (DBMF) added to the performance. Performance was hindered by long positions in the Fidelity Capital & Income Fund (FAGIX), the TCW Emerging Markets Income Fund (TGEIX), and the SPDR Bloomberg High Yield Bond ETF (JNK).
Past performance does not guarantee future results. The investment return and principal value of an investment in the Funds will fluctuate so that an investor’s shares, when redeemed, may be worth more or less than their original cost. Current performance may be higher or lower than the performance data quoted. Performance data current to the most recent month end are available by calling 1-888-774-6679.
The Conquer Risk Funds’ prospectus contains important information about the Funds’ investment objectives, potential risks, management fees, charges and expenses, and other information and should be read and considered carefully before investing. You may obtain a current copy of the Funds’ prospectus by calling 1-888-774-6679. Distributed by Arbor Court Capital, LLC.
2022 Annual Report 4
Conquer Risk Funds (Unaudited)
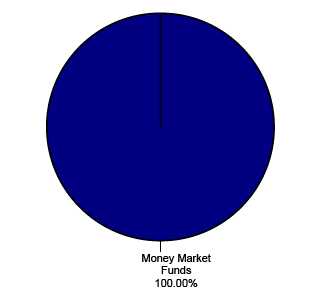
CONQUER RISK DEFENSIVE BULL FUND
Sector Allocation as of June 30, 2022
(As a Percentage of Total Investments Held)
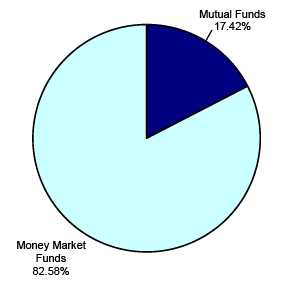
CONQUER RISK MANAGED VOLATILITY FUND
Sector Allocation as of June 30, 2022
(As a Percentage of Total Investments Held)
2022 Annual Report 5
Conquer Risk Funds (Unaudited)
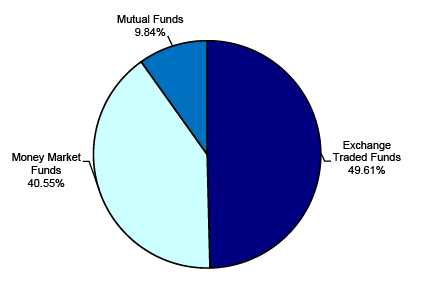
CONQUER RISK TACTICAL OPPORTUNITIES FUND
Sector Allocation as of June 30, 2022
(As a Percentage of Total Investments Held)
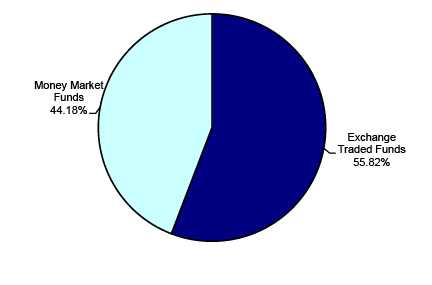
CONQUER RISK TACTICAL ROTATION FUND
Sector Allocation as of June 30, 2022
(As a Percentage of Total Investments Held)
2022 Annual Report 6
Conquer Risk Defensive Bull Fund (Unaudited)
PERFORMANCE INFORMATION
RETURNS AS OF JUNE 30, 2022
June 30, 2022 NAV $10.28
| | | | Since | |
| | 1 Year(A) | | Inception(A) | |
| Conquer Risk Defensive Bull Fund | -12.38% | | 14.27% | |
| S&P 500® Index (B) | -10.62% | | 12.19% | |
| S&P Target Risk Aggressive Index (C) | -13.67% | | 6.56% | |
Annual Fund Operating Expense Ratio (from 11/1/2021 Prospectus): 1.67%
The Fund’s expense ratio for the fiscal year ended June 30, 2022, can be found in the financial highlights included within this report. The Annual Fund Operating Expense Ratio reported above may not correlate to the expense ratio in the Fund’s financial highlights because (a) the financial highlights include only the direct operating expenses incurred by the Fund, not the indirect costs of investing in acquired funds, and (b) the application of breakpoints and waivers as described in Note 4.
(A) 1 Year and Since Inception returns include change in share prices and in each case includes reinvestment of any dividends and capital gain distributions. The Conquer Risk Defensive Bull Fund commenced operations on July 1, 2020.
(B) The S&P 500® Index is a widely recognized unmanaged index of equity prices and is representative of a broader market and range of securities than is found in the Fund’s portfolio. The Index is an unmanaged benchmark that assumes reinvestment of all distributions and excludes the effect of taxes and fees. Individuals cannot invest directly in this Index; however, an individual can invest in exchange traded funds or other investment vehicles that attempt to track the performance of a benchmark index.
(C) The S&P Target Risk Aggressive Index is designed to measure the performance of aggressive stock-bond allocations to equities, seeking to maximize opportunities for long-term capital accumulation. It may include small allocations to fixed income to enhance portfolio efficiency. The index is made up of 80% equities and 20% fixed income.
PAST PERFORMANCE DOES NOT GUARANTEE FUTURE RESULTS. INVESTMENT RETURN AND PRINCIPAL VALUE WILL FLUCTUATE SO THAT SHARES, WHEN REDEEMED, MAY BE WORTH MORE OR LESS THAN THEIR ORIGINAL COST. RETURNS DO NOT REFLECT THE DEDUCTION OF TAXES THAT A SHAREHOLDER WOULD PAY ON FUND DISTRIBUTIONS OR THE REDEMPTION OF FUND SHARES. CURRENT PERFORMANCE MAY BE LOWER OR HIGHER THAN THE PERFORMANCE DATA QUOTED. TO OBTAIN PERFORMANCE DATA CURRENT TO THE MOST RECENT MONTH END, PLEASE CALL 1-888-774-6679. AN INVESTMENT IN THE FUND IS SUBJECT TO INVESTMENT RISKS, INCLUDING THE POSSIBLE LOSS OF THE PRINCIPAL AMOUNT INVESTED. THE FUND'S DISTRIBUTOR IS ARBOR COURT CAPITAL, LLC.
2022 Annual Report 7
Conquer Risk Managed Volatility Fund (Unaudited)
PERFORMANCE INFORMATION
RETURNS AS OF JUNE 30, 2022
June 30, 2022 NAV $9.48
| | | | Since | |
| | 1 Year(A) | | Inception(A) | |
| Conquer Risk Managed Volatility Fund | -7.15% | | -1.08% | |
| Bloomberg Global-Aggregate Total Return Index (B) | -15.25% | | -6.74% | |
| S&P Target Risk Conservative Index (C) | -13.67% | | -0.64% | |
Annual Fund Operating Expense Ratio (from 11/1/2021 Prospectus): Gross - 2.03%; Net - 1.93%
The Fund’s expense ratio for the fiscal year ended June 30, 2022, can be found in the financial highlights included within this report. The Annual Fund Operating Expense Ratio reported above may not correlate to the expense ratio in the Fund’s financial highlights because (a) the financial highlights include only the direct operating expenses incurred by the Fund, not the indirect costs of investing in acquired funds, and (b) the application of breakpoints and waivers as described in Note 4.
(A) 1 Year and Since Inception returns include change in share prices and in each case includes reinvestment of any dividends and capital gain distributions. The Conquer Risk Managed Volatility Fund commenced operations on July 1, 2020.
(B) The Bloomberg Global-Aggregate Total Return Index measures the performance of global investment grade fixed income securities. The Index is widely used as a benchmark for fixed income securities. Individuals cannot invest directly in this Index.
(C) The S&P Target Risk Conservative Index is designed to measure the performance of conservative stock-bond allocations to fixed income, seeking to produce a current income stream and avoid excessive volatility of returns. Equities are included to protect long-term purchasing power. The index is made up of 70% fixed income and 30% equities.
PAST PERFORMANCE DOES NOT GUARANTEE FUTURE RESULTS. INVESTMENT RETURN AND PRINCIPAL VALUE WILL FLUCTUATE SO THAT SHARES, WHEN REDEEMED, MAY BE WORTH MORE OR LESS THAN THEIR ORIGINAL COST. RETURNS DO NOT REFLECT THE DEDUCTION OF TAXES THAT A SHAREHOLDER WOULD PAY ON FUND DISTRIBUTIONS OR THE REDEMPTION OF FUND SHARES. CURRENT PERFORMANCE MAY BE LOWER OR HIGHER THAN THE PERFORMANCE DATA QUOTED. TO OBTAIN PERFORMANCE DATA CURRENT TO THE MOST RECENT MONTH END, PLEASE CALL 1-888-774-6679. AN INVESTMENT IN THE FUND IS SUBJECT TO INVESTMENT RISKS, INCLUDING THE POSSIBLE LOSS OF THE PRINCIPAL AMOUNT INVESTED. THE FUND'S DISTRIBUTOR IS ARBOR COURT CAPITAL, LLC.
2022 Annual Report 8
Conquer Risk Tactical Opportunities Fund (Unaudited)
PERFORMANCE INFORMATION RETURNS AS OF JUNE 30, 2022 June 30, 2022 NAV $8.11
| | | | Since | |
| | 1 Year(A) | | Inception(A) | |
| Conquer Risk Tactical Opportunities Fund | -23.00% | | -1.96% | |
| S&P 500® Index (B) | -10.62% | | 12.18% | |
| S&P Target Risk Growth Index (C) | -12.83% | | 3.72% | |
Annual Fund Operating Expense Ratio (from 11/1/2021 Prospectus): Gross - 1.99%; Net - 1.98%
The Fund’s expense ratio for the fiscal year ended June 30, 2022, can be found in the financial highlights included within this report. The Annual Fund Operating Expense Ratio reported above may not correlate to the expense ratio in the Fund’s financial highlights because (a) the financial highlights include only the direct operating expenses incurred by the Fund, not the indirect costs of investing in acquired funds, and (b) the application of breakpoints and waivers as described in Note 4.
(A) 1 Year and Since Inception returns include change in share prices and in each case includes reinvestment of any dividends and capital gain distributions. The Conquer Risk Tactical Opportunities Fund commenced operations on July 1, 2020.
(B) The S&P 500® Index is a widely recognized unmanaged index of equity prices and is representative of a broader market and range of securities than is found in the Fund’s portfolio. The Index is an unmanaged benchmark that assumes reinvestment of all distributions and excludes the effect of taxes and fees. Individuals cannot invest directly in this Index; however, an individual can invest in exchange traded funds or other investment vehicles that attempt to track the performance of a benchmark index.
(C) The S&P Target Risk Growth Index is designed to measure the performance of equity allocations, while seeking to provide limited fixed income exposure to diversify risk. The index is made up of 60% equities and 40% fixed income.
PAST PERFORMANCE DOES NOT GUARANTEE FUTURE RESULTS. INVESTMENT RETURN AND PRINCIPAL VALUE WILL FLUCTUATE SO THAT SHARES, WHEN REDEEMED, MAY BE WORTH MORE OR LESS THAN THEIR ORIGINAL COST. RETURNS DO NOT REFLECT THE DEDUCTION OF TAXES THAT A SHAREHOLDER WOULD PAY ON FUND DISTRIBUTIONS OR THE REDEMPTION OF FUND SHARES. CURRENT PERFORMANCE MAY BE LOWER OR HIGHER THAN THE PERFORMANCE DATA QUOTED. TO OBTAIN PERFORMANCE DATA CURRENT TO THE MOST RECENT MONTH END, PLEASE CALL 1-888-774-6679. AN INVESTMENT IN THE FUND IS SUBJECT TO INVESTMENT RISKS, INCLUDING THE POSSIBLE LOSS OF THE PRINCIPAL AMOUNT INVESTED. THE FUND'S DISTRIBUTOR IS ARBOR COURT CAPITAL, LLC.
2022 Annual Report 9
Conquer Risk Tactical Rotation Fund (Unaudited)
PERFORMANCE INFORMATION RETURNS AS OF JUNE 30, 2022 June 30, 2022 NAV $9.72
| | | | Since | |
| | 1 Year(A) | | Inception(A) | |
| Conquer Risk Tactical Rotation Fund | -6.74% | | 9.19% | |
| S&P 500® Index (B) | -10.62% | | 12.19% | |
| S&P Target Risk Moderate Index (C) | -12.02% | | 0.83% | |
Annual Fund Operating Expense Ratio (from 11/1/2021 Prospectus): Gross - 1.86%; Net - 1.86%
The Fund’s expense ratio for the fiscal year ended June 30, 2022, can be found in the financial highlights included within this report. The Annual Fund Operating Expense Ratio reported above may not correlate to the expense ratio in the Fund’s financial highlights because (a) the financial highlights include only the direct operating expenses incurred by the Fund, not the indirect costs of investing in acquired funds, and (b) the application of breakpoints and waivers as described in Note 4.
(A) 1 Year and Since Inception returns include change in share prices and in each case includes reinvestment of any dividends and capital gain distributions. The Conquer Risk Tactical Rotation Fund commenced operations on July 1, 2020.
(B) The S&P 500® Index is a widely recognized unmanaged index of equity prices and is representative of a broader market and range of securities than is found in the Fund’s portfolio. The Index is an unmanaged benchmark that assumes reinvestment of all distributions and excludes the effect of taxes and fees. Individuals cannot invest directly in this Index; however, an individual can invest in exchange traded funds or other investment vehicles that attempt to track the performance of a benchmark index.
(C) The S&P Target Risk Moderate Index is designed to measure the performance of moderate stock-bond allocations to fixed income while seeking to increase opportunities for higher returns through equities. The index is made up of 60% fixed income and 40% equities.
PAST PERFORMANCE DOES NOT GUARANTEE FUTURE RESULTS. INVESTMENT RETURN AND PRINCIPAL VALUE WILL FLUCTUATE SO THAT SHARES, WHEN REDEEMED, MAY BE WORTH MORE OR LESS THAN THEIR ORIGINAL COST. RETURNS DO NOT REFLECT THE DEDUCTION OF TAXES THAT A SHAREHOLDER WOULD PAY ON FUND DISTRIBUTIONS OR THE REDEMPTION OF FUND SHARES. CURRENT PERFORMANCE MAY BE LOWER OR HIGHER THAN THE PERFORMANCE DATA QUOTED. TO OBTAIN PERFORMANCE DATA CURRENT TO THE MOST RECENT MONTH END, PLEASE CALL 1-888-774-6679. AN INVESTMENT IN THE FUND IS SUBJECT TO INVESTMENT RISKS, INCLUDING THE POSSIBLE LOSS OF THE PRINCIPAL AMOUNT INVESTED. THE FUND'S DISTRIBUTOR IS ARBOR COURT CAPITAL, LLC.
2022 Annual Report 10
| Conquer Risk Defensive Bull Fund |
| |
| | | Schedule of Investments |
| | | | | | June 30, 2022 |
| Shares | | Fair Value | | | % of Net Assets |
| MONEY MARKET FUNDS | | | | | | |
| 235,739,855 First American Government Obligations Fund - Class X 1.29% + * | $ | 235,739,855 | | | 100.20 | % |
| Total for Money Market Funds (Cost $235,739,855) | | | | | | |
| Total Investments (Cost - $235,739,855) | | 235,739,855 | | | 100.20 | % |
| Liabilities in Excess of Other Assets | | (463,648 | ) | | -0.20 | % |
| Net Assets | $ | 235,276,207 | | | 100.00 | % |
| | * Additional Information, including current Prospectus and Annual Reports, is available at
https://www.firstamericanfunds.com/index/FundPerformance/ShareholderDocuments.html.
+ The rate shown represents the 7-day yield at June 30, 2022. |
The accompanying notes are an integral part of these
financial statements. |
2022 Annual Report 11
| Conquer Risk Managed Volatility Fund |
| |
| | | Schedule of Investments |
| | | | | June 30, 2022 |
| Shares | | Fair Value | | % of Net Assets |
| MUTUAL FUNDS | | | | | |
| Systemic Trend | | | | | |
| 322,575 AlphaSimplex Managed Futures Strategy Fund | $ | 4,438,632 | | | |
| 244,105 AQR Managed Futures Strategy Fund Class I | | 2,336,085 | | | |
| Total for Mutual Funds (Cost - $6,263,747) | | 6,774,717 | | 15.87 | % |
| MONEY MARKET FUNDS | | | | | |
| 32,118,093 First American Government Obligations Fund - Class X 1.29% + * | | 32,118,093 | | 75.23 | % |
| Total for Money Market Funds (Cost $32,118,093) | | | | | |
| Total Investments (Cost - $38,381,840) | | 38,892,810 | | 91.10 | % |
| Other Assets in Excess of Liabilities | | 3,802,019 | | 8.90 | % |
| Net Assets | $ | 42,694,829 | | 100.00 | % |
| | * Additional Information, including current Prospectus and Annual Reports, is available at
https://www.firstamericanfunds.com/index/FundPerformance/ShareholderDocuments.html.
+ The rate shown represents the 7-day yield at June 30, 2022. |
The accompanying notes are an integral part of these
financial statements. |
2022 Annual Report 12
| Conquer Risk Tactical Opportunities Fund |
| |
| | | | Schedule of Investments |
| | | | | | | June 30, 2022 |
| Shares | | | Fair Value | | | % of Net Assets |
| |
| EXCHANGE TRADED FUNDS | | | | | | | |
| Equity | | | | | | | |
| 25,122 Invesco QQQ TrustSM, Series 1 ETF | $ | 7,041,194 | | | | |
| 78,285 iShares Global Infrastructure ETF | | | 3,659,824 | | | | |
| 37,393 iShares U.S. Aerospace & Defense ETF | | | 3,708,264 | | | | |
| 110,097 KraneShares CSI China Internet ETF | | | 3,606,778 | | | | |
| Total for Exchange Traded Funds (Cost - $18,410,363) | | | 18,016,060 | | | 49.68 | % |
| MUTUAL FUNDS | | | | | | | |
| Systemic Trend | | | | | | | |
| 393,322 AQR Managed Futures Strategy HV Fund Class I | | | 3,575,294 | | | 9.86 | % |
| Total for Mutual Funds (Cost - $3,744,422) | | | | | | | |
| MONEY MARKET FUNDS | | | | | | | |
| 14,727,515 First American Government Obligations Fund - Class X 1.29% + * | | | 14,727,515 | | | 40.61 | % |
| Total for Money Market Funds (Cost $14,727,515) | | | | | | | |
| |
| Total Investments (Cost - $36,882,300) | | | 36,318,869 | | | 100.15 | % |
| Liabilities in Excess of Other Assets | | | (54,661 | ) | | -0.15 | % |
| Net Assets | $ | 36,264,208 | | | 100.00 | % |
| | * Additional Information, including current Prospectus and Annual Reports, is available at
https://www.firstamericanfunds.com/index/FundPerformance/ShareholderDocuments.html.
+ The rate shown represents the 7-day yield at June 30, 2022. |
The accompanying notes are an integral part of these
financial statements. |
2022 Annual Report 13
| Conquer Risk Tactical Rotation Fund | |
| |
| | | Schedule of Investments |
| | | | | June 30, 2022 |
| Shares | | Fair Value | | % of Net Assets |
| EXCHANGE TRADED FUNDS | | | | | |
| Equity | | | | | |
| 47,519 Invesco S&P 500® Equal Weight ETF | $ | 6,378,475 | | | |
| 192,818 iShares China Large-Cap ETF | | 6,538,459 | | | |
| 90,285 The Consumer Staples Select Sector SPDR® Fund | | 6,516,771 | | | |
| 50,519 The Health Care Select Sector SPDR® Fund | | 6,478,557 | | | |
| 94,401 The Utilities Select Sector SPDR® Fund | | 6,620,342 | | | |
| Total for Exchange Traded Funds (Cost - $32,823,356) | | 32,532,604 | | 50.09 | % |
| MONEY MARKET FUNDS | | | | | |
| 25,750,451 First American Government Obligations Fund - Class X 1.29% + * | | 25,750,451 | | 39.65 | % |
| Total for Money Market Funds (Cost $25,750,451) | | | | | |
| Total Investments (Cost - $58,573,807) | | 58,283,055 | | 89.74 | % |
| Other Assets in Excess of Liabilities | | 6,665,022 | | 10.26 | % |
| Net Assets | $ | 64,948,077 | | 100.00 | % |
| | * Additional Information, including current Prospectus and Annual Reports, is available at
https://www.firstamericanfunds.com/index/FundPerformance/ShareholderDocuments.html.
+ The rate shown represents the 7-day yield at June 30, 2022. |
The accompanying notes are an integral part of these
financial statements. |
2022 Annual Report 14
| Conquer Risk Funds |
| | |
| Statements of Assets and Liabilities | | Defensive | | | | Managed | | |
| June 30, 2022 | | Bull Fund | | | | Volatility Fund | | |
| | |
| Assets: | | | | | | | | |
| Investment Securities at Fair Value* | $ | 235,739,855 | | | $ | 38,892,810 | | |
| Receivable for Fund Shares Sold | | 211,338 | | | | 39,355 | | |
| Receivable for Securities Sold | | - | | | | 3,837,323 | | |
| Dividends Receivable | | 98,559 | | | | 52,484 | | |
| Total Assets | | 236,049,752 | | | | 42,821,972 | | |
| Liabilities: | | | | | | | | |
| Payable for Fund Shares Redeemed | | 532,189 | | | | 68,831 | | |
| Management Fees Payable | | 207,974 | | | | 44,955 | | |
| Service Fees Payable | | 33,382 | | | | 13,357 | | |
| Total Liabilities | | 773,545 | | | | 127,143 | | |
| Net Assets | $ | 235,276,207 | | | $ | 42,694,829 | | |
| Net Assets Consist of: | | | | | | | | |
| Paid In Capital | $ | 284,472,851 | | | $ | 46,200,647 | | |
| Accumulated Deficit | | (49,196,644 | ) | | | (3,505,818 | ) | |
| Net Assets | $ | 235,276,207 | | | $ | 42,694,829 | | |
| | |
| Net Asset Value, Offering Price and Redemption Price per Share | $ | 10.28 | | | $ | 9.48 | | |
| | |
| * Investments at Identified Cost | $ | 235,739,855 | | | $ | 38,381,840 | | |
| | |
| Shares Outstanding (Unlimited number of shares | | 22,888,457 | | | | 4,504,737 | | |
| authorized without par value) | | | | | | | | |
| | |
| Statements of Operations | | | | | | | | |
| For the fiscal year ended June 30, 2022 | | | | | | | | |
| | |
| Investment Income: | | | | | | | | |
| Dividends | $ | 1,697,769 | | | $ | 1,009,091 | | |
| Total Investment Income | | 1,697,769 | | | | 1,009,091 | | |
| Expenses: | | | | | | | | |
| Management Fees | | 2,791,462 | | | | 579,813 | | |
| Service Fees | | 569,524 | | | | 190,293 | | |
| Total Expenses | | 3,360,986 | | | | 770,106 | | |
| Less: Voluntary Expenses Waived | | (124,110 | ) | | | (20,860 | ) | |
| Net Expenses | | 3,236,876 | | | | 749,246 | | |
| | |
| Net Investment Income (Loss) | | (1,539,107 | ) | | | 259,845 | | |
| | |
| Realized and Unrealized Gain (Loss) on Investments: | | | | | | | | |
| Capital Gain Distributions from Investment Companies | | - | | | | 563,817 | | |
| Net Realized Loss on Investments | | (34,548,986 | ) | | | (4,475,069 | ) | |
| Net Change in Net Unrealized Appreciation (Depreciation) on Investments | | (516,028 | ) | | | 29,747 | | |
| Net Realized and Unrealized Loss on Investments | | (35,065,014 | ) | | | (3,881,505 | ) | |
| | |
| Net Decrease in Net Assets from Operations | $ | (36,604,121 | ) | | $ | (3,621,660 | ) | |
The accompanying notes are an integral part of these
financial statements. |
2022 Annual Report 15
| Conquer Risk Funds |
| | |
| Statements of Assets and Liabilities | | Tactical | | | | Tactical | | |
| June 30, 2022 | | Opportunities | | | | Rotation | | |
| | | Fund | | | | Fund | | |
| | |
| Assets: | | | | | | | | |
| Investment Securities at Fair Value* | $ | 36,318,869 | | | $ | 58,283,055 | | |
| Receivable for Fund Shares Sold | | 21,117 | | | | 182,642 | | |
| Receivable for Securities Sold | | - | | | | 6,640,978 | | |
| Dividends Receivable | | 38,485 | | | | 25,896 | | |
| Total Assets | | 36,378,471 | | | | 65,132,571 | | |
| Liabilities: | | | | | | | | |
| Payable for Fund Shares Redeemed | | 63,893 | | | | 99,605 | | |
| Management Fees Payable | | 38,160 | | | | 67,866 | | |
| Service Fees Payable | | 12,210 | | | | 17,023 | | |
| Total Liabilities | | 114,263 | | | | 184,494 | | |
| Net Assets | $ | 36,264,208 | | | $ | 64,948,077 | | |
| Net Assets Consist of: | | | | | | | | |
| Paid In Capital | $ | 47,493,455 | | | $ | 70,512,499 | | |
| Accumulated Deficit | | (11,229,247 | ) | | | (5,564,422 | ) | |
| Net Assets | $ | 36,264,208 | | | $ | 64,948,077 | | |
| | |
| Net Asset Value, Offering Price and Redemption Price per Share | $ | 8.11 | | | $ | 9.72 | | |
| | |
| * Investments at Identified Cost | $ | 36,882,300 | | | $ | 58,573,807 | | |
| | |
| Shares Outstanding (Unlimited number of shares | | 4,471,547 | | | | 6,683,201 | | |
| authorized without par value) | | | | | | | | |
| | |
| Statements of Operations | | | | | | | | |
| For the fiscal year ended June 30, 2022 | | | | | | | | |
| | |
| Investment Income: | | | | | | | | |
| Dividends | $ | 266,710 | | | $ | 484,690 | | |
| Total Investment Income | | 266,710 | | | | 484,690 | | |
| Expenses: | | | | | | | | |
| Management Fees | | 524,294 | | | | 730,356 | | |
| Service Fees | | 180,948 | | | | 217,832 | | |
| Total Expenses | | 705,242 | | | | 948,188 | | |
| Less: Voluntary Expenses Waived | | (20,221 | ) | | | (23,794 | ) | |
| Less: Contractual Expenses Waived | | (60 | ) | | | - | | |
| Net Expenses | | 684,961 | | | | 924,394 | | |
| | |
| Net Investment Loss | | (418,251 | ) | | | (439,704 | ) | |
| | |
| Realized and Unrealized Loss on Investments: | | | | | | | | |
| Net Realized Loss on Investments | | (10,395,683 | ) | | | (3,717,140 | ) | |
| Net Change in Net Unrealized Appreciation (Depreciation) on Investments | | (569,794 | ) | | | (291,421 | ) | |
| Net Realized and Unrealized Loss on Investments | | (10,965,477 | ) | | | (4,008,561 | ) | |
| | |
| Net Decrease in Net Assets from Operations | $ | (11,383,728 | ) | | $ | (4,448,265 | ) | |
The accompanying notes are an integral part of these
financial statements. |
2022 Annual Report 16
| Conquer Risk Funds |
| | |
| Statements of Changes in Net Assets | | Defensive Bull Fund | | | | Managed Volatility Fund | | |
| | |
| | | 7/1/2021 | | | | 7/1/2020* | | | | 7/1/2021 | | | | 7/1/2020* | | |
| | | to | | | | to | | | | to | | | | to | | |
| | | 6/30/2022 | | | | 6/30/2021 | | | | 6/30/2022 | | | | 6/30/2021 | | |
| From Operations: | | | | | | | | | | | | | | | | |
| Net Investment Income (Loss) | $ | (1,539,107 | ) | | $ | (519,578 | ) | | $ | 259,845 | | | $ | 343,910 | | |
| Capital Gain Distributions from Investment Companies | | - | | | | - | | | | 563,817 | | | | - | | |
| Net Realized Gain (Loss) on Investments | | (34,548,986 | ) | | | 49,831,551 | | | | (4,475,069 | ) | | | 645,062 | | |
| Net Change in Unrealized Appreciation (Depreciation) | | | | | | | | | | | | | | | | |
| on Investments | | (516,028 | ) | | | 516,028 | | | | 29,747 | | | | 481,223 | | |
| Net Increase (Decrease) in Net Assets from Operations | | (36,604,121 | ) | | | 49,828,001 | | | | (3,621,660 | ) | | | 1,470,195 | | |
| From Distributions to Shareholders: | | (60,468,943 | ) | | | (1,951,581 | ) | | | (1,120,510 | ) | | | (233,843 | ) | |
| From Capital Share Transactions: | | | | | | | | | | | | | | | | |
| Proceeds From Sale of Shares | | 134,678,524 | | | | 206,833,494 | | | | 31,798,175 | | | | 47,952,624 | | |
| Shares Issued on Reinvestment of Dividends | | 60,336,125 | | | | 1,951,233 | | | | 1,088,060 | | | | 230,833 | | |
| Cost of Shares Redeemed | | (96,524,792 | ) | | | (22,801,733 | ) | | | (16,441,291 | ) | | | (18,427,754 | ) | |
| Net Increase from Shareholder Activity | | 98,489,857 | | | | 185,982,994 | | | | 16,444,944 | | | | 29,755,703 | | |
| Net Increase in Net Assets | | 1,416,793 | | | | 233,859,414 | | | | 11,702,774 | | | | 30,992,055 | | |
| | |
| Net Assets at Beginning of Period | | 233,859,414 | | | | - | | | | 30,992,055 | | | | - | | |
| | |
| Net Assets at End of Period | $ | 235,276,207 | | | $ | 233,859,414 | | | $ | 42,694,829 | | | $ | 30,992,055 | | |
| | |
| | |
| Share Transactions: | | | | | | | | | | | | | | | | |
| Issued | | 10,156,826 | | | | 17,630,917 | | | | 3,088,939 | | | | 4,747,604 | | |
| Reinvested | | 4,800,010 | | | | 161,392 | | | | 107,729 | | | | 22,411 | | |
| Redeemed | | (8,025,315 | ) | | | (1,835,373 | ) | | | (1,659,561 | ) | | | (1,802,385 | ) | |
| Net Increase in Shares | | 6,931,521 | | | | 15,956,936 | | | | 1,537,107 | | | | 2,967,630 | | |
| Shares Outstanding Beginning of Period | | 15,956,936 | | | | - | | | | 2,967,630 | | | | - | | |
| Shares Outstanding End of Period | | 22,888,457 | | | | 15,956,936 | | | | 4,504,737 | | | | 2,967,630 | | |
* Commencement of Operations.
The accompanying notes are an integral part of these
financial statements. |
2022 Annual Report 17
| Conquer Risk Funds |
| | |
| Statements of Changes in Net Assets | | Tactical Opportunities Fund | | | | Tactical Rotation Fund | | |
| | |
| | | 7/1/2021 | | | | 7/1/2020* | | | | 7/1/2021 | | | | 7/1/2020* | | |
| | | to | | | | to | | | | to | | | | to | | |
| | | 6/30/2022 | | | | 6/30/2021 | | | | 6/30/2022 | | | | 6/30/2021 | | |
| From Operations: | | | | | | | | | | | | | | | | |
| Net Investment Loss | $ | (418,251 | ) | | $ | (348,397 | ) | | $ | (439,704 | ) | | $ | (63,877 | ) | |
| Net Realized Gain (Loss) on Investments | | (10,395,683 | ) | | | 7,270,662 | | | | (3,717,140 | ) | | | 8,524,398 | | |
| Net Change in Unrealized Appreciation (Depreciation) | | | | | | | | | | | | | | | | |
| on Investments | | (569,794 | ) | | | 6,363 | | | | (291,421 | ) | | | 669 | | |
| Net Increase (Decrease) in Net Assets from Operations | | (11,383,728 | ) | | | 6,928,628 | | | | (4,448,265 | ) | | | 8,461,190 | | |
| | |
| From Distributions to Shareholders: | | (5,979,395 | ) | | | (952,505 | ) | | | (8,555,271 | ) | | | (1,022,076 | ) | |
| | |
| From Capital Share Transactions: | | | | | | | | | | | | | | | | |
| Proceeds From Sale of Shares | | 15,909,273 | | | | 56,051,527 | | | | 36,704,021 | | | | 58,806,437 | | |
| Shares Issued on Reinvestment of Dividends | | 5,972,303 | | | | 952,467 | | | | 8,528,067 | | | | 1,021,750 | | |
| Cost of Shares Redeemed | | (11,778,768 | ) | | | (19,455,594 | ) | | | (22,777,746 | ) | | | (11,770,030 | ) | |
| Net Increase from Shareholder Activity | | 10,102,808 | | | | 37,548,400 | | | | 22,454,342 | | | | 48,058,157 | | |
| Net Increase (Decrease) in Net Assets | | (7,260,315 | ) | | | 43,524,523 | | | | 9,450,806 | | | | 55,497,271 | | |
| | |
| Net Assets at Beginning of Period | | 43,524,523 | | | | - | | | | 55,497,271 | | | | - | | |
| | |
| Net Assets at End of Period | $ | 36,264,208 | | | $ | 43,524,523 | | | $ | 64,948,077 | | | $ | 55,497,271 | | |
| | |
| | |
| Share Transactions: | | | | | | | | | | | | | | | | |
| Issued | | 1,550,397 | | | | 5,181,703 | | | | 3,505,021 | | | | 5,420,846 | | |
| Reinvested | | 599,629 | | | | 81,827 | | | | 822,378 | | | | 90,501 | | |
| Redeemed | | (1,268,843 | ) | | | (1,673,166 | ) | | | (2,110,744 | ) | | | (1,044,801 | ) | |
| Net Increase in Shares | | 881,183 | | | | 3,590,364 | | | | 2,216,655 | | | | 4,466,546 | | |
| Shares Outstanding Beginning of Period | | 3,590,364 | | | | - | | | | 4,466,546 | | | | - | | |
| Shares Outstanding End of Period | | 4,471,547 | | | | 3,590,364 | | | | 6,683,201 | | | | 4,466,546 | | |
* Commencement of Operations.
The accompanying notes are an integral part of these
financial statements. |
2022 Annual Report 18
| Conquer Risk Defensive Bull Fund |
| | |
| Financial Highlights | | | | | | | | |
| | |
| Selected data for a share outstanding throughout the period: | | 7/1/2021 | | | | 7/1/2020* | | |
| | | to | | | | to | | |
| | | 6/30/2022 | | | | 6/30/2021 | | |
| Net Asset Value - Beginning of Period | $ | 14.66 | | | $ | 10.00 | | |
| Net Investment Loss (a) (e) | | (0.08 | ) | | | (0.05 | ) | |
| Net Gain (Loss) on Investments (Realized and Unrealized) (b) | | (1.16 | ) | | | 4.91 | | |
| Total from Investment Operations | | (1.24 | ) | | | 4.86 | | |
| Distributions (From Net Investment Income) | | - | | | | - | | |
| Distributions (From Capital Gains) | | (3.14 | ) | | | (0.20 | ) | |
| Total Distributions | | (3.14 | ) | | | (0.20 | ) | |
| Net Asset Value - End of Period | $ | 10.28 | | | $ | 14.66 | | |
| Total Return (c) | | (12.38 | )% | | | 49.04 | % | |
| | |
| Ratios/Supplemental Data | | | | | | | | |
| Net Assets - End of Period (Thousands) | $ | 235,276 | | | $ | 233,859 | | |
| | |
| Before Waiver | | | | | | | | |
| Ratio of Expenses to Average Net Assets (d) | | 1.29 | % | | | 1.55 | % | |
| Ratio of Net Investment Loss to Average Net Assets (d) (e) | | (0.64 | )% | | | (0.41 | )% | |
| After Waiver | | | | | | | | |
| Ratio of Expenses to Average Net Assets (d) | | 1.24 | % | (f) | | 1.53 | % | (f) |
| Ratio of Net Investment Loss to Average Net Assets (d) (e) | | (0.59 | )% | | | (0.39 | )% | |
| | |
| Portfolio Turnover Rate | | 1,558.57 | % | | | 1,657.50 | % | |
| | * Commencement of Operations.
(a) Per share amounts were calculated using the average shares method.
(b) Realized and unrealized gains and losses per share in this caption are balancing amounts necessary
to reconcile the change in net asset value for the period, and may not reconcile with the aggregate gains
and losses in the Statement of Operations due to share transactions for the period.
(c) Total return represents the rate that the investor would have earned or lost on an investment in the
Fund assuming reinvestment of dividends and distributions, if any.
(d) These ratios exclude the impact of expenses of the underlying investment security holdings listed in
the Schedule of Investments.
(e) Recognition of the net investment income/(loss) by the Fund is affected by the timing of the declaration
of dividends by the underlying investment security holdings listed on the Schedule of Investments.
(f) All waivers incurred during the noted period were voluntary. If the voluntary waivers had not occurred,
the expense ratios would have been higher. See Note 4 for additional information on the application of
waivers during the period. |
The accompanying notes are an integral part of these
financial statements. |
2022 Annual Report 19
| Conquer Risk Managed Volatility Fund | |
| | |
| Financial Highlights | | | | | | | | | |
| | |
| Selected data for a share outstanding throughout the period: | | 7/1/2021 | | | | 7/1/2020* | | |
| | | to | | | | to | | |
| | | 6/30/2022 | | | | 6/30/2021 | | |
| Net Asset Value - Beginning of Period | $ | 10.44 | | | $ | 10.00 | | |
| Net Investment Income (a) (e) | | | 0.06 | | | | 0.15 | | |
| Net Gain (Loss) on Investments (Realized and Unrealized) (b) | | | (0.79 | ) | | | 0.39 | | |
| Total from Investment Operations | | | (0.73 | ) | | | 0.54 | | |
| Distributions (From Net Investment Income) | | | (0.10 | ) | | | (0.10 | ) | |
| Distributions (From Capital Gains) | | | (0.13 | ) | | | - | | |
| Total Distributions | | | (0.23 | ) | | | (0.10 | ) | |
| | |
| Net Asset Value - End of Period | $ | 9.48 | | | $ | 10.44 | | |
| Total Return (c) | | | (7.15 | )% | | | 5.39 | % | |
| Ratios/Supplemental Data | | | | | | | | | |
| Net Assets - End of Period (Thousands) | $ | 42,695 | | | $ | 30,992 | | |
| Before Waiver | | | | | | | | | |
| Ratio of Expenses to Average Net Assets (d) | | | 1.66 | % | | | 1.88 | % | |
| Ratio of Net Investment Income to Average Net Assets (d) (e) | | | 0.52 | % | | | 1.43 | % | |
| After Waiver | | | | | | | | | |
| Ratio of Expenses to Average Net Assets (d) | | | 1.62 | % | (f) | | 1.87 | % | (f) |
| Ratio of Net Investment Income to Average Net Assets (d) (e) | | | 0.56 | % | | | 1.44 | % | |
| Portfolio Turnover Rate | | | 620.91 | % | | | 519.72 | % | |
| | * Commencement of Operations.
(a) Per share amounts were calculated using the average shares method.
(b) Realized and unrealized gains and losses per share in this caption are balancing amounts necessary
to reconcile the change in net asset value for the period, and may not reconcile with the aggregate gains
and losses in the Statement of Operations due to share transactions for the period.
(c) Total return represents the rate that the investor would have earned or lost on an investment in the
Fund assuming reinvestment of dividends and distributions, if any.
(d) These ratios exclude the impact of expenses of the underlying investment security holdings listed in
the Schedule of Investments.
(e) Recognition of the net investment income/(loss) by the Fund is affected by the timing of the declara-
tion of dividends by the underlying investment security holdings listed on the Schedule of Investments.
(f) All waivers incurred during the noted period were voluntary. If the voluntary waivers had not occurred,
the expense ratios would have been higher. See Note 4 for additional information on the application of
waivers during the period. |
The accompanying notes are an integral part of these
financial statements. |
2022 Annual Report 20
| Conquer Risk Tactical Opportunities Fund |
| | |
| Financial Highlights | | | | | | | | |
| | |
| Selected data for a share outstanding throughout the period: | | 7/1/2021 | | | | 7/1/2020* | | |
| | | to | | | | to | | |
| | | 6/30/2022 | | | | 6/30/2021 | | |
| Net Asset Value - Beginning of Period | $ | 12.12 | | | $ | 10.00 | | |
| Net Investment Loss (a) (e) | | (0.10 | ) | | | (0.11 | ) | |
| Net Gain (Loss) on Investments (Realized and Unrealized) (b) | | (2.41 | ) | | | 2.58 | | |
| Total from Investment Operations | | (2.51 | ) | | | 2.47 | | |
| Distributions (From Net Investment Income) | | - | | | | - | | |
| Distributions (From Capital Gains) | | (1.50 | ) | | | (0.35 | ) | |
| Total Distributions | | (1.50 | ) | | | (0.35 | ) | |
| Net Asset Value - End of Period | $ | 8.11 | | | $ | 12.12 | | |
| Total Return (c) | | (23.00 | )% | | | 24.81 | % | |
| | |
| Ratios/Supplemental Data | | | | | | | | |
| Net Assets - End of Period (Thousands) | $ | 36,264 | | | $ | 43,525 | | |
| Before Waiver | | | | | | | | |
| Ratio of Expenses to Average Net Assets (d) | | 1.68 | % | | | 1.81 | % | |
| Ratio of Net Investment Loss to Average Net Assets (d) (e) | | (1.05 | )% | | | (0.98 | )% | |
| After Waiver | | | | | | | | |
| Ratio of Expenses to Average Net Assets (d) | | 1.63 | % | (f) | | 1.80 | % | (f) |
| Ratio of Net Investment Loss to Average Net Assets (d) (e) | | (1.00 | )% | | | (0.97 | )% | |
| Portfolio Turnover Rate | | 1,483.56 | % | | | 1,291.12 | % | |
| | * Commencement of Operations.
(a) Per share amounts were calculated using the average shares method.
(b) Realized and unrealized gains and losses per share in this caption are balancing amounts necessary
to reconcile the change in net asset value for the period, and may not reconcile with the aggregate gains
and losses in the Statement of Operations due to share transactions for the period.
(c) Total return represents the rate that the investor would have earned or lost on an investment in the
Fund assuming reinvestment of dividends and distributions, if any.
(d) These ratios exclude the impact of expenses of the underlying investment security holdings listed in
the Schedule of Investments.
(e) Recognition of the net investment income/(loss) by the Fund is affected by the timing of the declara-
tion of dividends by the underlying investment security holdings listed on the Schedule of Investments.
(f) Voluntary expense waivers reduced the gross expense ratio by 0.01% and 0.05%, respectfully, during
the fiscal years ended June 30, 2021 and June 30, 2022, respectfully. If the voluntary waivers had not
occurred, the expense ratios would have been higher. See Note 4 for additional information on the appli-
cation of waivers during the period. |
The accompanying notes are an integral part of these
financial statements. |
2022 Annual Report 21
| Conquer Risk Tactical Rotation Fund |
| | |
| Financial Highlights | | | | | | | | |
| | |
| Selected data for a share outstanding throughout the period: | | 7/1/2021 | | | | 7/1/2020* | | |
| | | to | | | | to | | |
| | | 6/30/2022 | | | | 6/30/2021 | | |
| Net Asset Value - Beginning of Period | $ | 12.43 | | | $ | 10.00 | | |
| Net Investment Loss (a) (e) | | (0.08 | ) | | | (0.02 | ) | |
| Net Gain (Loss) on Investments (Realized and Unrealized) (b) | | (0.63 | ) | | | 2.77 | | |
| Total from Investment Operations | | (0.71 | ) | | | 2.75 | | |
| Distributions (From Net Investment Income) | | - | | | | (0.02 | ) | |
| Distributions (From Capital Gains) | | (2.00 | ) | | | (0.30 | ) | |
| Total Distributions | | (2.00 | ) | | | (0.32 | ) | |
| Net Asset Value - End of Period | $ | 9.72 | | | $ | 12.43 | | |
| Total Return (c) | | (6.74 | )% | | | 27.85 | % | |
| | |
| Ratios/Supplemental Data | | | | | | | | |
| Net Assets - End of Period (Thousands) | $ | 64,948 | | | $ | 55,497 | | |
| Before Waiver | | | | | | | | |
| Ratio of Expenses to Average Net Assets (d) | | 1.62 | % | | | 1.80 | % | |
| Ratio of Net Investment Loss to Average Net Assets (d) (e) | | (0.79 | )% | | | (0.18 | )% | |
| After Waiver | | | | | | | | |
| Ratio of Expenses to Average Net Assets (d) | | 1.58 | % | (f) | | 1.79 | % | (f) |
| Ratio of Net Investment Loss to Average Net Assets (d) (e) | | (0.75 | )% | | | (0.17 | )% | |
| Portfolio Turnover Rate | | 1,544.72 | % | | | 1,028.67 | % | |
| | * Commencement of Operations.
(a) Per share amounts were calculated using the average shares method.
(b) Realized and unrealized gains and losses per share in this caption are balancing amounts necessary
to reconcile the change in net asset value for the period, and may not reconcile with the aggregate gains
and losses in the Statement of Operations due to share transactions for the period.
(c) Total return represents the rate that the investor would have earned or lost on an investment in the
Fund assuming reinvestment of dividends and distributions, if any.
(d) These ratios exclude the impact of expenses of the underlying investment security holdings listed in the
Schedule of Investments.
(e) Recognition of the net investment income/(loss) by the Fund is affected by the timing of the declaration
of dividends by the underlying investment security holdings listed on the Schedule of Investments.
(f) All waivers incurred during the noted period were voluntary. If the voluntary waivers had not occurred,
the expense ratios would have been higher. See Note 4 for additional information on the application of
waivers during the period. |
The accompanying notes are an integral part of these
financial statements. |
2022 Annual Report 22
NOTES TO FINANCIAL STATEMENTS
CONQUER RISK FUNDS
JUNE 30, 2022 |
1.) ORGANIZATION
The Conquer Risk Funds (the “Funds”) are each a series of PFS Funds (the “Trust”). The Trust is an open-end management investment company that was organized in Massachusetts by an Agreement and Declaration of Trust dated January 13, 2000, as amended on January 20, 2011 that offers shares of beneficial interest in a number of separate series, each series representing a distinct fund with its own investment objectives and policies. Conquer Risk Defensive Bull Fund (“Defensive Bull Fund”), Conquer Risk Managed Volatility Fund (“Managed Volatility Fund”), Conquer Risk Tactical Opportunities Fund (“Tactical Opportunities Fund”) and Conquer Risk Tactical Rotation Fund (“Tactical Rotation Fund”) (each a “Fund” and collectively the “Funds”) were each organized as a non-diversified series of the Trust, on June 9, 2020 and commenced operations on July 1, 2020. As of June 30, 2022, there were thirteen series authorized by the Trust. The investment advisor to the Funds is Potomac Fund Management, Inc. (the “Advisor”). Significant accounting policies of the Funds are presented below.
2.) SIGNIFICANT ACCOUNTING POLICIES
The Funds are investment companies and accordingly follow the investment company accounting and reporting guidance of the Financial Accounting Standards Board (“FASB”) Accounting Standards Codification Topic 946 Financial Services - Investment Companies. The financial statements are prepared in conformity with accounting principles generally accepted in the United States of America (“GAAP”). The Funds follow the significant accounting policies described in this section.
SECURITY VALUATION
All investments in securities are recorded at their estimated fair value, as described in Note 3.
SHARE VALUATION
Each Fund’s net asset value (the “NAV”) is generally calculated as of the close of trading on the New York Stock Exchange (the “Exchange”) (normally 4:00 p.m. Eastern time) every day the Exchange is open. The NAV for each Fund is calculated by taking the total value of the Fund’s assets, subtracting its liabilities, and then dividing by the total number of shares outstanding, rounded to the nearest cent. The offering price and redemption price per share is equal to the net asset value per share.
FEDERAL INCOME TAXES
The Funds’ policy is to continue to comply with the requirements of the Internal Revenue Code that are applicable to regulated investment companies and to distribute all of their taxable income to shareholders. Therefore, no federal income tax provision is required. It is the Funds’ policy to distribute annually, prior to the end of the calendar year, dividends sufficient to satisfy excise tax requirements of the Internal Revenue Code. This Internal Revenue Code requirement may cause an excess of distributions over the book year-end accumulated income. In addition, it is the Funds’ policy to distribute annually, after the end of the fiscal year, any remaining net investment income and net realized capital gains.
The Funds recognize the tax benefits of certain tax positions only where the position is “more likely than not” to be sustained assuming examination by tax authorities. Management has analyzed the Funds’ tax positions, and has concluded that no liability for unrecognized tax benefits should be recorded related to uncertain tax positions taken on returns filed for the initial tax period. The Funds identify their major tax jurisdictions as U.S. Federal and State tax authorities; the Funds are not aware of any tax positions for which it is reasonably possible that the total amounts of unrecognized tax benefits will change materially in the next twelve months. The Funds recognize interest and penalties, if any, related to unrecognized tax benefits as income tax expense in the Statements of Operations. During the fiscal year ended June 30, 2022, the Funds did not incur any interest or penalties.
DISTRIBUTIONS TO SHAREHOLDERS
Distributions to shareholders, which are determined in accordance with income tax regulations, are recorded on the ex-dividend date. The Funds may utilize earnings and profits distributed to shareholders on redemptions of shares as part of the dividends paid deduction. The treatment for financial reporting purposes of distributions made to shareholders during the year from net investment income or net realized capital gains may differ from their ultimate treatment for federal income tax purposes. These differences are caused primarily by differences in the timing of recognition of certain components of income, expense or realized capital gain for federal income tax purposes. Where such differences are permanent in nature, they are reclassified in the components of the net assets based on their ultimate characterization for federal income tax purposes. Any such reclassification will have no effect on net assets, results of operations or net asset values per share of any Fund.
2022 Annual Report 23
Notes to Financial Statements - continued
USE OF ESTIMATES
The financial statements are prepared in accordance with GAAP, which requires management to make estimates and assumptions that affect the reported amounts of assets and liabilities and disclosure of contingent assets and liabilities at the date of the financial statements and the reported amounts of increases and decreases in net assets from operations during the reporting period. Actual results could differ from those estimates.
OTHER
The Funds record security transactions based on a trade date. Dividend income is recognized on the ex-dividend date, and interest income, if any, is recognized on an accrual basis. The Funds use the specific identification method in computing gain or loss on the sale of investment securities. Long-term capital gain distributions are recorded as capital gain distributions from investment companies, and short-term capital gain distributions are recorded as dividend income.
EXPENSES
Expenses incurred by the Trust that do not relate to a specific fund of the Trust are allocated to the individual Fund based on each Fund’s relative net assets or by another appropriate method.
3.) SECURITIES VALUATIONS
The Funds utilize various methods to measure the fair value of their investments on a recurring basis. GAAP establishes a hierarchy that prioritizes inputs to valuation methods. The three levels of inputs are:
Level 1 - Unadjusted quoted prices in active markets for identical assets or liabilities that the Funds have the ability to access.
Level 2 - Observable inputs other than quoted prices included in level 1 that are observable for the asset or liability, either directly or indirectly. These inputs may include quoted prices for the identical instrument on an inactive market, prices for similar instruments, interest rates, prepayment speeds, credit risk, yield curves, default rates and similar data.
Level 3 - Unobservable inputs for the asset or liability, to the extent relevant observable inputs are not available, representing the Funds’ own assumptions about the assumptions a market participant would use in valuing the asset or liability, and would be based on the best information available.
The availability of observable inputs can vary from security to security and is affected by a wide variety of factors, including, for example, the type of security, whether the security is new and not yet established in the marketplace, the liquidity of markets, and other characteristics particular to the security. To the extent that valuation is based on models or inputs that are less observable or unobservable in the market, the determination of fair value requires more judgment. Accordingly, the degree of judgment exercised in determining fair value is greatest for instruments categorized in level 3.
The inputs used to measure fair value may fall into different levels of the fair value hierarchy. In such cases, for disclosure purposes, the level in the fair value hierarchy within which the fair value measurement falls in its entirety, is determined based on the lowest level input that is significant to the fair value measurement in its entirety.
FAIR VALUE MEASUREMENTS
A description of the valuation techniques applied to the Funds’ major categories of assets measured at fair value on a recurring basis follows.
Equity securities (exchange traded funds). Equity securities generally are valued by using market quotations, but may be valued on the basis of prices furnished by a pricing service when the Advisor believes such prices accurately reflect the fair value of such securities. Securities that are traded on any stock exchange or on the NASDAQ over-the-counter market are generally valued by the pricing service at the last quoted sale price. Lacking a last sale price, an equity security is generally valued by the pricing service at its last bid price. Generally, if the security is traded in an active market and is valued at the last sale price, the security is categorized as a level 1 security, and if an equity security is valued by the pricing service at its last bid, it is generally categorized as a level 2 security. When market quotations are not readily available, when the Advisor determines that the market quotation or the price provided by the pricing service does not accurately reflect the current fair value, or when restricted securities are being valued, such securities are valued as determined in good faith by the Advisor, subject to review of the Board of Trustees (the “Trustees” or the “Board”) and are categorized in level 2 or level 3, when appropriate.
Money market funds. Money market funds are valued at net asset value provided by the funds and are classified in level 1 of the fair value hierarchy.
2022 Annual Report 24
Notes to Financial Statements - continued
Mutual funds. Mutual funds are valued at the net asset value as reported by the underlying fund and are classified in level 1 of the fair value hierarchy. The underlying mutual funds value securities in their portfolios for which market quotations are readily available at their market values (generally the last reported sale price) and all other securities and assets at their fair value by the methods established by the boards of the underlying funds. In the event a mutual fund does not report its net asset value, the Fund will value such an asset using its fair value procedures which incorporate, among other information, price changes from reference indexes or reference funds to assist in the valuation of a non-reporting mutual fund.
In accordance with the Trust’s good faith pricing guidelines, the Advisor is required to consider all appropriate factors relevant to the value of securities for which it has determined other pricing sources are not available or reliable as described above. There is no single standard for determining fair value, since fair value depends upon the circumstances of each individual case. As a general principle, the current fair value of an issue of securities being valued by the Advisor would appear to be the amount which the owner might reasonably expect to receive for them upon their current sale. Methods which are in accordance with this principle may, for example, be based on (i) a multiple of earnings; (ii) a discount from market of a similar freely traded security (including a derivative security or a basket of securities traded on other markets, exchanges or among dealers); or (iii) yield to maturity with respect to debt issues, or a combination of these and other methods.
The following tables summarize the inputs used to value each Fund’s assets measured at fair value as of June 30, 2022:
| Defensive Bull Fund: | | | | | | |
| Valuation Inputs of Assets | | Level 1 | Level 2 | Level 3 | | Total |
| Money Market Funds | | $235,739,855 | $ – | $ – | | $235,739,855 |
| Total | | $235,739,855 | $ – | $ – | | $235,739,855 |
| |
| Managed Volatility Fund: | | | | | | |
| Valuation Inputs of Assets | | Level 1 | Level 2 | Level 3 | | Total |
| Mutual Funds | | $6,774,717 | $ – | $ – | | $6,774,717 |
| Money Market Funds | | 32,118,093 | – | – | | 32,118,093 |
| Total | | $38,892,810 | $ – | $ – | | $38,892,810 |
| |
| Tactical Opportunities Fund: | | | | | | |
| Valuation Inputs of Assets | | Level 1 | Level 2 | Level 3 | | Total |
| Exchange Traded Funds | | $18,016,060 | $ – | $ – | | $18,016,060 |
| Mutual Funds | | 3,575,294 | – | – | | 3,575,294 |
| Money Market Funds | | 14,727,515 | – | – | | 14,727,515 |
| Total | | $36,318,869 | $ – | $ – | | $36,318,869 |
| |
| Tactical Rotation Fund: | | | | | | |
| Valuation Inputs of Assets | | Level 1 | Level 2 | Level 3 | | Total |
| Exchange Traded Funds | | $32,532,604 | $ – | $ – | | $32,532,604 |
| Money Market Funds | | 25,750,451 | – | – | | 25,750,451 |
| Total | | $58,283,055 | $ – | $ – | | $58,283,055 |
The Funds did not hold any level 3 assets during the fiscal year ended June 30, 2022.
The Funds did not invest in derivative instruments during the fiscal year ended June 30, 2022.
4.) INVESTMENT ADVISORY AGREEMENT AND SERVICES AGREEMENT
The Funds have entered into an investment advisory agreement (“Management Agreement”) with the Advisor. The Advisor manages the investment portfolio of each Fund, subject to the policies adopted by the Trust’s Board of Trustees. Under the Management Agreement, the Advisor, at its own expense and without reimbursement from the Trust, furnishes office space and all necessary office facilities, equipment and executive personnel necessary for managing the assets of each Fund. The Advisor receives an investment management fee equal to 1.25% of each Fund’s average daily net assets up to $100 million, 1.00% of each Fund’s average daily net assets between $100 million and $200 million and 0.90% of each Fund’s average daily net assets in excess of $200 million.
For the fiscal year ended June 30, 2022, the Advisor earned management fees in the amounts of $2,791,462, $579,813, $524,294 and $730,356 for the Defensive Bull Fund, Managed Volatility Fund, Tactical Opportunities Fund and Tactical Rotation Fund, respectively. At June 30, 2022, $207,974, $44,955, $38,160 and $67,866 was due to the Advisor from Defensive Bull Fund, Managed Volatility Fund, Tactical Opportunities Fund and Tactical Rotation Fund, respectively.
2022 Annual Report 25
Notes to Financial Statements - continued
Additionally, the Funds have a Services Agreement with the Advisor (the “Services Agreement”). Effective November 1, 2021, under the Services Agreement the Advisor receives an additional fee of 0.50% of a Fund’s average daily net assets up to $25 million, 0.20% of a Fund’s average daily net assets from $25 million to $100 million, and 0.10% of such assets in excess of $100 million for services provided under the agreement and is also obligated to pay the operating expenses of a Fund excluding management fees, brokerage fees and commissions, 12b-1 fees (if any), taxes, borrowing costs (such as (a) interest and (b) dividend expenses on securities sold short), ADR fees, the cost of acquired funds and extraordinary expenses. Prior to November 1, 2021, under the Services Agreement the Advisor received a service fee of 0.65% of each Fund’s average daily net assets up to $25 million, 0.35% of each Fund’s average daily net assets from $25 million to $100 million, and 0.25% of such assets in excess of $100 million and was obligated to pay the operating expenses of each Fund excluding management fees, brokerage fees and commissions, 12b-1 fees (if any), taxes, borrowing costs (such as (a) interest and (b) dividend expenses on securities sold short), ADR fees, the cost of acquired funds and extraordinary expenses. Additionally, under the Services Agreement the Advisor supervises each Fund’s business affairs. The Advisor coordinates for the provision of the services of a Chief Compliance Officer for the Trust with respect to each Fund, executive and administrative services including, but are not limited to, the coordination of all third parties furnishing services to each Fund, review of the books and records of each Fund maintained by such third parties, and such other actions with respect to each Fund as may be necessary in the opinion of the Advisor to perform its duties under the Services Agreement.
For the fiscal year ended June 30, 2022, the Advisor earned services fees of $569,524, $190,293, $180,948 and $217,832 from Defensive Bull Fund, Managed Volatility Fund, Tactical Opportunities Fund and Tactical Rotation Fund, respectively. At June 30, 2022, $33,382, $13,357, $12,210 and $17,023 was due to the Advisor from Defensive Bull Fund, Managed Volatility Fund, Tactical Opportunities Fund and Tactical Rotation Fund, respectively.
Effective November 1, 2021, the Advisor has contractually agreed to waive a portion of its Service Fee to limit the Service Fee to 0.40% of Managed Volatility Fund's, Tactical Opportunities Fund's and Tactical Rotation Fund's average daily net assets through October 31, 2022. These contractual waivers will automatically terminate on October 31, 2022, unless they are renewed by the Advisor. The Advisor may not terminate the waiver prior to October 31, 2022. The waivers may be terminated by the Board of Trustees. As a result of the daily net asset levels along with the Service Agreement breakpoints reported in paragraph 3 of this note, Managed Volatility Fund, Tactical Opportunities Fund and Tactical Rotation Fund waived $0, $60 and $0, respectively, in contractually waived Service Fees during the period November 1, 2021 through June 30, 2022.
Additionally, from August 1, 2021 through October 31, 2021, the Advisor voluntarily waived Service Agreement fees of 0.15% of each Fund's average daily net assets, and from June 1, 2021, through July 31, 2021, the Advisor voluntarily waived Service Agreement fees of 0.10% of each Fund's average daily net assets. The Service Agreement fee waivers prior to November 1, 2021, were voluntary and were subject to termination at any time. There are no provisions for recoupment for any waivers described in this note. A total of $124,110, $20,860, $20,221 and $23,794 was voluntarily waived from Defensive Bull Fund, Managed Volatility Fund, Tactical Opportunities Fund and Tactical Rotation Fund, respectively.
5.) RELATED PARTY TRANSACTIONS
Jeffrey R. Provence of Premier Fund Solutions, Inc. (the “Administrator”) also serves as a trustee/officer of the Funds. This individual receives benefits from the Administrator resulting from administration fees paid to the Administrator by the Advisor.
The Trustees who are not interested persons of the Funds were paid a total of $15,000 in Trustees fees for the fiscal year ended June 30, 2022, for services to the Trust. Under the Management Agreements, the Advisor pays these fees.
6.) INVESTMENTS
For the fiscal year ended June 30, 2022, purchases and sales of investment securities other than U.S. Government obligations and short-term investments were as follows:
| | | Defensive | | Managed | | Tactical | | Tactical |
| | | Bull Fund | | Volatility Fund | | Opportunities Fund | | Rotation Fund |
| Purchases | | $2,557,383,671 | | $215,423,104 | | $432,456,067 | | $595,720,500 |
| Sales | | $2,754,424,983 | | $234,561,134 | | $424,120,669 | | $597,751,949 |
There were no purchases or sales of U.S. Government obligations.
7.) CONTROL OWNERSHIP
The beneficial ownership, either directly or indirectly, of more than 25% of the voting shares of a fund creates a presumption of control of the fund, under section 2(a)(9) of the Investment Company Act of 1940, as
Notes to Financial Statements - continued
amended. As of June 30, 2022, National Financial Services, LLC (“NFS”), located in New York, New York, and TD Ameritrade, located in Omaha, Nebraska, each held for the benefit of its customers, accounts in excess of 25% of the voting shares of each fund noted below. The Funds do not know whether any underlying accounts of NFS or TD Ameritrade, owned or controlled 25% or more of the voting securities of each Fund.
| | TD Ameritrade | | NFS | |
| Defensive Bull Fund | 28.02% | | 34.74% | |
| Managed Volatility Fund | – ** | | 39.90% | |
| Tactical Opportunities Fund | – ** | | 52.58% | |
| Tactical Rotation Fund | – ** | | 48.76% | |
| |
| ** Balance under 25% as of June 30, 2022. | | | |
8.) TAX MATTERS
For federal income tax purposes, at June 30, 2022 the cost of securities on a tax basis and the composition of gross unrealized appreciation (the excess of value over tax cost) and depreciation (the excess of tax cost over value) were as follows:
| | | Defensive | | | Managed | | Tactical | | | Tactical | |
| | | Bull Fund | | | Volatility Fund | | Opportunities Fund | | | Rotation Fund | |
| Cost of Investments | | $235,739,855 | | $38,381,840 | | $36,882,300 | | | $58,740,367 | |
| |
| Gross Unrealized Appreciation | | $ - | | $510,970 | | $ 19,874 | | | $ 51,118 | |
| Gross Unrealized Depreciation | | - | | - | | (583,305 | ) | | (508,430 | ) |
| Net Unrealized Appreciation | | | | | | | | | | |
| (Depreciation) on Investments | | $ - | | $510,970 | | $(563,431 | ) | | $(457,312 | ) |
The tax character of distributions paid during the fiscal years ended June 30, 2022 and June 30, 2021 were as follows:
| | | Fiscal Year Ended | | Fiscal Year Ended |
| | | June 30, 2022 | | June 30, 2021 |
| Defensive Bull Fund | | | | |
| Ordinary Income | | $60,468,943 | | $1,951,581 |
| Long-term Capital Gain | | - | | - |
| | | $60,468,943 | | $1,951,581 |
| |
| Managed Volatility Fund | | | | |
| Ordinary Income | | $954,660 | | $233,843 |
| Tax-Exempt Income | | 165,850 | | - |
| Long-term Capital Gain | | - | | - |
| | | $1,120,510 | | $233,843 |
| |
| Tactical Opportunities Fund | | | | |
| Ordinary Income | | $5,979,395 | | $952,505 |
| Long-term Capital Gain | | - | | - |
| | | $5,979,395 | | $952,505 |
| |
| Tactical Rotation Fund | | | | |
| Ordinary Income | | $8,555,271 | | $1,022,076 |
| Long-term Capital Gain | | - | | - |
| | | $8,555,271 | | $1,022,076 |
As of June 30, 2022, the components of distributable earnings on a tax basis were as follows:
| | | Defensive Bull Fund | | | Managed Volatility Fund | |
| Undistributed Ordinary Income | | $ 549,018 | | | $ 10,635 | |
| Accumulated Capital and Other Losses | | (49,745,662) | | | (4,027,428) | |
| Unrealized Appreciation (Depreciation) - Net | | - | | | 510,970 | |
| | | $(49,196,644) | | | $(3,505,818) | |
| | | | | | |
|
| | | Tactical Opportunities Fund | | | Tactical Rotation Fund | |
| Undistributed Ordinary Income | | $ - | | | $ 81,288 | |
| Accumulated Capital and Other Losses | | (10,665,816) | | | (5,188,398) | |
| Unrealized Appreciation (Depreciation) - Net | | (563,431) | | | (457,312) | |
| | | $(11,229,247) | | | $(5,564,442) | |
2022 Annual Report 27
Notes to Financial Statements - continued
As of June 30, 2022, the primary differences between book and tax basis unrealized appreciation (depreciation) were attributable to the tax deferral of wash sales.
As of June 30, 2022, accumulated capital and other losses include the following:
| Defensive Bull Fund | | |
| Deferred Late Year Ordinary Losses | | $1,192,455 |
| Post-October Losses | | $48,553,207 |
| |
| Managed Volatility Fund | | |
| Deferred Late Year Ordinary Losses | | $107,075 |
| Post-October Losses | | $3,920,348 |
| |
| Tactical Opportunities Fund | | |
| Deferred Late Year Ordinary Losses | | $260,498 |
| Post-October Losses | | $8,017,738 |
| Short Term Capital Loss Carryforward | | $2,387,580 |
| |
| Tactical Rotation Fund | | |
| Deferred Late Year Ordinary Losses | | $239,042 |
| Post-October Losses | | $4,949,356 |
Under current tax law, late year ordinary losses incurred after December 31 of a fund’s fiscal year may be deferred and treated as occurring on the first business day of the following fiscal year for tax purposes. Additionally, Post-October capital losses incurred after October 31 of a fund’s fiscal year end may be deferred and treated as occurring on the first business day of the following fiscal year for tax purposes.
As of June 30, 2022, Tactical Opportunities Fund recorded reclassifications to increase (decrease) its capital accounts as noted below. The adjustment was primarily related to the reclassification of net operating loss.
| Paid In Capital | | ($157,753 | ) |
| Accumulated Deficit | | $157,753 | |
9.) DEFENSIVE POSITIONS
Each Fund may hold all or a portion of its assets in cash or cash-equivalents like money market funds, certificates of deposit, short-term debt obligations, and repurchase agreements, either due to pending investments or when investment opportunities are limited or market conditions are adverse. Under these circumstances, the Funds may not participate in stock market advances or declines to the same extent they would had they remained more fully invested in common stocks. If a Fund invests in shares of a money market fund, shareholders of the Fund generally will be subject to duplicative management and other fees and expenses. As of June 30, 2022, Defensive Bull Fund, Managed Volatility Fund, Tactical Opportunities Fund and Tactical Rotation Fund had 100.20%, 75.23%, 40.61% and 39.65%, respectively, of the value of their net assets invested in the First American Government Obligations Fund – Class X. Additional information for this money market fund, including its financial statements, is available from the Securities and Exchange Commission’s website at www.sec.gov.
10.) COVID-19 RISKS
Unexpected local, regional or global events, such as war; acts of terrorism; financial, political or social disruptions; natural, environmental or man-made disasters; the spread of infectious illnesses or other public health issues; and recessions and depressions could have a significant impact on each Fund and its investments and may impair market liquidity. Such events can cause investor fear, which can adversely affect the economies of nations, regions and the market in general, in ways that cannot necessarily be foreseen. The impact of COVID-19 has adversely affected, and other infectious illness outbreaks that may arise in the future could adversely affect, the economies of many nations and the entire global economy, individual issuers and capital markets in ways that cannot necessarily be foreseen. Public health crises caused by the COVID-19 outbreak may exacerbate other pre-existing political, social and economic risks in certain countries or globally. The duration of the COVID-19 outbreak and its effects cannot be determined with certainty.
11.) SUBSEQUENT EVENTS
Subsequent events after the date of the Statements of Assets and Liabilities have been evaluated through the date the financial statements were issued. Management has concluded that there is no impact requiring adjustment to or disclosure in the financial statements.
The Trust will hold a special meeting of the shareholders on September 7, 2022 (the “Meeting”), for the purpose of electing certain individuals to the Board of Trustees of the Trust. A proxy statement relating to the Meeting was filed with the Securities and Exchange Commission on July 27, 2022.
2022 Annual Report 28
REPORT OF INDEPENDENT REGISTERED PUBLIC ACCOUNTING FIRM
To the Shareholders of Conquer Risk Funds and
Board of Trustees of PFS Funds
Opinion on the Financial Statements
We have audited the accompanying statements of assets and liabilities, including the schedules of investments, of Conquer Risk Defensive Bull Fund, Conquer Risk Managed Volatility Fund, Conquer Risk Tactical Opportunities Fund, and Conquer Risk Tactical Rotation Fund (the “Funds”), each a series of PFS Funds, as of June 30, 2022, the related statements of operations for the year then ended, the statements of changes in net assets for each of the two periods in the period then ended, the related notes, and the financial highlights for each of the two periods in the period then ended (collectively referred to as the “financial statements”). In our opinion, the financial statements present fairly, in all material respects, the financial position of the each of the Funds as of June 30, 2022, the results of their operations for the year then ended, the changes in net assets for each of the two periods in the period then ended, and the financial highlights for each of the two periods in the period then ended, in conformity with accounting principles generally accepted in the United States of America.
Basis for Opinion
These financial statements are the responsibility of the Funds’ management. Our responsibility is to express an opinion on the Funds’ financial statements based on our audits. We are a public accounting firm registered with the Public Company Accounting Oversight Board (United States) (“PCAOB”) and are required to be independent with respect to the Funds in accordance with the U.S. federal securities laws and the applicable rules and regulations of the Securities and Exchange Commission and the PCAOB.
We conducted our audits in accordance with the standards of the PCAOB. Those standards require that we plan and perform the audit to obtain reasonable assurance about whether the financial statements are free of material misstatement whether due to error or fraud.
Our audits included performing procedures to assess the risks of material misstatement of the financial statements, whether due to error or fraud, and performing procedures that respond to those risks. Such procedures included examining, on a test basis, evidence regarding the amounts and disclosures in the financial statements. Our procedures included confirmation of securities owned as of June 30, 2022, by correspondence with the custodian and brokers. Our audits also included evaluating the accounting principles used and significant estimates made by management, as well as evaluating the overall presentation of the financial statements. We believe that our audits provide a reasonable basis for our opinion.
We have served as the Funds’ auditor since 2020.

COHEN & COMPANY, LTD.
Milwaukee, Wisconsin
August 26, 2022
2022 Annual Report 29
DISCLOSURE OF EXPENSES
(Unaudited) |
The ongoing costs to shareholders associated with the Defensive Bull Fund, Managed Volatility Fund, Tactical Opportunities Fund and Tactical Rotation Fund consist solely of management fees and service fees. Although the Funds charge no sales loads or transaction fees, you will be assessed fees for outgoing wire transfers, returned checks and stop payment orders at prevailing rates charged by Mutual Shareholder Services, LLC, the Funds’ transfer agent. IRA accounts will be charged an $8.00 annual maintenance fee. Additionally, your account will be indirectly subject to the expenses of any underlying funds. The following example is intended to help you understand your ongoing costs of investing in the Funds and to compare these costs with similar costs of investing in other mutual funds. The example is based on an investment of $1,000 invested in the Funds on January 1, 2022, and held through June 30, 2022.
The first line of each table below provides information about actual account values and actual expenses. In order to estimate the expenses a shareholder paid during the period covered by this report, shareholders can divide their account value by $1,000 (for example, an $8,600 account value divided by $1,000 = 8.6) and then multiply the result by the number in the first line under the heading entitled “Expenses Paid During the Period.”
The second line of each table below provides information about hypothetical account values and hypothetical expenses based on the Funds’ actual expense ratios and an assumed rate of return of 5% per year before expenses, which is not the Funds’ actual return. The hypothetical account values and expenses may not be used to estimate the actual ending account balance or expenses paid by a shareholder for the period. Shareholders may use this information to compare the ongoing costs of investing in the Funds and other funds. In order to do so, compare these 5% hypothetical examples with the 5% hypothetical examples that appear in other funds’ shareholder reports.
Please note that the expenses shown in each table are meant to highlight your ongoing costs only and do not reflect expenses of any underlying funds or any transactional costs, such as the annual maintenance fee charged to IRA accounts, or exchange fees. Therefore, the second line of the table is useful in comparing ongoing costs only, and will not help you determine the relative total costs of owning different funds. In addition, if these transactional costs were included, your costs would have been higher.
| DEFENSIVE BULL FUND | | | | | | |
| | | | | | | Expenses Paid |
| | | Beginning | | Ending | | During the Period* |
| | | Account Value | | Account Value | | January 1, 2022 to |
| | | January 1, 2022 | | June 30, 2022 | | June 30, 2022 |
| |
| Actual | | $1,000.00 | | $821.09 | | $5.69 |
| |
| Hypothetical | | $1,000.00 | | $1,018.55 | | $6.31 |
| (5% annual return | | | | | | |
| before expenses) | | | | | | |
* Expenses are equal to the Fund’s annualized expense ratio of 1.26%, multiplied by the average
account value over the period, multiplied by 181/365 (to reflect the one-half year period). |
| MANAGED VOLATILITY FUND | | | | |
| | | | | | | Expenses Paid |
| | | Beginning | | Ending | | During the Period* |
| | | Account Value | | Account Value | | January 1, 2022 to |
| | | January 1, 2022 | | June 30, 2022 | | June 30, 2022 |
| |
| |
| Actual | | $1,000.00 | | $938.61 | | $7.74 |
| |
| Hypothetical | | $1,000.00 | | $1,016.81 | | $8.05 |
| (5% annual return | | | | | | |
| before expenses) | | | | | | |
* Expenses are equal to the Fund’s annualized expense ratio of 1.61%, multiplied by the average
account value over the period, multiplied by 181/365 (to reflect the one-half year period). |
2022 Annual Report 30
| Disclosure of Expenses (Unaudited) - continued | | |
| |
| TACTICAL OPPORTUNITIES FUND | | | | |
| | | | | | | Expenses Paid |
| | | Beginning | | Ending | | During the Period* |
| | | Account Value | | Account Value | | January 1, 2022 to |
| | | January 1, 2022 | | June 30, 2022 | | June 30, 2022 |
| |
| Actual | | $1,000.00 | | $818.37 | | $7.39 |
| |
| Hypothetical | | $1,000.00 | | $1,016.66 | | $8.20 |
| (5% annual return | | | | | | |
| before expenses) | | | | | | |
* Expenses are equal to the Fund’s annualized expense ratio of 1.64%, multiplied by the average
account value over the period, multiplied by 181/365 (to reflect the one-half year period). |
| TACTICAL ROTATION FUND | | | | |
| | | | | | | Expenses Paid |
| | | Beginning | | Ending | | During the Period* |
| | | Account Value | | Account Value | | January 1, 2022 to |
| | | January 1, 2022 | | June 30, 2022 | | June 30, 2022 |
| |
| Actual | | $1,000.00 | | $940.95 | | $7.56 |
| |
| Hypothetical | | $1,000.00 | | $1,017.01 | | $7.85 |
| (5% annual return | | | | | | |
| before expenses) | | | | | | |
* Expenses are equal to the Fund’s annualized expense ratio of 1.57%, multiplied by the average
account value over the period, multiplied by 181/365 (to reflect the one-half year period). |
2022 Annual Report 31
ADDITIONAL INFORMATION
June 30, 2022 |
APPROVAL OF CONTINUATION OF MANAGEMENT AGREEMENT FOR THE CONQUER RISK FUNDS
On June 9, 2022, the Board of Trustees (the “Board” or the “Trustees”) considered the renewal of the Management Agreement between Potomac Fund Management, Inc. (“Potomac”) and the Trust with respect to the Conquer Risk Funds Fund. In approving the continuation of the Management Agreement, the Board of Trustees considered and evaluated the following factors: (i) the nature, extent and quality of the services provided by Potomac to the Conquer Risk Funds; (ii) the investment performance of the Conquer Risk Funds; (iii) the cost of the services to be provided and the profits to be realized by Potomac from the relationship with the Conquer Risk Funds; (iv) the extent to which economies of scale will be realized as the Conquer Risk Funds grow and whether the fee levels reflect these economies of scale to the benefit of shareholders; and (v) Potomac’s practices regarding possible conflicts of interest.
In assessing these factors and reaching its decisions, the Board took into consideration information furnished for the Board’s review and consideration throughout the year at its regular Board meetings, as well as information specifically prepared and/or presented in connection with the annual renewal process. The Board also considered the presentation made by a representative of Potomac at the Meeting. The Board requested and was provided with information and reports relevant to the annual renewal of the Management Agreement, as well as information relevant to their consideration of the Management Agreement including: (i) information regarding the services and support provided to the Conquer Risk Funds and its shareholders by Potomac; (ii) assessments of the investment performance of the Conquer Risk Funds by the portfolio manager from Potomac; (iii) commentary on the reasons for the performance; (iv) presentations addressing Potomac’s investment philosophy, investment strategy, personnel and operations; (v) compliance and audit related information concerning the Conquer Risk Funds and Potomac; (vi) disclosure information contained in the registration statement of the Trust and the Form ADV of Potomac; and (vii) a memorandum from legal counsel that summarized the fiduciary duties and responsibilities of the Board in reviewing and approving the Management Agreement, including the material factors set forth above and the types of information included in each factor that should be considered by the Board in order to make an informed decision. The Board also requested and received various informational materials including, without limitation: (i) documents containing information about Potomac, including financial information, a description of personnel and the services provided to the Conquer Risk Funds, information on investment advice, performance, summaries of Conquer Risk Funds expenses, compliance program, current legal matters, and other general information; (ii) comparative expense and performance information for other mutual funds with strategies similar to the Conquer Risk Funds; (iii) the anticipated effect of size on the Conquer Risk Funds’ performance and expenses; and (iv) benefits to be realized by Potomac from its relationship with the Conquer Risk Funds. The Board did not identify any particular information that was most relevant to its consideration to approve the Management Agreement and each Trustee may have afforded different weight to the various factors.
In deciding whether to approve the continuation of the Management Agreement, the Trustees considered numerous factors, including:
1. The nature, extent, and quality of the services to be provided by Potomac.
In this regard, the Board considered the responsibilities of Potomac under the Management Agreement. The Board reviewed the services provided by Potomac to the Conquer Risk Funds including, without limitation, the procedures for formulating investment recommendations and assuring compliance with the Conquer Risk Funds’ investment objectives and limitations; Potomac’s coordination of services for the Conquer Risk Funds among the service providers; and the efforts of Potomac to promote the Conquer Risk Funds and grow assets. The Board considered: Potomac’s staffing, personnel, and methods of operating; the education and experience of its personnel; and its compliance programs, policies, and procedures. After reviewing the foregoing and further information from Potomac, the Board concluded that the quality, extent, and nature of the services provided by Potomac was satisfactory and adequate for the Conquer Risk Funds.
2. The investment performance of the Conquer Risk Funds and Potomac.
In considering the investment performance of the Conquer Risk Funds and Potomac, the Trustees compared the performance of the Conquer Risk Funds with the performance of funds with similar objectives managed by other investment advisers, as well as with aggregated peer group data. As to the performance of the Conquer Risk Funds, the Trustees compared each Conquer Risk Fund’s performance to its Morningstar category, (each, a “Category”) and to a group of funds of similar size, style and objective, derived from the Category (the “Peer Group”). The performance data from the Category and the Peer
2022 Annual Report 32
Additional Information (Unaudited) - continued
Group covered periods ended April 30, 2022. The Trustees noted that with respect to the Conquer Risk Defensive Bull Fund, for the 1- year period ended April 30, 2022, the Fund had underperformed the average fund in its Category (US Fund Tactical Allocation Funds) and Peer Group, and had underper-formed compared to its benchmark index, the S&P 500. The Trustees noted that with respect to the Conquer Risk Managed Volatility Fund, for the 1- year period ended April 30, 2022, the Fund had outperformed the average fund in its Category (US Fund Multisector Bond Funds) and Peer Group, and had outperformed compared to its benchmark index, the Bloomberg Global Aggregate TR Index. The Trustees noted that with respect to the Conquer Risk Tactical Opportunities Fund, for the 1- year period ended April 30, 2022, the Fund had underperformed the average fund in its Category (US Fund Tactical Allocation Funds) and Peer Group, and had underperformed compared to its benchmark index, the S&P 500. The Trustees noted that with respect to the Conquer Risk Tactical Rotation Fund, for the 1- year period ended April 30, 2022, the Fund had underperformed the average fund in its Category (US Fund Allocation 50% -70% Equity Funds) and Peer Group, and had underperformed compared to its benchmark index, the S&P 500. The Trustees reflected on the management style utilized for the each of the Conquer Risk Funds and the difficult market environment, noting the short operating history of each of the Conquer Risk Funds. They also noted that each of the Conquer Risk Funds performance was within the range of its Category and Peer Group. After reviewing and discussing the investment performance of each of the Conquer Risk Funds further, Potomac’s experience managing the Conquer Risk Funds, and other relevant factors, the Board concluded, in light of all the facts and circumstances, that the investment performance of the Conquer Risk Funds and Potomac was satisfactory.
3. The costs of the services to be provided and the profits to be realized by Potomac from the relationship with the Conquer Risk Funds.
In considering the costs of the services to be provided and profits to be realized by Potomac from the relationship with the Conquer Risk Funds, the Trustees considered: (1) Potomac’s financial condition and the level of commitment to the Conquer Risk Funds and Potomac by the principals of Potomac; (2) the asset level of the Conquer Risk Funds; (3) the overall expenses of the Conquer Risk Funds; and (4) the nature and frequency of advisory fee payments. The Trustees reviewed information provided by Potomac regarding its profits associated with managing the Conquer Risk Funds. The Trustees also considered potential benefits for Potomac in managing the Conquer Risk Funds, noting it was created to provide an efficient structure for clients of Potomac to access the investment strategy. The Trustees then compared the fees and expenses of the Conquer Risk Funds (including the management fee) to other comparable mutual funds. The Trustees reviewed the fees under the Management Agreement and compared them to the average management fee of the Category and Peer Group, noting that each of the Conquer Risk Funds’ management fee was higher than the average management fee for the Category and Peer Group, respectively. The Board also noted that each of the Conquer Risk Funds management fees and expense ratios was within the range of its Category. The Board noted that Potomac doesn’t offer similar strategies as employed by the Conquer Risk Funds to non-mutual fund clients. The Board performed the same comparison as it relates to each Conquer Risk Funds’ expense ratio, noting that each Fund’s expense ratio was higher than the average net expense ratio for the Category and Peer Group, respectively. The Trustees also considered that under the contractual arrangements with Potomac, it was required to pay most of the Conquer Risk Funds’ operating expenses out of its assets. Based on the foregoing, the Board concluded that the fees to be paid to Potomac and the profits to be realized by Potomac, considering all the facts and circumstances, were fair and reasonable in relation to the nature and quality of the services provided by Potomac.
4. The extent to which economies of scale would be realized as the Conquer Risk Funds grow and whether advisory fee levels reflect these economies of scale for the benefit of the Conquer Risk Funds’ investors.
In this regard, the Board considered the Conquer Risk Funds’ fee arrangements with Potomac. The Board discussed the breakpoints included in the Management Agreement and the Services Agreement and the impact on shareholders. It was further noted that under the Services Agreement, Potomac is obligated to pay certain of the Conquer Risk Funds’ operating expenses which had the effect of limiting the overall fees paid by each Fund. Following further discussion of the Conquer Risk Funds’ projected asset levels, expectations for growth, and levels of fees, the Board determined that the Conquer Risk Funds’ fee arrangement with Potomac was fair and reasonable and reasonable in relation to the nature and quality of the services to be provided by Potomac.
5. Possible conflicts of interest and benefits to Potomac.
In evaluating the possibility for conflicts of interest, the Board considered such matters as: the experience and ability of the advisory personnel assigned to the Conquer Risk Funds; the basis of decisions to buy or sell securities for the Conquer Risk Funds; the method for bunching of portfolio securities transac-
2022 Annual Report 33
Additional Information (Unaudited) - continued
tions; the substance and administration of Potomac’s Code of Ethics and other relevant policies described in Potomac’s Form ADV and compliance manual. Following further consideration and discussion, the Board indicated that Potomac’s standards and practices relating to the identification and mitigation of potential conflicts of interest were satisfactory. The Trustees noted that Potomac does not use soft dollars.
After further review, discussion, it was determined that the best interests of the Conquer Risk Funds’ shareholders were served by the renewal of the Management Agreement.
AVAILABILITY OF QUARTERLY SCHEDULE OF INVESTMENTS
The Funds publicly file their complete schedules of portfolio holdings with the Securities and Exchange Commission (“SEC”) for the first and third quarters of each fiscal year on Form N-PORT. The Funds’ Forms N-PORT are available on the SEC’s website at http://www.sec.gov.
Potomac Fund Management, Inc., the Funds’ Advisor, is responsible for exercising the voting rights associated with the securities held by the Funds. A description of the policies and procedures used by the Advisor in fulfilling this responsibility is available without charge on the Funds’ website at www.potomacfund.com/funds. It is also included in the Funds’ Statement of Additional Information, which is available on the SEC’s website at http://www.sec.gov.
Form N-PX provides information regarding how the Funds voted proxies with regards to portfolio securities held during the most recent 12-month period ended June 30th and is available without charge, upon request, by calling our toll free number (1-888-774-6679). This information is also available on the SEC’s website at http://www.sec.gov.
You will find more information about the Funds at www.potomacfund.com/funds. For shareholder inquiries, please call toll-free in the U.S. at 1-888-774-6679.
2022 Annual Report 34
This page intentionally left blank.
2022 Annual Report 35
Trustees and Officers
(Unaudited) |
The Board of Trustees supervises the business activities of the Trust. The names of the Trustees and executive officers of the Trust are shown below. For more information regarding the Trustees, please refer to the Statement of Additional Information, which is available upon request by calling 1-888-774-6679. Each Trustee serves until the Trustee sooner dies, resigns, retires, or is removed.
The Trustees and Officers of the Trust and their principal business activities during the past five years are:
Interested Trustees and Officers
| | | | | Number of | |
| | | | Principal | Portfolios In | Other |
| Name, | Position(s) | Term of Office | Occupation(s) | Fund | Directorships |
| Address(1), | Held With | and Length of | During | Complex | Held By |
| and Year of Birth | the Trust | Time Served | Past 5 Years | Overseen By | Trustee |
| | | | | Trustee | |
| |
| Ross C. Provence, | President | Indefinite Term; | General Partner and Portfolio | N/A | N/A |
| Year of Birth: 1938 | | Since 2000 | Manager for Value Trend Capital | | |
| | | | Management, LP (1995 to current). | | |
| | | | Estate planning attorney (1963 to | | |
| current). |
| |
| Jeffrey R. Provence(2), | Trustee, | Indefinite Term; | CEO, Premier Fund Solutions, Inc. | 13 | Blue Chip |
| Year of Birth: 1969 | Secretary | Since 2000 | (2001 to current). General Partner | | Investor Funds, |
| | and | | and Portfolio Manager for Value | | Meeder Funds |
| | Treasurer | | Trend Capital Management, LP | | |
| | | | (1995 to current). | | |
| |
| Julian G. Winters, | Chief | Indefinite Term; | Managing Member, Watermark | N/A | N/A |
| Year of Birth: 1968 | Compliance | Since 2010 | Solutions LLC (investment compli- | | |
| | Officer | | ance and consulting) (2007 to cur- | | |
| rent). |
| | (1) The address of each trustee and officer is c/o PFS Funds, 1939 Friendship Drive, Suite C, El Cajon, California 92020.
(2) Jeffrey R. Provence is considered an “interested person” as defined in Section 2(a)(19) of the Investment Company Act of 1940 by
virtue of his position with the Trust. Jeffrey R. Provence is the son of Ross C. Provence. |
Independent Trustees
| | | | | Number of | |
| | | | Principal | Portfolios In | Other |
| Name, | Position | Term of Office | Occupation(s) | Fund | Directorships |
| Address(1), | Held With | and Length of | During | Complex | Held By |
| and Year of Birth | the Trust | Time Served | Past 5 Years | Overseen By | Trustee |
| | | | | Trustee | |
| |
| Thomas H. Addis III, | Independent | Indefinite Term; | Executive Director/CEO, Southern | 13 | None |
| Year of Birth: 1945 | Trustee | Since 2000 | California PGA (2006 to current). | | |
| |
| Allen C. Brown, | Independent | Indefinite Term; | Retired. Law Office of Allen C. | 13 | Blue Chip |
| Year of Birth: 1943 | Trustee | Since 2010 | Brown, Estate planning and busi- | | Investor Funds |
| | | | ness attorney (1970 to 2021). | | |
(1) The address of each trustee and officer is c/o PFS Funds, 1939 Friendship Drive, Suite C, El Cajon, California 92020.
2022 Annual Report 36
Investment Advisor
Potomac Fund Management, Inc.
Custodian
U.S. Bank, NA
Distributor
Arbor Court Capital, LLC
Fund Administrator
Premier Fund Solutions, Inc.
Independent Registered Public Accounting Firm
Cohen & Company, Ltd.
Legal Counsel
Practus, LLP
Transfer Agent
Mutual Shareholder Services, LLC |
This report is provided for the general information of the shareholders of the Conquer
Risk Funds. This report is not intended for distribution to prospective investors in the
Funds, unless preceded or accompanied by an effective prospectus. |
Conquer Risk Funds
1-888-774-6679
www.potomacfund.com/funds/
Item 2. Code of Ethics.
The registrant has adopted a code of ethics that applies to the registrant’s principal executive officer and the principal financial officer. The registrant has not made any amendments to its code of ethics during the covered period. The registrant has not granted any waivers from any provisions of the code of ethics during the covered period. A copy of the registrant’s Code of Ethics is filed herewith.
Item 3. Audit Committee Financial Expert.
In this regard, the registrant’s Board of Trustees had determined that George Cossolias was an audit committee financial expert and was independent for purposes of this Item 3. Prior to the filing of this Report Mr. Cossolias passed away. No member of the audit committee has currently identified as having all of the required technical attributes identified in instruction 2 (b) to item 3 of Form N-CSR to qualify as an “audit committee financial expert,” whether through the type of specialized education or experience required by that instruction. At this time, the Board believes the experience provided by each member of the audit committee collectively offers the fund adequate oversight by its audit committee given the fund’s level of financial complexity. The Board will from time to time reexamine such belief.
Item 4. Principal Accountant Fees and Services.
(a-d) The following table details the aggregate fees billed for each of the last two fiscal years for audit fees, audit-related fees, tax fees and other fees by the principal accountant to the registrant. The principal accountant has provided no services to the adviser or any entity controlled by, or under common control with the adviser that provides ongoing services to the registrant.
| | | FYE 6/30/2022 | | FYE 6/30/2021 |
| Audit Fees | | $51,500 | | $50,850 |
| Audit-Related Fees | | $0 | | $0 |
| Tax Fees | | $12,000 | | $12,000 |
| All Other Fees | | $1,000 | | $750 |
Nature of Tax Fees: preparation of Excise Tax Statement and 1120 RIC.
All Other Fees: Semi-Annual Report Review
(e) (1) The audit committee approves all audit and non-audit related services and, therefore, has not adopted pre-approval policies and procedures described in paragraph (c)(7) of Rule 2-01 of Regulation S-X.
(e) (2) None of the services described in paragraph (b) through (d) of this Item were approved by the audit committee pursuant to paragraph (c)(7)(i)(C) of Rule 2-01 of Regulation S-X.
(f) All of the principal accountant’s hours spent on auditing the registrant’s financial statements were attributed to work performed by full-time permanent employees of the principal accountant.
(g) The following table indicates the aggregate non-audit fees billed by the registrant’s principal accountant for services to the registrant , the registrant’s investment adviser (not sub-adviser), and any entity controlling, controlled by, or under common control with the adviser that provides ongoing services to the registrant, for the last two years.
| Non-Audit Fees | | FYE 6/30/2022 | | FYE 6/30/2021 |
| Registrant | | $13,000 | | $12,750 |
| Registrant’s Investment Adviser | | $0 | | $0 |
(h) The principal accountant provided no services to the investment adviser or any entity controlling, controlled by, or under common control with the adviser that provides ongoing services to the registrant.
Item 5. Audit Committee of Listed Companies. Not applicable.
Item 6. Investments.
(a) Not applicable. Schedule filed with Item 1.
(b) Not applicable.
Item 7. Disclosure of Proxy Voting Policies and Procedures for Closed-End Management Investment Companies. Not applicable.
Item 8. Portfolio Managers of Closed End Management Investment Companies. Not applicable.
Item 9. Purchases of Equity Securities by Closed-End Management Investment Companies and Affiliated Purchasers. Not applicable.
Item 10. Submission of Matters to a Vote of Security Holders.
The registrant has not adopted procedures by which shareholders may recommend nominees to the registrant’s board of trustees.
Item 11. Controls and Procedures.
(a) The Registrant’s president and chief financial officer concluded that the disclosure controls and procedures (as defined in Rule 30a-3(c) under the Act (17 CFR 270.30a -3(c))) as of a date within 90 days of the filing date of the report that includes the disclosure required by this paragraph, based on the evaluation of these controls and procedures required by Rule 30a-3(b) under the Act (17 CFR 270.30a -3(b)) and Rules 13a-15(b) or 15d-15(b) under the Exchange Act (17 CFR 240.13a -15(b) or 240.15d -15(b)).
(b) There were no changes in the registrant’s internal control over financial reporting (as defined in Rule 30a-3(d) under the Act (17 CFR 270.30a -3(d)) that occurred during the period covered by this report that has materially affected, or is reasonably likely to materially affect, the registrant’s internal control over financial reporting.
Item 12. Disclosure of Securities Lending Activities for Closed-End Management Investment Companies.
Not applicable.
Item 13. Exhibits.
(a)(1) Code of Ethics. Filed herewith.
(a)(2) Certifications pursuant to Section 302 of the Sarbanes-Oxley Act of 2002. Filed herewith.
(a)(3) Not applicable.
(a)(4) Not applicable.
(b) Certification pursuant to Section 906 of the Sarbanes-Oxley Act of 2002. Filed herewith.
Pursuant to the requirements of the Securities Exchange Act of 1934 and the Investment Company Act of 1940, the registrant has duly caused this report to be signed on its behalf by the undersigned, thereunto duly authorized.
| | By: /s/Ross C. Provence
Ross C. Provence
President |
Pursuant to the requirements of the Securities Exchange Act of 1934 and the Investment Company Act of 1940, this report has been signed below by the following persons on behalf of the registrant and in the capacities and on the dates indicated.
| | By: /s/Ross C. Provence
Ross C. Provence
President |
| | By: /s/Jeffrey R. Provence
Jeffrey R. Provence
Chief Financial Officer |