UNITED STATES
SECURITIES AND EXCHANGE COMMISSION
WASHINGTON, D.C. 20549
| FORM N-CSR |
CERTIFIED SHAREHOLDER REPORT OF REGISTERED MANAGEMENT INVESTMENT COMPANIES
Investment Company Act file number 811-09781
PFS FUNDS
(Exact name of registrant as specified in charter)
| 1939 Friendship Drive, Suite C | |
| El Cajon, CA | 92020 |
| (Address of principal executive offices) | (Zip code) |
| CT Corporation System 155 Federal St., Suite 700, Boston, MA 02110 (Name and address of agent for service) |
Registrant's telephone number, including area code: (619) 588-9700
Date of fiscal year end: June 30
Date of reporting period: December 31, 2023
Item 1. Report to Stockholders.
Conquer Risk Funds
Conquer Risk Defensive Bull Fund
Ticker CRDBX
Conquer Risk Managed Volatility Fund
Ticker CRMVX
Conquer Risk Tactical Opportunities Fund
Ticker CRTOX
Conquer Risk Tactical Rotation Fund
Ticker CRTBX
SEMI-ANNUAL REPORT
December 31, 2023
| Table of Contents | |
| CONQUER RISK FUNDS | |
| Sector Allocation | 2 |
| Performance Information | 4 |
| Schedules of Investments | 8 |
| Statements of Assets and Liabilities | 12 |
| Statements of Operations | 12 |
| Statements of Changes in Net Assets | 14 |
| Financial Highlights | 16 |
| NOTES TO FINANCIAL STATEMENTS | 20 |
| DISCLOSURE OF EXPENSES | 26 |
| ADDITIONAL INFORMATION | 28 |
2023 Semi-Annual Report 1
Conquer Risk Funds (Unaudited)
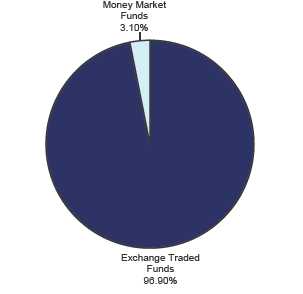
CONQUER RISK DEFENSIVE BULL FUND
Sector Allocation as of December 31, 2023
(As a Percentage of Total Investments Held)
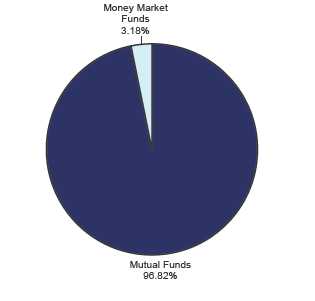
CONQUER RISK MANAGED VOLATILITY FUND
Sector Allocation as of December 31, 2023
(As a Percentage of Total Investments Held)
2023 Semi-Annual Report 2
Conquer Risk Funds (Unaudited)
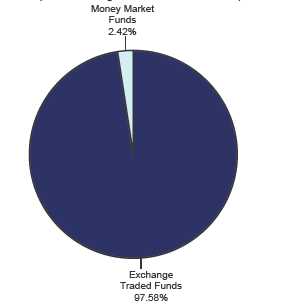
CONQUER RISK TACTICAL OPPORTUNITIES FUND
Sector Allocation as of December 31, 2023
(As a Percentage of Total Investments Held)
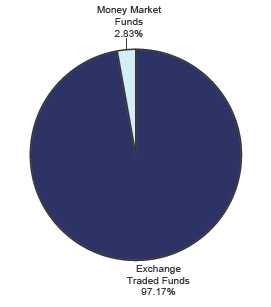
CONQUER RISK TACTICAL ROTATION FUND
Sector Allocation as of December 31, 2023
(As a Percentage of Total Investments Held)
2023 Semi-Annual Report 3
Conquer Risk Defensive Bull Fund (Unaudited)
PERFORMANCE INFORMATION
AVERAGE ANNUAL RETURNS AS OF DECEMBER 31, 2023
December 31, 2023 NAV $12.33
| Since | ||||||
| 1 Year(A) | 3 Year(A) | Inception(A) | ||||
| Conquer Risk Defensive Bull Fund | 19.14% | 11.79% | 17.02% | |||
| S&P 500® Index (B) | 26.29% | 10.00% | 14.89% | |||
| S&P Target Risk Aggressive Index (C) | 18.40% | 4.71% | 9.34% |
Annual Fund Operating Expense Ratio (from 10/3/2023 Prospectus): 1.45%
The Fund’s expense ratio for the period ended December 31, 2023, can be found in the financial highlights included within this report. The Annual Fund Operating Expense Ratio reported above may not correlate to the expense ratio in the Fund’s financial highlights because (a) the financial highlights include only the direct operating expenses incurred by the Fund, not the indirect costs of investing in acquired funds, and (b) the application of breakpoints as described in Note 4.
(A) 1 Year, 3 Year and Since Inception returns include change in share prices and in each case includes reinvestment of any dividends and capital gain distributions. The Conquer Risk Defensive Bull Fund commenced operations on July 1, 2020.
(B) The S&P 500® Index is a widely recognized unmanaged index of equity prices and is representative of a broader market and range of securities than is found in the Fund’s portfolio. The Index is an unmanaged benchmark that assumes reinvestment of all distributions and excludes the effect of taxes and fees. Individuals cannot invest directly in this Index; however, an individual can invest in exchange traded funds or other investment vehicles that attempt to track the performance of a benchmark index.
(C) The S&P Target Risk Aggressive Index is designed to measure the performance of aggressive stock-bond allocations to equities, seeking to maximize opportunities for long-term capital accumulation. It may include small allocations to fixed income to enhance portfolio efficiency. The index is made up of 80% equities and 20% fixed income.
PAST PERFORMANCE DOES NOT GUARANTEE FUTURE RESULTS. INVESTMENT RETURN AND PRINCIPAL VALUE WILL FLUCTUATE SO THAT SHARES, WHEN REDEEMED, MAY BE WORTH MORE OR LESS THAN THEIR ORIGINAL COST. RETURNS DO NOT REFLECT THE DEDUCTION OF TAXES THAT A SHAREHOLDER WOULD PAY ON FUND DISTRIBUTIONS OR THE REDEMPTION OF FUND SHARES. CURRENT PERFORMANCE MAY BE LOWER OR HIGHER THAN THE PERFORMANCE DATA QUOTED. TO OBTAIN PERFORMANCE DATA CURRENT TO THE MOST RECENT MONTH END, PLEASE CALL 1-888-774-6679. AN INVESTMENT IN THE FUND IS SUBJECT TO INVESTMENT RISKS, INCLUDING THE POSSIBLE LOSS OF THE PRINCIPAL AMOUNT INVESTED. THE FUND'S DISTRIBUTOR IS ARBOR COURT CAPITAL, LLC.
2023 Semi-Annual Report 4
Conquer Risk Managed Volatility Fund (Unaudited)
PERFORMANCE INFORMATION
AVERAGE ANNUAL RETURNS AS OF DECEMBER 31, 2023
December 31, 2023 NAV $10.26
| Since | ||||||
| 1 Year(A) | 3 Year(A) | Inception(A) | ||||
| Conquer Risk Managed Volatility Fund | 1.32% | 1.74% | 2.63% | |||
| Bloomberg Global-Aggregate Total Return Index (B) | 5.72% | -5.51% | -3.13% | |||
| S&P Target Risk Conservative Index (C) | 10.94% | 0.06% | 2.34% |
Annual Fund Operating Expense Ratio (from 10/3/2023 Prospectus): 2.12%
The Fund’s expense ratio for the period ended December 31, 2023, can be found in the financial highlights included within this report. The Annual Fund Operating Expense Ratio reported above may not correlate to the expense ratio in the Fund’s financial highlights because (a) the financial highlights include only the direct operating expenses incurred by the Fund, not the indirect costs of investing in acquired funds, and (b) the application of breakpoints as described in Note 4.
(A) 1 Year, 3 Year and Since Inception returns include change in share prices and in each case includes reinvestment of any dividends and capital gain distributions. The Conquer Risk Managed Volatility Fund commenced operations on July 1, 2020.
(B) The Bloomberg Global-Aggregate Total Return Index measures the performance of global investment grade fixed income securities. The Index is widely used as a benchmark for fixed income securities. Individuals cannot invest directly in this Index.
(C) The S&P Target Risk Conservative Index is designed to measure the performance of conservative stock-bond allocations to fixed income, seeking to produce a current income stream and avoid excessive volatility of returns. Equities are included to protect long-term purchasing power. The index is made up of 70% fixed income and 30% equities.
PAST PERFORMANCE DOES NOT GUARANTEE FUTURE RESULTS. INVESTMENT RETURN AND PRINCIPAL VALUE WILL FLUCTUATE SO THAT SHARES, WHEN REDEEMED, MAY BE WORTH MORE OR LESS THAN THEIR ORIGINAL COST. RETURNS DO NOT REFLECT THE DEDUCTION OF TAXES THAT A SHAREHOLDER WOULD PAY ON FUND DISTRIBUTIONS OR THE REDEMPTION OF FUND SHARES. CURRENT PERFORMANCE MAY BE LOWER OR HIGHER THAN THE PERFORMANCE DATA QUOTED. TO OBTAIN PERFORMANCE DATA CURRENT TO THE MOST RECENT MONTH END, PLEASE CALL 1-888-774-6679. AN INVESTMENT IN THE FUND IS SUBJECT TO INVESTMENT RISKS, INCLUDING THE POSSIBLE LOSS OF THE PRINCIPAL AMOUNT INVESTED. THE FUND'S DISTRIBUTOR IS ARBOR COURT CAPITAL, LLC.
2023 Semi-Annual Report 5
Conquer Risk Tactical Opportunities Fund (Unaudited)
PERFORMANCE INFORMATION
AVERAGE ANNUAL RETURNS AS OF DECEMBER 31, 2023
December 31, 2023 NAV $9.74
| Since | ||||||
| 1 Year(A) | 3 Year(A) | Inception(A) | ||||
| Conquer Risk Tactical Opportunities Fund | 15.76% | -1.00% | 4.38% | |||
| S&P 500® Index (B) | 26.29% | 10.00% | 14.89% | |||
| S&P Target Risk Growth Index (C) | 15.38% | 2.89% | 6.55% |
Annual Fund Operating Expense Ratio (from 10/3/2023 Prospectus): 1.87%
The Fund’s expense ratio for the period ended December 31, 2023, can be found in the financial highlights included within this report. The Annual Fund Operating Expense Ratio reported above may not correlate to the expense ratio in the Fund’s financial highlights because (a) the financial highlights include only the direct operating expenses incurred by the Fund, not the indirect costs of investing in acquired funds, and (b) the application of breakpoints as described in Note 4.
(A) 1 Year, 3 Year and Since Inception returns include change in share prices and in each case includes reinvestment of any dividends and capital gain distributions. The Conquer Risk Tactical Opportunities Fund commenced operations on July 1, 2020.
(B) The S&P 500® Index is a widely recognized unmanaged index of equity prices and is representative of a broader market and range of securities than is found in the Fund’s portfolio. The Index is an unmanaged benchmark that assumes reinvestment of all distributions and excludes the effect of taxes and fees. Individuals cannot invest directly in this Index; however, an individual can invest in exchange traded funds or other investment vehicles that attempt to track the performance of a benchmark index.
(C) The S&P Target Risk Growth Index is designed to measure the performance of equity allocations, while seeking to provide limited fixed income exposure to diversify risk. The index is made up of 60% equities and 40% fixed income.
PAST PERFORMANCE DOES NOT GUARANTEE FUTURE RESULTS. INVESTMENT RETURN AND PRINCIPAL VALUE WILL FLUCTUATE SO THAT SHARES, WHEN REDEEMED, MAY BE WORTH MORE OR LESS THAN THEIR ORIGINAL COST. RETURNS DO NOT REFLECT THE DEDUCTION OF TAXES THAT A SHAREHOLDER WOULD PAY ON FUND DISTRIBUTIONS OR THE REDEMPTION OF FUND SHARES. CURRENT PERFORMANCE MAY BE LOWER OR HIGHER THAN THE PERFORMANCE DATA QUOTED. TO OBTAIN PERFORMANCE DATA CURRENT TO THE MOST RECENT MONTH END, PLEASE CALL 1-888-774-6679. AN INVESTMENT IN THE FUND IS SUBJECT TO INVESTMENT RISKS, INCLUDING THE POSSIBLE LOSS OF THE PRINCIPAL AMOUNT INVESTED. THE FUND'S DISTRIBUTOR IS ARBOR COURT CAPITAL, LLC.
2023 Semi-Annual Report 6
Conquer Risk Tactical Rotation Fund (Unaudited)
PERFORMANCE INFORMATION
AVERAGE ANNUAL RETURNS AS OF DECEMBER 31, 2023
December 31, 2023 NAV $10.22
| Since | ||||||
| 1 Year(A) | 3 Year(A) | Inception(A) | ||||
| Conquer Risk Tactical Rotation Fund | 0.55% | 2.96% | 7.03% | |||
| S&P 500® Index (B) | 26.29% | 10.00% | 14.89% | |||
| S&P Target Risk Moderate Index (C) | 12.41% | 1.01% | 3.75% |
Annual Fund Operating Expense Ratio (from 10/3/2023 Prospectus): 1.74%
The Fund’s expense ratio for the period ended December 31, 2023, can be found in the financial highlights included within this report. The Annual Fund Operating Expense Ratio reported above may not correlate to the expense ratio in the Fund’s financial highlights because (a) the financial highlights include only the direct operating expenses incurred by the Fund, not the indirect costs of investing in acquired funds, and (b) the application of breakpoints as described in Note 4.
(A) 1 Year, 3 Year and Since Inception returns include change in share prices and in each case includes reinvestment of any dividends and capital gain distributions. The Conquer Risk Tactical Rotation Fund commenced operations on July 1, 2020.
(B) The S&P 500® Index is a widely recognized unmanaged index of equity prices and is representative of a broader market and range of securities than is found in the Fund’s portfolio. The Index is an unmanaged benchmark that assumes reinvestment of all distributions and excludes the effect of taxes and fees. Individuals cannot invest directly in this Index; however, an individual can invest in exchange traded funds or other investment vehicles that attempt to track the performance of a benchmark index.
(C) The S&P Target Risk Moderate Index is designed to measure the performance of moderate stock-bond allocations to fixed income while seeking to increase opportunities for higher returns through equities. The index is made up of 60% fixed income and 40% equities.
PAST PERFORMANCE DOES NOT GUARANTEE FUTURE RESULTS. INVESTMENT RETURN AND PRINCIPAL VALUE WILL FLUCTUATE SO THAT SHARES, WHEN REDEEMED, MAY BE WORTH MORE OR LESS THAN THEIR ORIGINAL COST. RETURNS DO NOT REFLECT THE DEDUCTION OF TAXES THAT A SHAREHOLDER WOULD PAY ON FUND DISTRIBUTIONS OR THE REDEMPTION OF FUND SHARES. CURRENT PERFORMANCE MAY BE LOWER OR HIGHER THAN THE PERFORMANCE DATA QUOTED. TO OBTAIN PERFORMANCE DATA CURRENT TO THE MOST RECENT MONTH END, PLEASE CALL 1-888-774-6679. AN INVESTMENT IN THE FUND IS SUBJECT TO INVESTMENT RISKS, INCLUDING THE POSSIBLE LOSS OF THE PRINCIPAL AMOUNT INVESTED. THE FUND'S DISTRIBUTOR IS ARBOR COURT CAPITAL, LLC.
2023 Semi-Annual Report 7
| Conquer Risk Defensive Bull Fund | ||||||
| Schedule of Investments | ||||||
| December 31, 2023 (Unaudited) | ||||||
| Shares | Fair Value | % of Net Assets | ||||
| EXCHANGE TRADED FUNDS | ||||||
| Equity | ||||||
| 2,437,817 Direxion Daily S&P 500 Bull 3X Shares * # | $ | 253,508,590 | ||||
| 1,357,583 ProShares UltraPro S&P500® | 74,314,093 | |||||
| 1,323,574 Vanguard 500 Index Fund ETF ** | 578,137,123 | |||||
| Total for Exchange Traded Funds (Cost - $849,026,153) | 905,959,806 | 98.03 | % | |||
| MONEY MARKET FUNDS | ||||||
| 28,988,586 First American Treasury Obligations Fund - Class X 5.28% + | 28,988,586 | 3.14 | % | |||
| Total for Money Market Funds (Cost $28,988,586) | ||||||
| Total Investments (Cost - $878,014,739) | 934,948,392 | 101.17 | % | |||
| Liabilities in Excess of Other Assets | (10,792,698 | ) | -1.17 | % | ||
| Net Assets | $ | 924,155,694 | 100.00 | % | ||
| * Additional Information, including current Prospectus and Annual Reports, is available at http://www.direxion.com/regulatory-documents. ** Additional Information, including current Prospectus and Annual Reports, is available at www.vanguard.com/prospectus and http://personal.vanguard.com/us/literature/reports/ETFs. + The rate shown represents the 7-day yield at December 31, 2023. # Affiliated investment due to Fund holding more than 5% of outstanding shares. See Note 10. |
| The accompanying notes are an integral part of these financial statements. |
2023 Semi-Annual Report 8
| Conquer Risk Managed Volatility Fund | ||||||
| Schedule of Investments | ||||||
| December 31, 2023 (Unaudited) | ||||||
| Shares | Fair Value | % of Net Assets | ||||
| MUTUAL FUNDS | ||||||
| High Yield Bond | ||||||
| 331,785 BondBloxx JP Morgan USD Emerging Markets 1-10 Year Bond ETF | $ | 13,541,573 | ||||
| 156,876 Franklin Dynamic Municipal Bond ETF | 3,805,812 | |||||
| 322,656 iShares 0-5 Year High Yield Corporate Bond ETF | 13,622,536 | |||||
| 1,209,200 iShares Fallen Angels USD Bond ETF | 31,922,880 | |||||
| 412,102 Simplify High Yield PLUS Credit Hedge ETF | 9,402,107 | |||||
| 965,944 SPDR® Nuveen Bloomberg High Yield | 24,438,383 | |||||
| 508,751 VanEck® Fallen Angel High Yield Bond ETF | 14,641,854 | |||||
| 474,254 VanEck® High Yield Muni ETF | 24,485,734 | |||||
| Total for Mutual Funds (Cost - $130,428,027) | 135,860,879 | 97.65 | % | |||
| MONEY MARKET FUNDS | ||||||
| 4,457,506 First American Treasury Obligations Fund - Class X 5.28% + | 4,457,506 | 3.20 | % | |||
| Total for Money Market Funds (Cost $4,457,506) | ||||||
| Total Investments (Cost - $134,885,533) | 140,318,385 | 100.85 | % | |||
| Liabilities in Excess of Other Assets | (1,185,520 | ) | -0.85 | % | ||
| Net Assets | $ | 139,132,865 | 100.00 | % | ||
| + The rate shown represents the 7-day yield at December 31, 2023. The accompanying notes are an integral part of these financial statements. |
2023 Semi-Annual Report 9
| Conquer Risk Tactical Opportunities Fund | |||||||
| Schedule of Investments | |||||||
| December 31, 2023 (Unaudited) | |||||||
| Shares | Fair Value | % of Net Assets | |||||
| EXCHANGE TRADED FUNDS | |||||||
| Equity | |||||||
| 114,104 ARK Innovation ETF * | $ | 5,975,627 | |||||
| 192,727 Direxion Daily Semiconductor Bull 3X Shares | 6,051,628 | ||||||
| 32,913 First Trust Dow Jones Internet Index Fund * | 6,139,920 | ||||||
| 80,170 Invesco QQQ TrustSM, Series 1 ETF ** | 32,831,218 | ||||||
| 14,668 iShares Expanded Tech-Software Sector ETF | 5,949,928 | ||||||
| 209,623 iShares Latin America 40 ETF | 6,091,644 | ||||||
| 62,954 iShares U.S. Home Construction ETF | 6,404,310 | ||||||
| 205,982 ProShares UltraPro QQQ® | 10,443,287 | ||||||
| 109,972 SPDR® S&P Metals & Mining ETF | 6,579,625 | ||||||
| Total for Exchange Traded Funds (Cost - $83,872,722) | 86,467,187 | 97.93 | % | ||||
| MONEY MARKET FUNDS | |||||||
| 2,145,524 First American Treasury Obligations Fund - Class X 5.28% + | 2,145,524 | 2.43 | % | ||||
| Total for Money Market Funds (Cost $2,145,524) | |||||||
| Total Investments (Cost - $86,018,246) | 88,612,711 | 100.36 | % | ||||
| Liabilities in Excess of Other Assets | (314,848 | ) | -0.36 | % | |||
| Net Assets | $ | 88,297,863 | 100.00 | % | |||
| * Non-income producing security. ** Additional Information, including current Prospectus and Annual Reports, is available at www.invesco.com/etfprospectus. + The rate shown represents the 7-day yield at December 31, 2023. |
| The accompanying notes are an integral part of these financial statements. |
2023 Semi-Annual Report 10
| Conquer Risk Tactical Rotation Fund | ||||||
| Schedule of Investments | ||||||
| December 31, 2023 (Unaudited) | ||||||
| Shares | Fair Value | % of Net Assets | ||||
| EXCHANGE TRADED FUNDS | ||||||
| Equity | ||||||
| 380,160 Invesco S&P 500® Equal Weight ETF * | $ | 59,989,248 | ||||
| 207,059 JPMorgan Equity Premium Income ETF | 11,384,104 | |||||
| 122,227 SPDR® Bloomberg High Yield Bond ETF | 11,578,564 | |||||
| 49,954 Vanguard Total Stock Market ETF | 11,850,088 | |||||
| 126,668 WisdomTree Japan Hedged Equity Fund | 11,144,250 | |||||
| 165,924 WisdomTree U.S. Quality Dividend Growth Fund | 11,661,139 | |||||
| Total for Exchange Traded Funds (Cost - $112,489,756) | 117,607,393 | 98.48 | % | |||
| MONEY MARKET FUNDS | ||||||
| 3,420,068 First American Treasury Obligations Fund - Class X 5.28% + | 3,420,068 | 2.86 | % | |||
| Total for Money Market Funds (Cost $3,420,068) | ||||||
| Total Investments (Cost - $115,909,824) | 121,027,461 | 101.34 | % | |||
| Liabilities in Excess of Other Assets | (1,601,233 | ) | -1.34 | % | ||
| Net Assets | $ | 119,426,228 | 100.00 | % | ||
| * Additional Information, including current Prospectus and Annual Reports, is available at www.invesco.com/etfprospectus. + The rate shown represents the 7-day yield at December 31, 2023. |
| The accompanying notes are an integral part of these financial statements. |
2023 Semi-Annual Report 11
| Conquer Risk Funds | ||||||||
| Statements of Assets and Liabilities (Unaudited) | Defensive | Managed | ||||||
| December 31, 2023 | Bull Fund | Volatility Fund | ||||||
| Assets: | ||||||||
| Unaffiliated Investment Securities at Fair Value* | $ | 681,439,802 | $ | 140,318,385 | ||||
| Affiliated Investment Securities at Fair Value** | 253,508,590 | - | ||||||
| Receivable for Fund Shares Sold | 1,970,424 | 353,241 | ||||||
| Dividends Receivable | 636,959 | 86,402 | ||||||
| Total Assets | 937,555,775 | 140,758,028 | ||||||
| Liabilities: | ||||||||
| Payable for Fund Shares Redeemed | 1,597,385 | 137,578 | ||||||
| Payable for Securities Purchased | 10,949,375 | 1,322,750 | ||||||
| Management Fees Payable | 699,904 | 135,598 | ||||||
| Service Fees Payable | 153,417 | 29,237 | ||||||
| Total Liabilities | 13,400,081 | 1,625,163 | ||||||
| Net Assets | $ | 924,155,694 | $ | 139,132,865 | ||||
| Net Assets Consist of: | ||||||||
| Paid In Capital | $ | 952,908,105 | $ | 137,410,915 | ||||
| Total Distributable Earnings/(Accumulated Deficit) | (28,752,411 | ) | 1,721,950 | |||||
| Net Assets | $ | 924,155,694 | $ | 139,132,865 | ||||
| Net Asset Value, Offering Price and Redemption Price per Share | $ | 12.33 | $ | 10.26 | ||||
| * Unaffiliated Investments at Identified Cost | $ | 651,229,056 | $ | 134,885,533 | ||||
| ** Affiliated Investments at Identified Cost | $ | 226,785,683 | $ | - | ||||
| Shares Outstanding (Unlimited number of shares | 74,973,829 | 13,565,290 | ||||||
| authorized without par value) | ||||||||
| Statements of Operations (Unaudited) | ||||||||
| For the six month period ended December 31, 2023 | ||||||||
| Investment Income: | ||||||||
| Dividends from Unaffiliated Investments | $ | 9,138,279 | $ | 2,912,112 | ||||
| Dividends from Affiliated Investments | 1,320,378 | - | ||||||
| Total Investment Income | 10,458,657 | 2,912,112 | ||||||
| Expenses: | ||||||||
| Management Fees | 3,717,604 | 631,401 | ||||||
| Service Fees | 651,268 | 141,260 | ||||||
| Interest Expense | - | 4,729 | ||||||
| Net Expenses | 4,368,872 | 777,390 | ||||||
| Net Investment Income | 6,089,785 | 2,134,722 | ||||||
| Realized and Unrealized Gain (Loss) on Investments: | ||||||||
| Net Realized Gain (Loss) on Unaffiliated Investments | (34,957,481 | ) | (1,498,069 | ) | ||||
| Net Realized Gain (Loss) on Affiliated Investments | (50,850,889 | ) | - | |||||
| Net Change in Net Unrealized Appreciation (Depreciation) on Unaffiliated Investments | 25,417,520 | 5,474,075 | ||||||
| Net Change in Net Unrealized Appreciation (Depreciation) on Affiliated Investments | 17,401,493 | - | ||||||
| Net Realized and Unrealized Gain (Loss) on Investments | (42,989,357 | ) | 3,976,006 | |||||
| Net Increase (Decrease) in Net Assets from Operations | $ | (36,899,572 | ) | $ | 6,110,728 | |||
| The accompanying notes are an integral part of these financial statements. |
2023 Semi-Annual Report 12
| Conquer Risk Funds | ||||||||
| Statements of Assets and Liabilities (Unaudited) | Tactical | Tactical | ||||||
| December 31, 2023 | Opportunities | Rotation | ||||||
| Fund | Fund | |||||||
| Assets: | ||||||||
| Investment Securities at Fair Value* | $ | 88,612,711 | $ | 121,027,461 | ||||
| Receivable for Fund Shares Sold | 239,584 | 223,621 | ||||||
| Dividends Receivable | 165,668 | 136,939 | ||||||
| Total Assets | 89,017,963 | 121,388,021 | ||||||
| Liabilities: | ||||||||
| Payable for Fund Shares Redeemed | 75,019 | 74,453 | ||||||
| Payable for Securities Purchased | 534,697 | 1,742,565 | ||||||
| Management Fees Payable | 89,682 | 118,881 | ||||||
| Service Fees Payable | 20,702 | 25,894 | ||||||
| Total Liabilities | 720,100 | 1,961,793 | ||||||
| Net Assets | $ | 88,297,863 | $ | 119,426,228 | ||||
| Net Assets Consist of: | ||||||||
| Paid In Capital | $ | 92,801,643 | $ | 121,274,789 | ||||
| Total Accumulated Deficit | (4,503,780 | ) | (1,848,561 | ) | ||||
| Net Assets | $ | 88,297,863 | $ | 119,426,228 | ||||
| Net Asset Value, Offering Price and Redemption Price per Share | $ | 9.74 | $ | 10.22 | ||||
| * Investments at Identified Cost | $ | 86,018,246 | $ | 115,909,824 | ||||
| Shares Outstanding (Unlimited number of shares | 9,063,021 | 11,685,146 | ||||||
| authorized without par value) | ||||||||
| Statements of Operations (Unaudited) | ||||||||
| For the six month period ended December 31, 2023 | ||||||||
| Investment Income: | ||||||||
| Dividends | $ | 1,280,472 | $ | 1,528,150 | ||||
| Total Investment Income | 1,280,472 | 1,528,150 | ||||||
| Expenses: | ||||||||
| Management Fees | 632,088 | 643,665 | ||||||
| Service Fees | 136,815 | 141,544 | ||||||
| Net Expenses | 768,903 | 785,209 | ||||||
| Net Investment Income | 511,569 | 742,941 | ||||||
| Realized and Unrealized Gain (Loss) on Investments: | ||||||||
| Net Realized Gain (Loss) on Investments | (3,219,357 | ) | (5,513,306 | ) | ||||
| Net Change in Net Unrealized Appreciation on Investments | (3,776,601 | ) | 3,565,465 | |||||
| Net Realized and Unrealized Gain (Loss) on Investments | (6,995,958 | ) | (1,947,841 | ) | ||||
| Net Increase (Decrease) in Net Assets from Operations | $ | (6,484,389 | ) | $ | (1,204,900 | ) | ||
| The accompanying notes are an integral part of these financial statements. |
2023 Semi-Annual Report 13
| Conquer Risk Funds | ||||||||||||||||
| Statements of Changes in Net Assets | Defensive Bull Fund | Managed Volatility Fund | ||||||||||||||
| (Unaudited) | (Unaudited) | |||||||||||||||
| 7/1/2023 | 7/1/2022 | 7/1/2023 | 7/1/2022 | |||||||||||||
| to | to | to | to | |||||||||||||
| 12/31/2023 | 6/30/2023 | 12/31/2023 | 6/30/2023 | |||||||||||||
| From Operations: | ||||||||||||||||
| Net Investment Income (Loss) | $ | 6,089,785 | $ | 8,488,029 | $ | 2,134,722 | $ | 1,549,507 | ||||||||
| Capital Gain Distributions from Investment Companies | - | - | - | 145,856 | ||||||||||||
| Net Realized Gain (Loss) on Investments | (85,808,370 | ) | 107,901,578 | (1,498,069 | ) | 1,553,959 | ||||||||||
| Net Change in Unrealized Appreciation (Depreciation) | ||||||||||||||||
| on Investments | 42,819,013 | 14,114,640 | 5,474,075 | (552,193 | ) | |||||||||||
| Net Increase (Decrease) in Net Assets from Operations | (36,899,572 | ) | 130,504,247 | 6,110,728 | 2,697,129 | |||||||||||
| From Distributions to Shareholders: | (72,611,422 | ) | (549,021 | ) | (3,180,393 | ) | (399,696 | ) | ||||||||
| From Capital Share Transactions: | ||||||||||||||||
| Proceeds From Sale of Shares | 418,622,697 | 375,953,521 | 100,337,317 | 94,101,178 | ||||||||||||
| Shares Issued on Reinvestment of Dividends | 72,005,160 | 547,864 | 3,059,460 | 355,004 | ||||||||||||
| Cost of Shares Redeemed | (109,072,278 | ) | (89,621,709 | ) | (41,903,434 | ) | (64,739,257 | ) | ||||||||
| Net Increase from Shareholder Activity | 381,555,579 | 286,879,676 | 61,493,343 | 29,716,925 | ||||||||||||
| Net Increase in Net Assets | 272,044,585 | 416,834,902 | 64,423,678 | 32,014,358 | ||||||||||||
| Net Assets at Beginning of Period | 652,111,109 | 235,276,207 | 74,709,187 | 42,694,829 | ||||||||||||
| Net Assets at End of Period | $ | 924,155,694 | $ | 652,111,109 | $ | 139,132,865 | $ | 74,709,187 | ||||||||
| Share Transactions: | ||||||||||||||||
| Issued | 32,594,988 | 29,582,999 | 10,019,256 | 9,276,891 | ||||||||||||
| Reinvested | 6,107,571 | 47,932 | 301,793 | 34,234 | ||||||||||||
| Redeemed | (8,891,864 | ) | (7,356,254 | ) | (4,149,683 | ) | (6,421,938 | ) | ||||||||
| Net Increase in Shares | 29,810,695 | 22,274,677 | 6,171,366 | 2,889,187 | ||||||||||||
| Shares Outstanding Beginning of Period | 45,163,134 | 22,888,457 | 7,393,924 | 4,504,737 | ||||||||||||
| Shares Outstanding End of Period | 74,973,829 | 45,163,134 | 13,565,290 | 7,393,924 | ||||||||||||
| The accompanying notes are an integral part of these financial statements. |
2023 Semi-Annual Report 14
| Conquer Risk Funds | ||||||||||||||||
| Statements of Changes in Net Assets | Tactical Opportunities Fund | Tactical Rotation Fund | ||||||||||||||
| (Unaudited) | (Unaudited) | |||||||||||||||
| 7/1/2023 | 7/1/2022 | 7/1/2023 | 7/1/2022 | |||||||||||||
| to | to | to | to | |||||||||||||
| 12/31/2023 | 6/30/2023 | 12/31/2023 | 6/30/2023 | |||||||||||||
| From Operations: | ||||||||||||||||
| Net Investment Income (Loss) | $ | 511,569 | $ | 366,883 | $ | 742,941 | $ | 662,059 | ||||||||
| Net Realized Gain (Loss) on Investments | (3,219,357 | ) | 6,524,087 | (5,513,306 | ) | 3,651,655 | ||||||||||
| Net Change in Unrealized Appreciation (Depreciation) | ||||||||||||||||
| on Investments | (3,776,601 | ) | 6,934,497 | 3,565,465 | 1,842,924 | |||||||||||
| Net Increase (Decrease) in Net Assets from Operations | (6,484,389 | ) | 13,825,467 | (1,204,900 | ) | 6,156,638 | ||||||||||
| From Distributions to Shareholders: | (615,611 | ) | - | (1,154,589 | ) | (81,288 | ) | |||||||||
| From Capital Share Transactions: | ||||||||||||||||
| Proceeds From Sale of Shares | 50,266,213 | 67,252,220 | 46,356,919 | 77,204,565 | ||||||||||||
| Shares Issued on Reinvestment of Dividends | 591,684 | - | 1,123,358 | 81,026 | ||||||||||||
| Cost of Shares Redeemed | (58,963,353 | ) | (13,838,576 | ) | (16,749,272 | ) | (57,254,306 | ) | ||||||||
| Net Increase from Shareholder Activity | (8,105,456 | ) | 53,413,644 | 30,731,005 | 20,031,285 | |||||||||||
| Net Increase (Decrease) in Net Assets | (15,205,456 | ) | 67,239,111 | 28,371,516 | 26,106,635 | |||||||||||
| Net Assets at Beginning of Period | 103,503,319 | 36,264,208 | 91,054,712 | 64,948,077 | ||||||||||||
| Net Assets at End of Period | $ | 88,297,863 | $ | 103,503,319 | $ | 119,426,228 | $ | 91,054,712 | ||||||||
| Share Transactions: | ||||||||||||||||
| Issued | 5,050,761 | 7,115,933 | 4,576,750 | 7,558,636 | ||||||||||||
| Reinvested | 60,674 | - | 111,047 | 7,889 | ||||||||||||
| Redeemed | (6,132,286 | ) | (1,503,608 | ) | (1,663,219 | ) | (5,589,158 | ) | ||||||||
| Net Increase (Decrease) in Shares | (1,020,851 | ) | 5,612,325 | 3,024,578 | 1,977,367 | |||||||||||
| Shares Outstanding Beginning of Period | 10,083,872 | 4,471,547 | 8,660,568 | 6,683,201 | ||||||||||||
| Shares Outstanding End of Period | 9,063,021 | 10,083,872 | 11,685,146 | 8,660,568 | ||||||||||||
| The accompanying notes are an integral part of these financial statements. |
2023 Semi-Annual Report 15
| Conquer Risk Defensive Bull Fund | ||||||||||||||||
| Financial Highlights | ||||||||||||||||
| (Unaudited) | ||||||||||||||||
| Selected data for a share outstanding throughout the period: | 7/1/2023 | 7/1/2022 | 7/1/2021 | 7/1/2020* | ||||||||||||
| to | to | to | to | |||||||||||||
| 12/31/2023 | 6/30/2023 | 6/30/2022 | 6/30/2021 | |||||||||||||
| Net Asset Value - Beginning of Period | $ | 14.44 | $ | 10.28 | $ | 14.66 | $ | 10.00 | ||||||||
| Net Investment Income (Loss) (a) (e) | 0.10 | 0.29 | (0.08 | ) | (0.05 | ) | ||||||||||
| Net Gain (Loss) on Investments (Realized and Unrealized) (b) | (0.98 | ) | 3.89 | (1.16 | ) | 4.91 | ||||||||||
| Total from Investment Operations | (0.88 | ) | 4.18 | (1.24 | ) | 4.86 | ||||||||||
| Distributions (From Net Investment Income) | (0.21 | ) | - | - | - | |||||||||||
| Distributions (From Capital Gains) | (1.02 | ) | (0.02 | ) | (3.14 | ) | (0.20 | ) | ||||||||
| Total Distributions | (1.23 | ) | (0.02 | ) | (3.14 | ) | (0.20 | ) | ||||||||
| Net Asset Value - End of Period | $ | 12.33 | $ | 14.44 | $ | 10.28 | $ | 14.66 | ||||||||
| Total Return (c) | (5.70 | )% | ** | 40.72 | % | (12.38 | )% | 49.04 | % | |||||||
| Ratios/Supplemental Data | ||||||||||||||||
| Net Assets - End of Period (Thousands) | $ | 924,156 | $ | 652,111 | $ | 235,276 | $ | 233,859 | ||||||||
| Before Waiver | ||||||||||||||||
| Ratio of Expenses to Average Net Assets (d) | 1.13 | % | *** | 1.17 | % | 1.29 | % | 1.55 | % | |||||||
| Ratio of Net Investment Income (Loss) to Average Net Assets (d) (e) | 1.57 | % | *** | 2.37 | % | (0.64 | )% | (0.41 | )% | |||||||
| After Waiver | ||||||||||||||||
| Ratio of Expenses to Average Net Assets (d) | 1.13 | % | *** | 1.17 | % | 1.24 | % | (f) | 1.53 | % | (f) | |||||
| Ratio of Net Investment Income (Loss) to Average Net Assets (d) (e) | 1.57 | % | *** | 2.37 | % | (0.59 | )% | (0.39 | )% | |||||||
| Portfolio Turnover Rate | 648.70 | % | ** | 1,628.24 | % | 1,558.57 | % | 1,657.50 | % | |||||||
| * Commencement of Operations. ** Not Annualized. *** Annualized. (a) Per share amounts were calculated using the average shares method. (b) Realized and unrealized gains and losses per share in this caption are balancing amounts necessary to reconcile the change in net asset value for the period, and may not reconcile with the aggregate gains and losses in the Statement of Operations due to share transactions for the period. (c) Total return represents the rate that the investor would have earned or lost on an investment in the Fund assuming reinvestment of dividends and distributions, if any. (d) These ratios exclude the impact of expenses of the underlying investment security holdings listed in the Schedule of Investments. (e) Recognition of the net investment income (loss) by the Fund is affected by the timing of the declaration of dividends by the underlying investment security holdings listed on the Schedule of Investments. (f) All waivers incurred during the noted period were voluntary. If the voluntary waivers had not occurred, the expense ratios would have been higher. See Note 4 for additional information on the application of waivers during the period. |
| The accompanying notes are an integral part of these financial statements. |
| Conquer Risk Managed Volatility Fund | ||||||||||||||||
| Financial Highlights | ||||||||||||||||
| (Unaudited) | ||||||||||||||||
| Selected data for a share outstanding throughout the period: | 7/1/2023 | 7/1/2022 | 7/1/2021 | 7/1/2020* | ||||||||||||
| to | to | to | to | |||||||||||||
| 12/31/2023 | 6/30/2023 | 6/30/2022 | 6/30/2021 | |||||||||||||
| Net Asset Value - Beginning of Period | $ | 10.10 | $ | 9.48 | $ | 10.44 | $ | 10.00 | ||||||||
| Net Investment Income (a) (e) | 0.21 | 0.32 | 0.06 | 0.15 | ||||||||||||
| Net Gain (Loss) on Investments (Realized and Unrealized) (b) | 0.23 | 0.36 | (0.79 | ) | 0.39 | |||||||||||
| Total from Investment Operations | 0.44 | 0.68 | (0.73 | ) | 0.54 | |||||||||||
| Distributions (From Net Investment Income) | (0.28 | ) | (0.06 | ) | (0.10 | ) | (0.10 | ) | ||||||||
| Distributions (From Capital Gains) | - | - | (0.13 | ) | - | |||||||||||
| Total Distributions | (0.28 | ) | (0.06 | ) | (0.23 | ) | (0.10 | ) | ||||||||
| Net Asset Value - End of Period | $ | 10.26 | $ | 10.10 | $ | 9.48 | $ | 10.44 | ||||||||
| Total Return (c) | 4.43 | % | ** | 7.16 | % | (7.15 | )% | 5.39 | % | |||||||
| Ratios/Supplemental Data | ||||||||||||||||
| Net Assets - End of Period (Thousands) | $ | 139,133 | $ | 74,709 | $ | 42,695 | $ | 30,992 | ||||||||
| Before Waiver | ||||||||||||||||
| Ratio of Expenses to Average Net Assets (d) | 1.50 | % | *** (h) | 1.65 | % | (g) | 1.66 | % | 1.88 | % | ||||||
| Ratio of Net Investment Income to Average Net Assets (d) (e) | 4.12 | % | *** | 3.11 | % | 0.52 | % | 1.43 | % | |||||||
| After Waiver | ||||||||||||||||
| Ratio of Expenses to Average Net Assets (d) | 1.50 | % | *** (h) | 1.64 | % | (g) | 1.62 | % | (f) | 1.87 | % | (f) | ||||
| Ratio of Net Investment Income to Average Net Assets (d) (e) | 4.12 | % | *** | 3.12 | % | 0.56 | % | 1.44 | % | |||||||
| Portfolio Turnover Rate | 263.25 | % | ** | 761.70 | % | 620.91 | % | 519.72 | % | |||||||
| * Commencement of Operations. ** Not Annualized. *** Annualized. (a) Per share amounts were calculated using the average shares method. (b) Realized and unrealized gains and losses per share in this caption are balancing amounts necessary to reconcile the change in net asset value for the period, and may not reconcile with the aggregate gains and losses in the Statement of Operations due to share transactions for the period. (c) Total return represents the rate that the investor would have earned or lost on an investment in the Fund assuming reinvestment of dividends and distributions, if any. (d) These ratios exclude the impact of expenses of the underlying investment security holdings listed in the Schedule of Investments. (e) Recognition of the net investment income (loss) by the Fund is affected by the timing of the declaration of dividends by the underlying investment security holdings listed on the Schedule of Investments. (f) All waivers incurred during the noted period were voluntary. If the voluntary waivers had not occurred, the expense ratios would have been higher. See Note 4 for additional information on the application of waivers during the period. (g) Excluding interest expense, the before waiver and after waiver ratios of expenses to average net assets would have been 1.60% and 1.59%, respectively. (h) Excluding interest expense, the before waiver and after waiver ratios of expenses to average net assets would have been 1.49% and 1.49%, respectively. |
| The accompanying notes are an integral part of these financial statements. |
2023 Semi-Annual Report 17
| Conquer Risk Tactical Opportunities Fund | ||||||||||||||||
| Financial Highlights | ||||||||||||||||
| (Unaudited) | ||||||||||||||||
| Selected data for a share outstanding throughout the period: | 7/1/2023 | 7/1/2022 | 7/1/2021 | 7/1/2020* | ||||||||||||
| to | to | to | to | |||||||||||||
| 12/31/2023 | 6/30/2023 | 6/30/2022 | 6/30/2021 | |||||||||||||
| Net Asset Value - Beginning of Period | $ | 10.26 | $ | 8.11 | $ | 12.12 | $ | 10.00 | ||||||||
| Net Investment Income (Loss) (a) (e) | 0.05 | 0.06 | (0.10 | ) | (0.11 | ) | ||||||||||
| Net Gain (Loss) on Investments (Realized and Unrealized) (b) | (0.50 | ) | 2.09 | (2.41 | ) | 2.58 | ||||||||||
| Total from Investment Operations | (0.45 | ) | 2.15 | (2.51 | ) | 2.47 | ||||||||||
| Distributions (From Net Investment Income) | (0.07 | ) | - | - | - | |||||||||||
| Distributions (From Capital Gains) | - | - | (1.50 | ) | (0.35 | ) | ||||||||||
| Total Distributions | (0.07 | ) | - | (1.50 | ) | (0.35 | ) | |||||||||
| Net Asset Value - End of Period | $ | 9.74 | $ | 10.26 | $ | 8.11 | $ | 12.12 | ||||||||
| Total Return (c) | (4.43 | )% ** | 26.51 | % | (23.00 | )% | 24.81 | % | ||||||||
| Ratios/Supplemental Data | ||||||||||||||||
| Net Assets - End of Period (Thousands) | $ | 88,298 | $ | 103,503 | $ | 36,264 | $ | 43,525 | ||||||||
| Before Waiver | ||||||||||||||||
| Ratio of Expenses to Average Net Assets (d) | 1.49 | % *** | 1.59 | % | 1.68 | % | 1.81 | % | ||||||||
| Ratio of Net Investment Income (Loss) to Average Net Assets (d) (e) | 0.99 | % *** | 0.68 | % | (1.05 | )% | (0.98 | )% | ||||||||
| After Waiver | ||||||||||||||||
| Ratio of Expenses to Average Net Assets (d) | 1.49 | % *** | 1.59 | % | 1.63 | % | (f) | 1.80 | % | (f) | ||||||
| Ratio of Net Investment Income (Loss) to Average Net Assets (d) (e) | 0.99 | % *** | 0.68 | % | (1.00 | )% | (0.97 | )% | ||||||||
| Portfolio Turnover Rate | 800.92 | % ** | 1,208.66 | % | 1,483.56 | % | 1,291.12 | % | ||||||||
| * Commencement of Operations. ** Not Annualized. *** Annualized. (a) Per share amounts were calculated using the average shares method. (b) Realized and unrealized gains and losses per share in this caption are balancing amounts necessary to reconcile the change in net asset value for the period, and may not reconcile with the aggregate gains and losses in the Statement of Operations due to share transactions for the period. (c) Total return represents the rate that the investor would have earned or lost on an investment in the Fund assuming reinvestment of dividends and distributions, if any. (d) These ratios exclude the impact of expenses of the underlying investment security holdings listed in the Schedule of Investments. (e) Recognition of the net investment income (loss) by the Fund is affected by the timing of the declaration of dividends by the underlying investment security holdings listed on the Schedule of Investments. (f) Voluntary expense waivers reduced the gross expense ratio by 0.01% and 0.05%, respectfully, during the fiscal years ended June 30, 2021 and June 30, 2022, respectfully. If the voluntary waivers had not occurred, the expense ratios would have been higher. See Note 4 for additional information on the applica- tion of waivers during the period. |
| The accompanying notes are an integral part of these financial statements. |
2023 Semi-Annual Report 18
| Conquer Risk Tactical Rotation Fund | ||||||||||||||||
| Financial Highlights | ||||||||||||||||
| (Unaudited) | ||||||||||||||||
| Selected data for a share outstanding throughout the period: | 7/1/2023 | 7/1/2022 | 7/1/2021 | 7/1/2020* | ||||||||||||
| to | to | to | to | |||||||||||||
| 12/31/2023 | 6/30/2023 | 6/30/2022 | 6/30/2021 | |||||||||||||
| Net Asset Value - Beginning of Period | $ | 10.51 | $ | 9.72 | $ | 12.43 | $ | 10.00 | ||||||||
| Net Investment Income (Loss) (a) (e) | 0.07 | 0.09 | (0.08 | ) | (0.02 | ) | ||||||||||
| Net Gain (Loss) on Investments (Realized and Unrealized) (b) | (0.25 | ) | 0.71 | (0.63 | ) | 2.77 | ||||||||||
| Total from Investment Operations | (0.18 | ) | 0.80 | (0.71 | ) | 2.75 | ||||||||||
| Distributions (From Net Investment Income) | (0.11 | ) | - | - | (0.02 | ) | ||||||||||
| Distributions (From Capital Gains) | - | (0.01 | ) | (2.00 | ) | (0.30 | ) | |||||||||
| Total Distributions | (0.11 | ) | (0.01 | ) | (2.00 | ) | (0.32 | ) | ||||||||
| Net Asset Value - End of Period | $ | 10.22 | $ | 10.51 | $ | 9.72 | $ | 12.43 | ||||||||
| Total Return (c) | (1.74 | )% | ** | 8.27 | % | (6.74 | )% | 27.85 | % | |||||||
| Ratios/Supplemental Data | ||||||||||||||||
| Net Assets - End of Period (Thousands) | $ | 119,426 | $ | 91,055 | $ | 64,948 | $ | 55,497 | ||||||||
| Before Waiver | ||||||||||||||||
| Ratio of Expenses to Average Net Assets (d) | 1.51 | % | *** | 1.55 | % | 1.62 | % | 1.80 | % | |||||||
| Ratio of Net Investment Income (Loss) to Average Net Assets (d) (e) | 1.43 | % | *** | 0.92 | % | (0.79 | )% | (0.18 | )% | |||||||
| After Waiver | ||||||||||||||||
| Ratio of Expenses to Average Net Assets (d) | 1.51 | % | *** | 1.55 | % | 1.58 | % | (f) | 1.79 | % | (f) | |||||
| Ratio of Net Investment Income (Loss) to Average Net Assets (d) (e) | 1.43 | % | *** | 0.92 | % | (0.75 | )% | (0.17 | )% | |||||||
| Portfolio Turnover Rate | 383.97 | % | ** | 1,420.24 | % | 1,544.72 | % | 1,028.67 | % | |||||||
| * Commencement of Operations. ** Not Annualized. *** Annualized. (a) Per share amounts were calculated using the average shares method. (b) Realized and unrealized gains and losses per share in this caption are balancing amounts necessary to reconcile the change in net asset value for the period, and may not reconcile with the aggregate gains and losses in the Statement of Operations due to share transactions for the period. (c) Total return represents the rate that the investor would have earned or lost on an investment in the Fund assuming reinvestment of dividends and distributions, if any. (d) These ratios exclude the impact of expenses of the underlying investment security holdings listed in the Schedule of Investments. (e) Recognition of the net investment income (loss) by the Fund is affected by the timing of the declaration of dividends by the underlying investment security holdings listed on the Schedule of Investments. (f) All waivers incurred during the noted period were voluntary. If the voluntary waivers had not occurred, the expense ratios would have been higher. See Note 4 for additional information on the application of waivers during the period. |
| The accompanying notes are an integral part of these financial statements. |
2023 Semi-Annual Report 19
| NOTES TO FINANCIAL STATEMENTS CONQUER RISK FUNDS DECEMBER 31, 2023 (Unaudited) |
1.) ORGANIZATION
The Conquer Risk Funds (the “Funds”) are each a series of PFS Funds (the “Trust”). The Trust is an open-end management investment company that was organized in Massachusetts by an Agreement and Declaration of Trust dated January 13, 2000, as amended on January 20, 2011. The Trust is registered as an open-end investment company under the Investment Company Act of 1940, as amended (the “1940 Act”). The Trust may offer an unlimited number of shares of beneficial interest in a number of separate series, each series representing a distinct fund with its own investment objectives and policies. Conquer Risk Defensive Bull Fund (“Defensive Bull Fund”), Conquer Risk Managed Volatility Fund (“Managed Volatility Fund”), Conquer Risk Tactical Opportunities Fund (“Tactical Opportunities Fund”) and Conquer Risk Tactical Rotation Fund (“Tactical Rotation Fund”) (each a “Fund” and collectively the “Funds”) were each organized as a non-diversified series of the Trust, on June 9, 2020, and commenced operations on July 1, 2020. As of December 31, 2023, there were thirteen series authorized by the Trust. The investment advisor to the Funds is Potomac Fund Management, Inc. (the “Advisor”). Significant accounting policies of the Funds are presented below.
2.) SIGNIFICANT ACCOUNTING POLICIES
The Funds are investment companies and accordingly follow the investment company accounting and reporting guidance of the Financial Accounting Standards Board (“FASB”) Accounting Standards Codification Topic 946 Financial Services - Investment Companies. The financial statements are prepared in conformity with accounting principles generally accepted in the United States of America (“GAAP”). The Funds follow the significant accounting policies described in this section.
SECURITY VALUATION
All investments in securities are valued as described in Note 3. The Trust’s Board of Trustees (“Board”) has designated the Advisor as “Valuation Designee” pursuant to Rule 2a-5 under the 1940 Act.
SHARE VALUATION
Each Fund’s net asset value (the “NAV”) is generally calculated as of the close of trading on the New York Stock Exchange (the “Exchange”) (normally 4:00 p.m. Eastern time) every day the Exchange is open. The NAV for each Fund is calculated by taking the total value of the Fund’s assets, subtracting its liabilities, and then dividing by the total number of shares outstanding, rounded to the nearest cent. The offering price and redemption price per share is equal to the net asset value per share.
FEDERAL INCOME TAXES
The Funds’ policy is to continue to comply with the requirements of the Internal Revenue Code that are applicable to regulated investment companies and to distribute all of their taxable income to shareholders. Therefore, no federal income tax provision is required. It is the Funds’ policy to distribute annually, prior to the end of the calendar year, dividends sufficient to satisfy excise tax requirements of the Internal Revenue Code. This Internal Revenue Code requirement may cause an excess of distributions over the book year-end accumulated income. In addition, it is the Funds’ policy to distribute annually, after the end of the fiscal year, any remaining net investment income and net realized capital gains.
The Funds recognize the tax benefits of certain tax positions only where the position is “more likely than not” to be sustained assuming examination by tax authorities. Management has analyzed the Funds’ tax positions, and has concluded that no liability for unrecognized tax benefits should be recorded related to uncertain tax positions taken on returns filed for the open tax years. The Funds identify their major tax jurisdictions as U.S. Federal and State tax authorities; the Funds are not aware of any tax positions for which it is reasonably possible that the total amounts of unrecognized tax benefits will change materially in the next twelve months. The Funds recognize interest and penalties, if any, related to unrecognized tax benefits as income tax expense in the Statements of Operations. During the six month period ended December 31, 2023, the Funds did not incur any interest or penalties.
DISTRIBUTIONS TO SHAREHOLDERS
Distributions to shareholders, which are determined in accordance with income tax regulations, are recorded on the ex-dividend date. The Funds may utilize earnings and profits distributed to shareholders on redemptions of shares as part of the dividends paid deduction. The treatment for financial reporting purposes of distributions made to shareholders during the year from net investment income or net realized capital gains may differ from their ultimate treatment for federal income tax purposes. These differences are caused primarily by differences in the timing of recognition of certain components of income, expense or realized capi-
2023 Semi-Annual Report 20
Notes to Financial Statements (Unaudited) - continued
tal gain for federal income tax purposes. Where such differences are permanent in nature, they are reclassified in the components of the net assets based on their ultimate characterization for federal income tax purposes. Any such reclassification will have no effect on net assets, results of operations or net asset values per share of any Fund.
USE OF ESTIMATES
The financial statements are prepared in accordance with GAAP, which requires management to make estimates and assumptions that affect the reported amounts of assets and liabilities and disclosure of contingent assets and liabilities at the date of the financial statements and the reported amounts of increases and decreases in net assets from operations during the reporting period. Actual results could differ from those estimates.
OTHER
The Funds record security transactions based on a trade date. Dividend income is recognized on the ex-dividend date, and interest income, if any, is recognized on an accrual basis. The Funds use the specific identification method in computing gain or loss on the sale of investment securities. Long-term capital gain distributions are recorded as capital gain distributions from investment companies, and short-term capital gain distributions are recorded as dividend income.
EXPENSES
Expenses incurred by the Trust that do not relate to a specific fund of the Trust are allocated to the individual Fund based on each Fund’s relative net assets or by another appropriate method.
3.) SECURITIES VALUATIONS
The Funds utilize various methods to measure the fair value of their investments on a recurring basis. GAAP establishes a hierarchy that prioritizes inputs to valuation methods. The three levels of inputs are:
Level 1 - Unadjusted quoted prices in active markets for identical assets or liabilities that the Funds have the ability to access.
Level 2 - Observable inputs other than quoted prices included in active markets included in level 1 that are observable for the asset or liability, either directly or indirectly. These inputs may include quoted prices for the identical instrument on an inactive market, prices for similar instruments, interest rates, prepayment speeds, credit risk, yield curves, default rates and similar data.
Level 3 - Unobservable inputs for the asset or liability, to the extent relevant observable inputs are not available, representing the Funds’ own assumptions about the assumptions a market participant would use in valuing the asset or liability, and would be based on the best information available.
The availability of observable inputs can vary from security to security and is affected by a wide variety of factors, including, for example, the type of security, whether the security is new and not yet established in the marketplace, the liquidity of markets, and other characteristics particular to the security. To the extent that valuation is based on models or inputs that are less observable or unobservable in the market, the determination of fair value requires more judgment. Accordingly, the degree of judgment exercised in determining fair value is greatest for instruments categorized in level 3.
The inputs used to measure fair value may fall into different levels of the fair value hierarchy. In such cases, for disclosure purposes, the level in the fair value hierarchy within which the fair value measurement falls in its entirety, is determined based on the lowest level input that is significant to the fair value measurement in its entirety.
VALUATION OF FUND ASSETS
A description of the valuation techniques applied to the Funds’ major categories of assets measured at fair value on a recurring basis follows.
Equity securities (exchange traded funds). Equity securities generally are valued by using market quotations, but may be valued on the basis of prices furnished by a pricing service when the Valuation Designee believes such prices accurately reflect the fair value of such securities. Securities that are traded on any stock exchange or on the NASDAQ over-the-counter market are generally valued by the pricing service at the last quoted sale price. Lacking a last sale price, an equity security is generally valued by the pricing service at its last bid price. Generally, if the security is traded in an active market and is valued at the last sale price, the security is categorized as a level 1 security, and if an equity security is valued by the pricing service at its last bid, it is generally categorized as a level 2 security. When market quotations are not readily available, when the Valuation Designee determines that the market quotation or the price provided by the pricing service does not accurately reflect the current fair value, or when restricted securities are being val-
2023 Semi-Annual Report 21
Notes to Financial Statements (Unaudited) - continued
ued, such securities are valued as determined in good faith by the valuation committee, which includes the Valuation Designee, subject to review of the Board of Trustees (the “Trustees” or the “Board”) and are categorized in level 2 or level 3, when appropriate.
Mutual funds. Mutual funds are valued at the net asset value as reported by the underlying fund and are classified in level 1 of the fair value hierarchy. The underlying mutual funds value securities in their portfolios for which market quotations are readily available at their market values (generally the last reported sale price) and all other securities and assets at their fair value by the methods established by the boards of the underlying funds. In the event a mutual fund does not report its net asset value, the Fund will value such an asset using its fair value procedures which incorporate, among other information, price changes from reference indexes or reference funds to assist in the valuation of a non-reporting mutual fund.
Money market funds. Money market funds are valued at net asset value provided by the funds and are classified in level 1 of the fair value hierarchy.
In accordance with the Trust’s good faith pricing guidelines, the Valuation Designee is required to consider all appropriate factors relevant to the value of securities for which it has determined other pricing sources are not available or reliable as described above. There is no standard procedure for determining fair value, since fair value depends upon the circumstances of each individual case. As a general principle, the current fair value of an issue of securities being valued by the Valuation Designee would appear to be the amount which the owner might reasonably expect to receive for them upon their current sale. Methods which are in accordance with this principle may, for example, be based on (i) a multiple of earnings; (ii) a discount from market of a similar freely traded security (including a derivative security or a basket of securities traded on other markets, exchanges or among dealers); or (iii) yield to maturity with respect to debt issues, or a combination of these and other methods. The Board maintains responsibilities for the fair value determinations under Rule 2a-5 under the 1940 Act and oversees the Valuation Designee.
The following tables summarize the inputs used to value each Fund’s assets measured at fair value as of December 31, 2023:
| Defensive Bull Fund: | ||||||
| Valuation Inputs of Assets | Level 1 | Level 2 | Level 3 | Total | ||
| Exchange Traded Funds | $905,959,806 | $ – | $ – | $905,959,806 | ||
| Money Market Funds | 28,988,586 | – | – | 28,988,586 | ||
| Total | $934,948,392 | $ – | $ – | $934,948,392 | ||
| Managed Volatility Fund: | ||||||
| Valuation Inputs of Assets | Level 1 | Level 2 | Level 3 | Total | ||
| Mutual Funds | $135,860,879 | $ – | $ – | $135,860,879 | ||
| Money Market Funds | 4,457,506 | – | -- | 4,457,506 | ||
| Total | $140,318,385 | $ – | $ – | $140,318,385 | ||
| Tactical Opportunities Fund: | ||||||
| Valuation Inputs of Assets | Level 1 | Level 2 | Level 3 | Total | ||
| Exchange Traded Funds | $86,467,187 | $ – | $ – | $86,467,187 | ||
| Money Market Funds | 2,145,524 | – | – | 2,145,524 | ||
| Total | $88,612,711 | $ – | $ – | $88,612,711 | ||
| Tactical Rotation Fund: | ||||||
| Valuation Inputs of Assets | Level 1 | Level 2 | Level 3 | Total | ||
| Exchange Traded Funds | $117,607,393 | $ – | $ – | $117,607,393 | ||
| Money Market Funds | 3,420,068 | – | – | 3,420,068 | ||
| Total | $121,027,461 | $ – | $ – | $121,027,461 | ||
The Funds did not hold any level 3 assets during the six month period ended December 31, 2023.
The Funds did not invest in derivative instruments during the six month period ended December 31, 2023.
4.) INVESTMENT ADVISORY AGREEMENT AND SERVICES AGREEMENT
The Funds have entered into an investment advisory agreement (“Management Agreement”) with the Advisor. The Advisor manages the investment portfolio of each Fund, subject to the policies adopted by the Trust’s Board of Trustees. Under the Management Agreement, the Advisor, at its own expense and without reimbursement from the Trust, furnishes office space and all necessary office facilities, equipment and executive personnel necessary for managing the assets of each Fund. The Advisor receives an investment management fee equal to 1.25% of each Fund’s average daily net assets up to $100 million, 1.00% of each
2023 Semi-Annual Report 22
Notes to Financial Statements (Unaudited) - continued
Fund’s average daily net assets between $100 million and $200 million and 0.90% of each Fund’s average daily net assets in excess of $200 million.
For the six month period ended December 31, 2023, the Advisor earned management fees in the amounts of $3,717,604, $631,401, $632,088 and $643,665 for the Defensive Bull Fund, Managed Volatility Fund, Tactical Opportunities Fund and Tactical Rotation Fund, respectively. At December 31, 2023, $699,904, $135,598, $89,682 and $118,881 was due to the Advisor from Defensive Bull Fund, Managed Volatility Fund, Tactical Opportunities Fund and Tactical Rotation Fund, respectively.
Additionally, the Funds have a Services Agreement with the Advisor (the “Services Agreement”). Effective October 3, 2023, under the Services Agreement the Advisor receives an additional fee of 0.50% of a Fund’s average daily net assets up to $25 million, and 0.20% of such assets in excess of $25 million for services provided under the agreement and is also obligated to pay the operating expenses of a Fund excluding management fees, brokerage fees and commissions, 12b-1 fees (if any), taxes, borrowing costs (such as (a) interest and (b) dividend expenses on securities sold short), ADR fees, the cost of acquired funds and extraordinary expenses. From November 1, 2021 through October 2, 2023, under the Services Agreement the Advisor received a service fee of 0.50% of each Fund's average daily net assets up to $25 million, 0.20% of each Fund's average daily net assets from $25 million to $100 million, and 0.10% of such assets in excess of $100 million and is obligated to pay the operating expenses of each Fund excluding management fees, brokerage fees and commissions, 12b-1 fees (if any), taxes, borrowing costs (such as (a) interest and (b) dividend expenses on securities sold short), ADR fees, the cost of acquired funds and extraordinary expenses. Prior to November 1, 2021, under the Services Agreement the Advisor received a service fee of 0.65% of each Fund's average daily net assets up to $25 million, 0.35% of each Fund's average daily net assets from $25 million to $100 million, and 0.25% of such assets in excess of $100 million and was obligated to pay the operating expenses of each Fund excluding management fees, brokerage fees and commissions, 12b-1 fees (if any), taxes, borrowing costs (such as (a) interest and (b) dividend expenses on securities sold short), ADR fees, the cost of acquired funds and extraordinary expenses. Additionally, under the Services Agreement the Advisor supervises each Fund's business affairs. The Advisor coordinates for the provision of the services of a Chief Compliance Officer for the Trust with respect to each Fund, executive and administrative services including, but are not limited to, the coordination of all third parties furnishing services to each Fund, review of the books and records of each Fund maintained by such third parties, and such other actions with respect to each Fund as may be necessary in the opinion of the Advisor to perform its duties under the Services Agreement.
For the six month period ended December 31, 2023, the Advisor earned services fees of $651,268, $141,260, $136,815 and $141,544 from Defensive Bull Fund, Managed Volatility Fund, Tactical Opportunities Fund and Tactical Rotation Fund, respectively. At December 31, 2023, $153,417, $29,237, $20,702 and $25,894 was due to the Advisor from Defensive Bull Fund, Managed Volatility Fund, Tactical Opportunities Fund and Tactical Rotation Fund, respectively.
5.) RELATED PARTY TRANSACTIONS
Certain officers and a Trustee of the Trust are also officers of Premier Fund Solutions, Inc. (the “Administrator”). These individuals receive benefits from the Administrator resulting from administration fees paid to the Administrator of the Funds by the Adviser.
The Trustees who are not interested persons of the Funds were each paid $3,000, for a total of $12,000, in Trustees fees for the six month period ended December 31, 2023. Under the Services Agreement, the Advisor pays these fees.
6.) INVESTMENTS
For the six month period ended December 31, 2023, purchases and sales of investment securities other than U.S. Government obligations and short-term investments were as follows:
| Defensive | Managed | Tactical | Tactical | |||||
| Bull Fund | Volatility Fund | Opportunities Fund | Rotation Fund | |||||
| Purchases | $4,498,294,465 | $238,070,326 | $ 625,526,127 | $391,623,367 | ||||
| Sales | $4,174,537,858 | $175,890,209 | $630,914,428 | $359,475,801 |
There were no purchases or sales of U.S. Government obligations.
7.) CONTROL OWNERSHIP
The beneficial ownership, either directly or indirectly, of more than 25% of the voting shares of a fund creates a presumption of control of the fund, under section 2(a)(9) of the 1940 Act. As of December 31, 2023, National Financial Services, LLC (“NFS”), located in New York, New York, and Charles Schwab, located in San Francisco, California, each held for the benefit of its customers, accounts in excess of 25% of the voting
2023 Semi-Annual Report 23
Notes to Financial Statements (Unaudited) - continued shares of each fund noted below. The Funds do not know whether any underlying accounts of NFS or Charles Schwab, owned or controlled 25% or more of the voting securities of each Fund.
| Charles Schwab | NFS | |||
| Defensive Bull Fund | 45.48% | – ** | ||
| Managed Volatility Fund | 42.38% | – ** | ||
| Tactical Opportunities Fund | 34.72% | 26.43% | ||
| Tactical Rotation Fund | 42.75% | 27.11% | ||
| ** Balance under 25% as of December 31, 2023. | ||||
8.) TAX MATTERS
For federal income tax purposes, at December 31, 2023 the cost of securities on a tax basis and the composition of gross unrealized appreciation (the excess of value over tax cost) and depreciation (the excess of tax cost over value) were as follows:
| Defensive | Managed | Tactical | Tactical | |||||||||
| Bull Fund | Volatility Fund | Opportunities Fund | Rotation Fund | |||||||||
| Cost of Investments | $878,014,739 | $134,885,533 | $86,018,246 | $115,909,824 | ||||||||
| Gross Unrealized Appreciation | $56,963,028 | $5,550,710 | $2,823,880 | $5,343,440 | ||||||||
| Gross Unrealized Depreciation | (29,375 | ) | (117,858 | ) | (229,415 | ) | (225,803 | ) | ||||
| Net Unrealized Appreciation | ||||||||||||
| (Depreciation) on Investments | $56,933,653 | $5,432,852 | $2,594,465 | $5,117,637 | ||||||||
As of December 31, 2023, there were no differences between book and tax basis unrealized appreciation.
The tax character of distributions paid during the six month period ended December 31, 2023 and the fiscal year ended June 30, 2023 were as follows:
| Six Months Ended | Fiscal Year Ended | |||||
| December 31, 2023 | June 30, 2023 | |||||
| Defensive Bull Fund | ||||||
| Ordinary Income | $ | 72,611,422 | $ | 549,021 | ||
| Long-term Capital Gain | – | – | ||||
| $ | 72,611,422 | $ | 549,021 | |||
| Managed Volatility Fund | ||||||
| Ordinary Income | $ | 2,611,518 | $ | 328,375 | ||
| Tax-Exempt Income | 568,875 | 71,321 | ||||
| Long-term Capital Gain | – | – | ||||
| $ | 3,180,393 | $ | 399,696 | |||
| Tactical Opportunities Fund | ||||||
| Ordinary Income | $ | 615,611 | $ | – | ||
| Long-term Capital Gain | – | – | ||||
| $ | 615,611 | $ | – | |||
| Tactical Rotation Fund | ||||||
| Ordinary Income | $ | 1,154,589 | $ | 81,288 | ||
| Long-term Capital Gain | – | – | ||||
| $ | 1,154,589 | $ | 81,288 | |||
9.) LEVERAGED ETF RISKS
The Funds may invest in leveraged Exchange Traded Funds (“ETFs”). The net asset value and market price of leveraged ETFs are usually more volatile than the value of the tracked index or of other ETFs that do not use leverage. Inverse and leveraged ETFs use investment techniques and financial instruments that may be considered aggressive, including the use of derivative transactions. Most leveraged ETFs are designed to achieve their stated objectives on a daily basis. Their performance over long periods of time can differ significantly from the performance of the underlying index during the same period of time. This effect can be magnified in volatile markets.
2023 Semi-Annual Report 24
Notes to Financial Statements (Unaudited) - continued
10.) AFFILIATED ISSUER TRANSCTIONS
When a Fund holds more than 5% of the outstanding shares of an investment, that investment is consider to be an affiliated investment of the Fund. During the six month period ended December 31, 2023, Defensive Bull Fund had the following transactions with affiliated companies:
| Direxion Daily S&P | |||
| 500 3X Bull Shares | |||
| Security Name | ETF | ||
| Value as of June 30, 2023 | $ | 215,078,294 | |
| Purchases | 1,219,686,108 | ||
| Sales | (1,147,806,416 | ) | |
| Change in Unrealized Gain (Loss) | 17,401,493 | ||
| Realized Gain (Loss) | (50,850,889 | ) | |
| Value as of December 31, 2023 | $ | 253,508,590 | |
| Shares Balance as of December 31, 2023 | 2,437,817 | ||
| Dividends | $ | 1,320,378 | |
| Capital Gain Distributions | $ | - |
There were no affiliated investment transactions in Managed Volatility Fund, Tactical Opportunities Fund, or Tactical Rotation Fund during the six month period ended December 31, 2023.
11.) CONTINGENCIES AND COMMITMENTS
The Trust indemnifies its officers and the Board for certain liabilities that may arise from the performance of their duties to the Trust. Additionally, in the normal course of business, each Fund enters into contracts that contain a variety of representations and warranties and which provide general indemnities. Each Fund’s maximum exposure under these arrangements is unknown, as this would involve future claims that may be made against a Fund that have not yet occurred. However, based on experience, the risk of loss due to these warranties and indemnities appears to be remote.
12.) SUBSEQUENT EVENTS
Subsequent events after the date of the Statements of Assets and Liabilities have been evaluated through the date the financial statements were issued. Management has concluded that there is no impact requiring adjustment to or disclosure in the financial statements.
2023 Semi-Annual Report 25
| DISCLOSURE OF EXPENSES (Unaudited) |
The ongoing costs to shareholders associated with the Defensive Bull Fund, Managed Volatility Fund, Tactical Opportunities Fund and Tactical Rotation Fund consist solely of management fees and service fees. Although the Funds charge no sales loads or transaction fees, you will be assessed fees for outgoing wire transfers, returned checks and stop payment orders at prevailing rates charged by Mutual Shareholder Services, LLC, the Funds’ transfer agent. IRA accounts will be charged an $8.00 annual maintenance fee. Additionally, your account will be indirectly subject to the expenses of any underlying funds. The following example is intended to help you understand your ongoing costs of investing in the Funds and to compare these costs with similar costs of investing in other mutual funds. The example is based on an investment of $1,000 invested in the Funds on July 1, 2023, and held through December 31, 2023.
The first line of each table below provides information about actual account values and actual expenses. In order to estimate the expenses a shareholder paid during the period covered by this report, shareholders can divide their account value by $1,000 (for example, an $8,600 account value divided by $1,000 = 8.6) and then multiply the result by the number in the first line under the heading entitled “Expenses Paid During the Period.”
The second line of each table below provides information about hypothetical account values and hypothetical expenses based on the Funds’ actual expense ratios and an assumed rate of return of 5% per year before expenses, which is not the Funds’ actual return. The hypothetical account values and expenses may not be used to estimate the actual ending account balance or expenses paid by a shareholder for the period. Shareholders may use this information to compare the ongoing costs of investing in the Funds and other funds. In order to do so, compare these 5% hypothetical examples with the 5% hypothetical examples that appear in other funds’ shareholder reports.
Please note that the expenses shown in each table are meant to highlight your ongoing costs only and do not reflect any transactional costs, such as the annual maintenance fee charged to IRA accounts, the charges assessed by Mutual Shareholder Services, LLC as described above and expenses of any underlying funds. Therefore, the second line of the table is useful in comparing ongoing costs only, and will not help you determine the relative total costs of owning different funds. In addition, if these transactional costs were included, your costs would have been higher.
| DEFENSIVE BULL FUND | ||||||
| Expenses Paid | ||||||
| Beginning | Ending | During the Period* | ||||
| Account Value | Account Value | July 1, 2023 to | ||||
| July 1, 2023 | December 31, 2023 | December 31, 2023 | ||||
| Actual | $1,000.00 | $943.02 | $5.52 | |||
| Hypothetical | $1,000.00 | $1,019.46 | $5.74 | |||
| (5% annual return | ||||||
| before expenses) | ||||||
| * Expenses are equal to the Fund’s annualized expense ratio of 1.13%, multiplied by the average account value over the period, multiplied by 184/366 (to reflect the one-half year period). |
| MANAGED VOLATILITY FUND | ||||||
| Expenses Paid | ||||||
| Beginning | Ending | During the Period* | ||||
| Account Value | Account Value | July 1, 2023 to | ||||
| July 1, 2023 | December 31, 2023 | December 31, 2023 | ||||
| Actual | $ | 1,000.00 | $1,044.32 | $7.71 | ||
| Hypothetical | $ | 1,000.00 | $1,017.60 | $7.61 | ||
| (5% annual return | ||||||
| before expenses) | ||||||
| * Expenses are equal to the Fund’s annualized expense ratio of 1.50%, multiplied by the average account value over the period, multiplied by 184/366 (to reflect the one-half year period). |
2023 Semi-Annual Report 26
| Disclosure of Expenses (Unaudited) - continued | ||||||
| TACTICAL OPPORTUNITIES FUND | ||||||
| Expenses Paid | ||||||
| Beginning | Ending | During the Period* | ||||
| Account Value | Account Value | July 1, 2023 to | ||||
| July 1, 2023 | December 31, 2023 | December 31, 2023 | ||||
| Actual | $1,000.00 | $955.65 | $7.32 | |||
| Hypothetical | $1,000.00 | $1,017.65 | $7.56 | |||
| (5% annual return | ||||||
| before expenses) | ||||||
| * Expenses are equal to the Fund’s annualized expense ratio of 1.49%, multiplied by the average account value over the period, multiplied by 184/366 (to reflect the one-half year period). |
| TACTICAL ROTATION FUND | ||||||
| Expenses Paid | ||||||
| Beginning | Ending | During the Period* | ||||
| Account Value | Account Value | July 1, 2023 to | ||||
| July 1, 2023 | December 31, 2023 | December 31, 2023 | ||||
| Actual | $1,000.00 | $982.55 | $7.53 | |||
| Hypothetical | $1,000.00 | $1,017.55 | $7.66 | |||
| (5% annual return | ||||||
| before expenses) | ||||||
| * Expenses are equal to the Fund’s annualized expense ratio of 1.51%, multiplied by the average account value over the period, multiplied by 184/366 (to reflect the one-half year period). |
2023 Semi-Annual Report 27
ADDITIONAL INFORMATION
December 31, 2023
(Unaudited)
AVAILABILITY OF QUARTERLY SCHEDULE OF INVESTMENTS
The Funds publicly file their complete schedules of portfolio holdings with the Securities and Exchange Commission (“SEC”) for the first and third quarters of each fiscal year on Form N-PORT. The Funds’ Forms N-PORT are available on the SEC’s website at http://www.sec.gov.
| PROXY VOTING GUIDELINES |
Potomac Fund Management, Inc., the Funds’ Advisor, is responsible for exercising the voting rights associated with the securities held by the Funds. A description of the policies and procedures used by the Advisor in fulfilling this responsibility is available without charge on the Funds’ website at www.potomacfund.com/funds. It is also included in the Funds’ Statement of Additional Information, which is available on the SEC’s website at http://www.sec.gov.
Form N-PX provides information regarding how the Funds voted proxies with regards to portfolio securities held during the most recent 12-month period ended June 30th and is available without charge, upon request, by calling our toll free number (1-888-774-6679). This information is also available on the SEC’s website at http://www.sec.gov.
| ADDITIONAL INFORMATION |
You will find more information about the Funds at www.potomacfund.com/funds. For shareholder inquiries, please call toll-free in the U.S. at 1-888-774-6679.
LIQUIDITY RISK MANAGEMENT PROGRAM
During the six month period ended December 31, 2023, the Board reviewed the Funds’ liquidity risk management program, adopted pursuant to Rule 22e-4 under the 1940 Act. The program is overseen by the Advisor, who has delegated certain responsibilities for managing the program to a liquidity program administrator (the “LPA”). The LPA reported that it had assessed, managed and reviewed the program for the Funds taking into consideration several factors including the liquidity of each Fund’s portfolio investments and the market, trading or investment specific considerations that may reasonably affect a security’s classification as a liquid investment. The LPA certified that the program was adequate, effectively implemented and needed no changes at that time.
2023 Semi-Annual Report 28
This page was intentionally left blank.
2023 Semi-Annual Report 29
Investment Advisor
|
| This report is provided for the general information of the shareholders of the Conquer Risk Funds. This report is not intended for distribution to prospective investors in the Funds, unless preceded or accompanied by an effective prospectus. |
Conquer Risk Funds
1-888-774-6679
www.potomacfund.com/funds/
(b) Not applicable.
Item 2. Code of Ethics. Not applicable.
Item 3. Audit Committee Financial Expert. Not applicable.
Item 4. Principal Accountant Fees and Services. Not applicable.
Item 5. Audit Committee of Listed Companies. Not applicable.
Item 6. Investments.
(a) Not applicable. Schedule filed with Item 1.
(b) Not applicable.
Item 7. Disclosure of Proxy Voting Policies and Procedures for Closed-End Management Investment Companies. Not applicable.
Item 8. Portfolio Managers of Closed End Management Investment Companies. Not applicable.
Item 9. Purchases of Equity Securities by Closed-End Management Investment Companies and Affiliated Purchasers. Not applicable.
Item 10. Submission of Matters to a Vote of Security Holders.
The registrant has not adopted procedures by which shareholders may recommend nominees to the registrant’s board of trustees.
Item 11. Controls and Procedures.
(a) The Registrant’s president and chief financial officer concluded that the disclosure controls and procedures (as defined in Rule 30a-3(c) under the Act (17 CFR 270.30a -3(c))) as of a date within 90 days of the filing date of the report that includes the disclosure required by this paragraph, based on the evaluation of these controls and procedures required by Rule 30a-3(b) under the Act (17 CFR 270.30a -3(b)) and Rules 13a-15(b) or 15d-15(b) under the Exchange Act (17 CFR 240.13a -15(b) or 240.15d -15(b)).
(b) There were no changes in the registrant’s internal control over financial reporting (as defined in Rule 30a-3(d) under the Act (17 CFR 270.30a -3(d)) that occurred during the period covered by this report that has materially affected, or is reasonably likely to materially affect, the registrant’s internal control over financial reporting.
Item 12. Disclosure of Securities Lending Activities for Closed-End Management Investment Companies.
Not applicable.
Item 13. Exhibits.
(a)(1) Code of Ethics. Not applicable.
(a)(2) Certifications pursuant to Section 302 of the Sarbanes-Oxley Act of 2002. Filed herewith.
(a)(3) Not applicable.
(a)(4) Not applicable.
(b) Certification pursuant toSection 906 of teh Sarbanes-Oxley Act of 2002. Filed herewith.
| SIGNATURES |
Pursuant to the requirements of the Securities Exchange Act of 1934 and the Investment Company Act of 1940, the registrant has duly caused this report to be signed on its behalf by the undersigned, thereunto duly authorized.
| PFS Funds |
| By: /s/James Craft James Craft President |
| Date: 2/28/2024 |
Pursuant to the requirements of the Securities Exchange Act of 1934 and the Investment Company Act of 1940, this report has been signed below by the following persons on behalf of the registrant and in the capacities and on the dates indicated.
| By: /s/James Craft James Craft President |
| Date: 2/28/2024 |
By: /s/Jeffrey R. Provence |
| Date: 2/28/2024 |