
DOE Energy Storage Systems Research
Program Annual Peer Review
Jim Arseneaux
Director-Flywheel Projects
Beacon Power Corporation
Flywheel-based Frequency Regulation Demonstration
Projects for CEC, NYSERDA, & DOE
Imre Gyuk
Program Manager
Energy Storage Research
Department of Energy
Garth Corey
Principal Member of Technical Staff
Energy Storage System Program
Sandia National Laboratories
November 2-3
Washington, DC
Georgianne Peek
Project Manager
Energy Infrastructure & DE
Resources
Sandia National Laboratories
Mike Gravely
Program Manager
CEC
Joe Sayer
Program Manager
NYSERDA

Contents
Project Background:
Objectives of the Demonstration Projects
Project Teams
System Operation
System Hardware
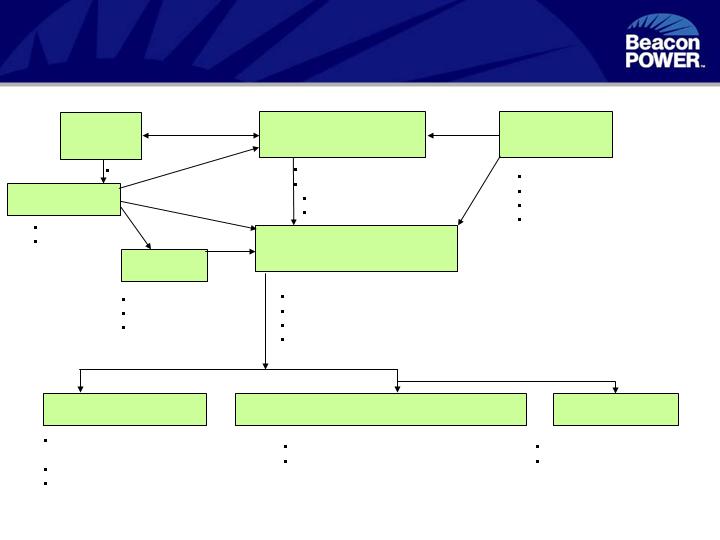
Demo Schematic
Communication and Control Schematics
User Interfaces
Test Results:
Initial Acceptance Test
System Response Time
Slam Test
Typical Daily Response to Signals
Daily Performance Summary
Monthly Performance Summary
Reactive Power Response
Summary of Test Results
Status vs. Objectives
Flywheel Product Development Status
Other Applications for Flywheel Technology

Objectives of Demonstration Projects
Proof of concept on ~1/10th power scale
Show ability to follow fast-changing frequency regulation
signals
Demonstrate anti-islanding
Validate interconnection capability
(NYSERDA on end of line - CEC at substation)
Demonstrate performance and economic value
Develop and demonstrate communications with grid operators
Demonstrate reactive power compensation (NYSERDA only)
Collect data for product specifications
Gain industry confidence
Report results to the industry

CEC
CAISO
DUIT
Program
Connected Energy
PG&E
ISO procedures
AGC signal requirements
System Impacts / Benefits
Dave Hawkins
Yuri Makarov
Funding Source – Pramod Kulkarni
Mike Gravely
Data requirements
Garth Corey
Manage Test Site
Integrate with PG&E
Susan Horgan
Host Utility
Prime Contractor / Oversight
FESS System Integration
Control Development
Project Leader - Jim Arseneaux
Contract Officer – Larry Schmidt
Sandia Labs
Integrate Low Cost Dispatch System with CAISO
Supply Dispatch Control Hardware
Thomas Yeh
Data Analysis
Doug Dorr
EPRI Solutions
Economic Analysis
Jim Eyer
Beacon Power
DUA
Imre Gyuk
DOE
DUA
CEC Project Team
NYSERDA
NYISO
Connected Energy
National Grid
ISO procedures
AGC signal requirements
System Impacts / Benefits
Dave Lawrence
Funding Source – Joe Sayer
Advisory Board:
Jim Harvilla NYSEG
Pat Maher NYS PSC
Data requirements
Georgianne Peek
Manage Test Site
Jerry Meehan
Niagara Mohawk – local utility
John Bzura
Prime Contractor / Oversight
FESS System Integration
Control Development
Project Leader - Jim Arseneaux
Sandia Labs
Integrate Low Cost Dispatch
System with NYISO
Supply Dispatch Control Hardware
Steve Heinzelman
Data Analysis
Erich Gunther
Jeff Lameree
EnerNex
Beacon Power
Power & Composite Technologies
Imre Gyuk
DOE
NYSERDA Project Team
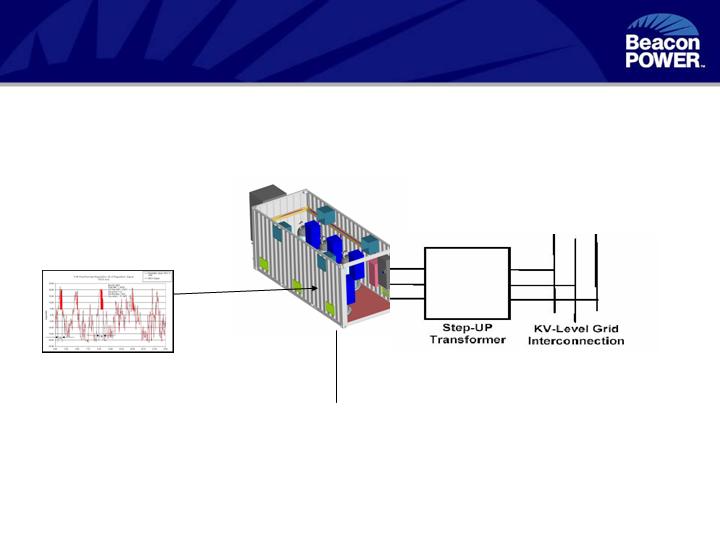
System Operation
Smart Energy Matrix (SEM)
Signal from
ISO
Injects or absorbs power to/from the grid
in accordance with ISO signal
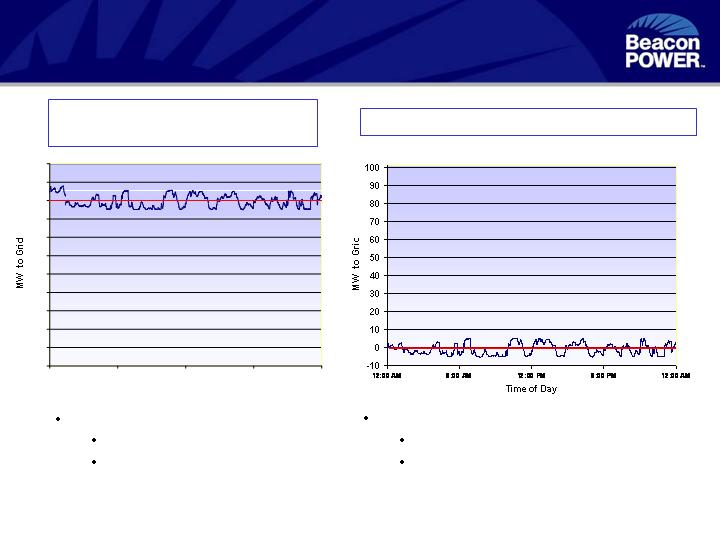
Regulation Using Generator vs. Energy Storage
100 MW Generator
Set at 90 MW with 5 MW Regulation
Energy Storage providing 5 MW of Regulation
Generator varies output
Decreases efficiency
Increases emissions
Flywheel recycles energy
High round trip efficiency
Zero emissions
0
10
20
30
40
50
60
70
80
90
100
110
12:00 AM
6:00 AM
12:00 PM
6:00 PM
12:00 AM
Time of Day
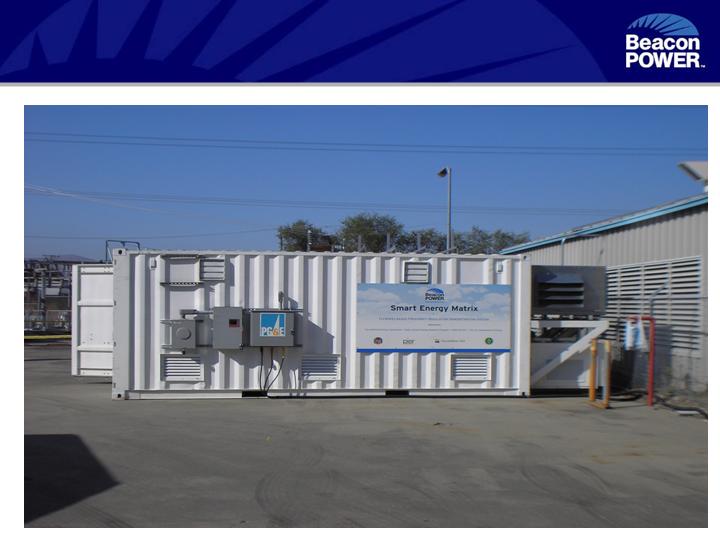
Outside View of System

Inside View of System
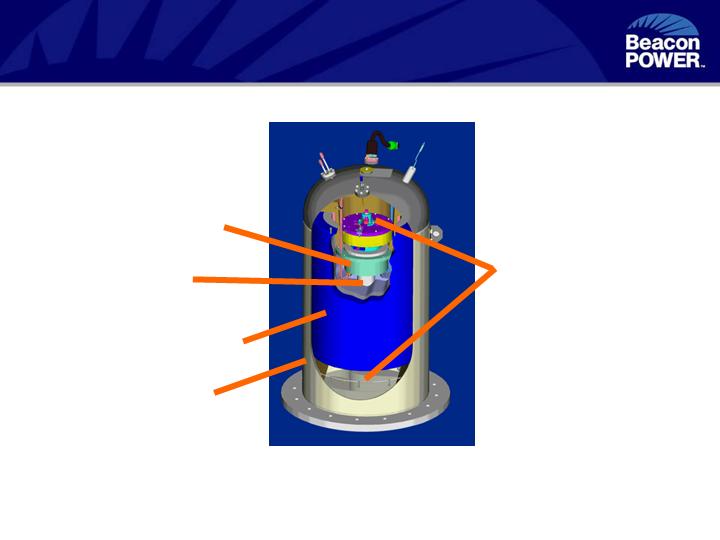
Advanced Flywheel Technology
Visit Electricity Storage Association Website
www.electricitystorage.org
Composite Rim
Magnetic
Bearings
Hub/Shaft
Vacuum
Housing
Motor/Generator
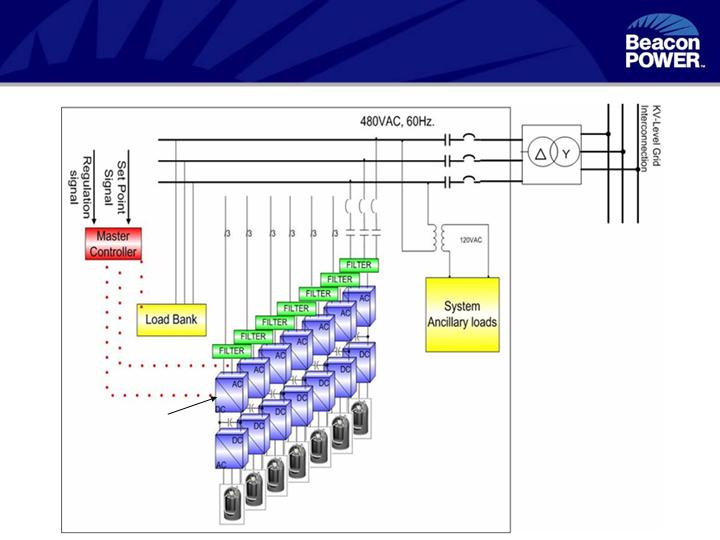
Demo Schematic
Flywheels
15 kW
Bi-directional
Inverters
-Chiller
-Power for M.C.
-Lights

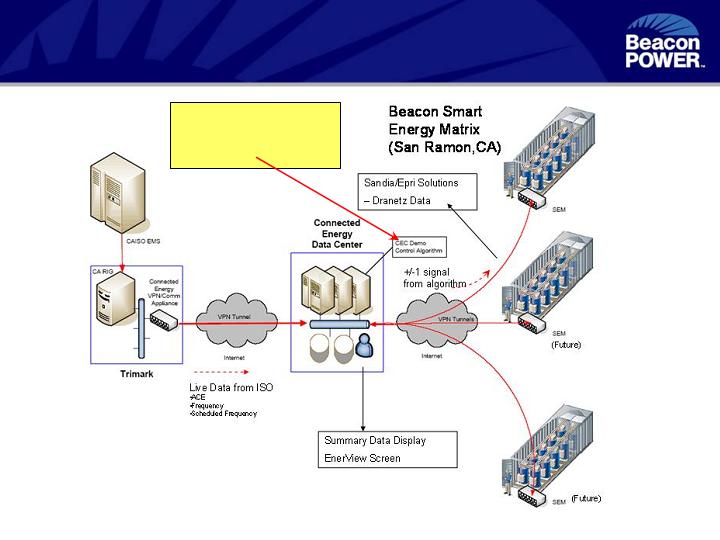
Data Communication Topology
TCP/IP
RS232
WCC
Router
Internet
Internet
Connected Energy
Data Center
VLAN
Connection
Sandia/EPRI-Solutions
User
User
Shark 100
Energy Meter
CAISO
Regulation signal
LabVIEW Traffic
Master Controller Linux access
Beacon
Master
Controller
Firewall
Dranetz High speed
DAS
Beckwith M-34210A
Protective Relay
Static I/P
Address 1
Static I/P
Address 2
Manual Shutoff
Main
Contactor
Connected Energy
Box
24 v
7 FW’s
Ethernet
Switch
DUIT
DAS
Summary
Data
Raw Flywheel
System Data
PG&E Network
Control Signal Schematic (CEC)
Control Algorithm
based on Yuri Makarov
Analysis

Regulation Signal Generated from Frequency
(NYSERDA)
Start
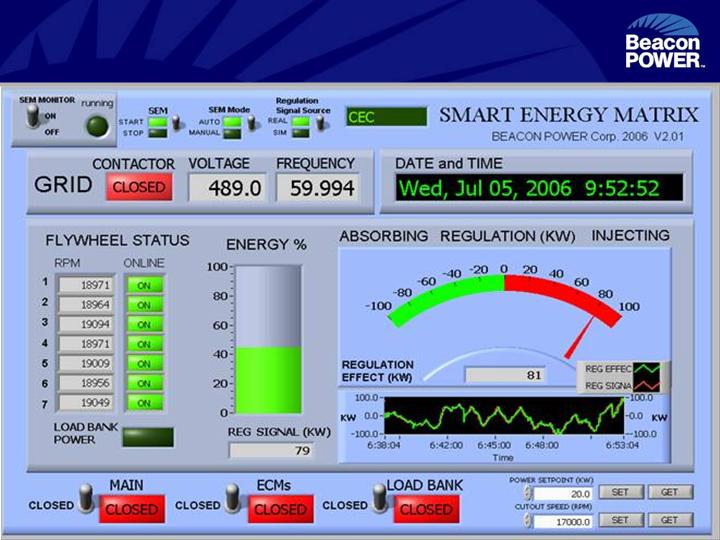
System Graphic User Interface
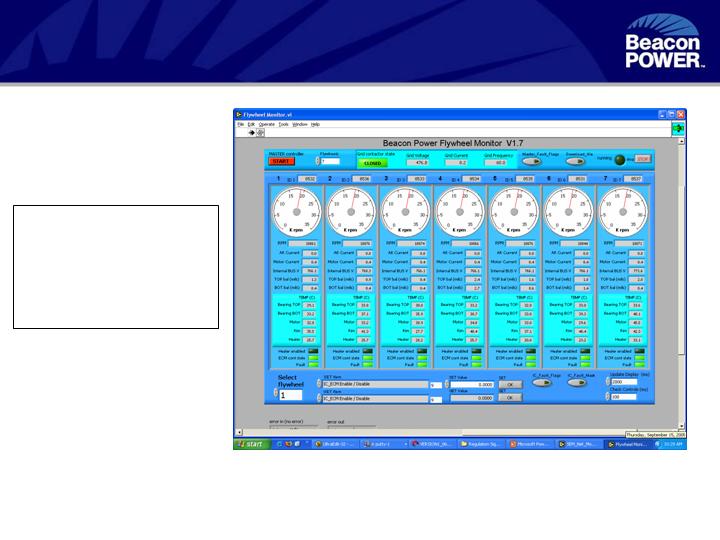
Flywheel Graphical User Interface
Remote Monitoring
and Control of
Flywheel and
System Parameters

Test Results
Initial Acceptance Test
System Response Time
Slam Test
Typical Daily Response to Signals
Daily Performance Summary
Monthly Performance Summary
Reactive Power Response
Summary of Test Results
Status vs. Objectives

Acceptance Test Data
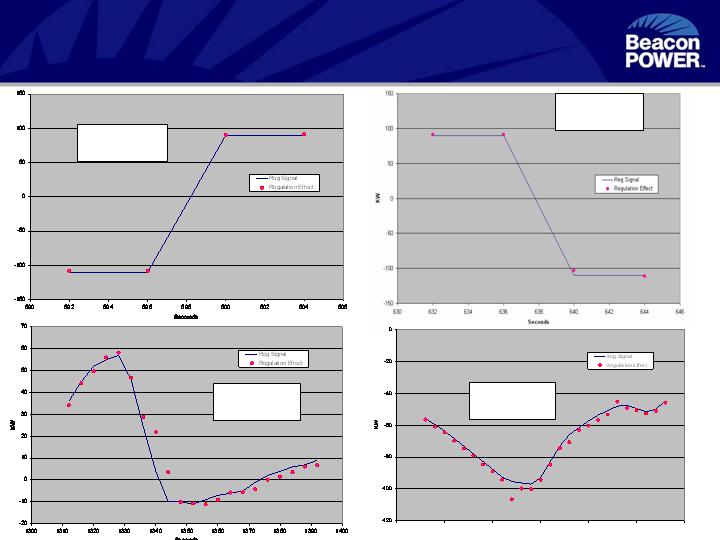
System Response Time
Time A
Time B
Time E
Time F
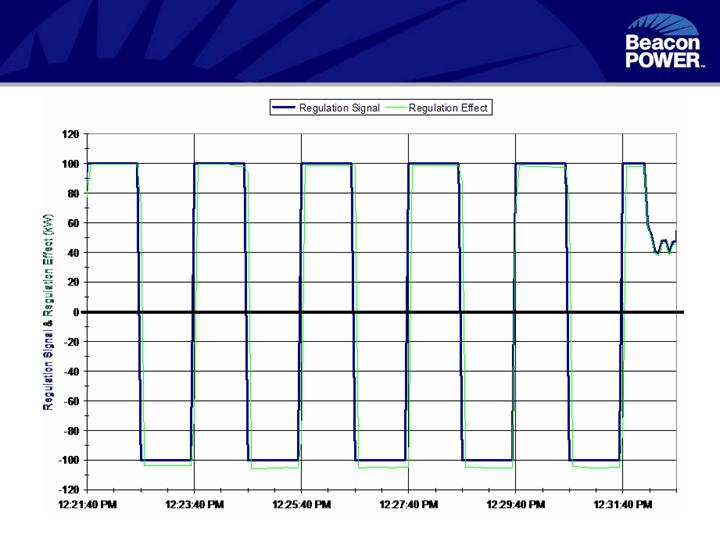
Results – Slam Test
Typical CEC Response
(August 2, 2006)
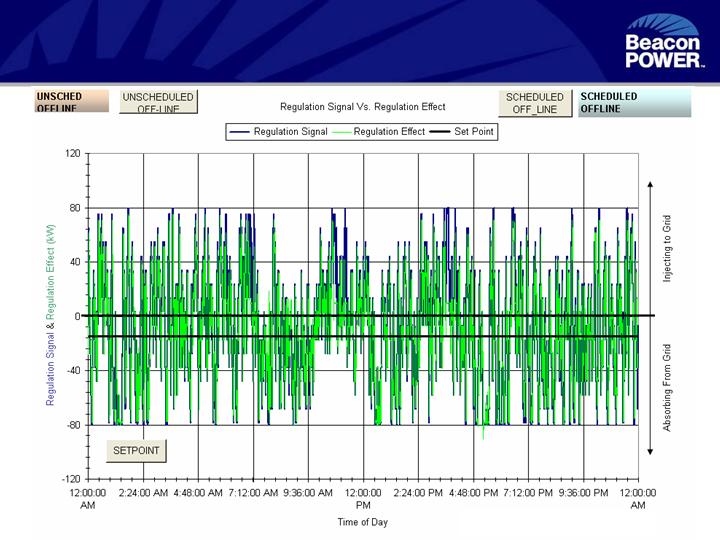
Typical NYSERDA Response
Sept 28, 2006
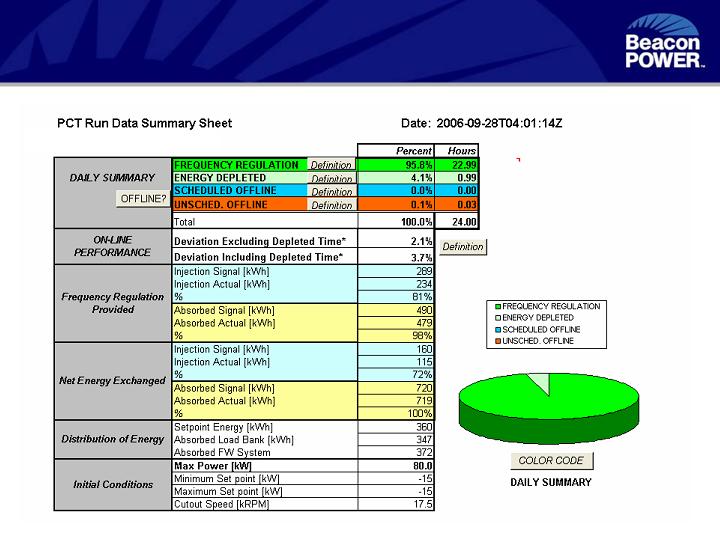
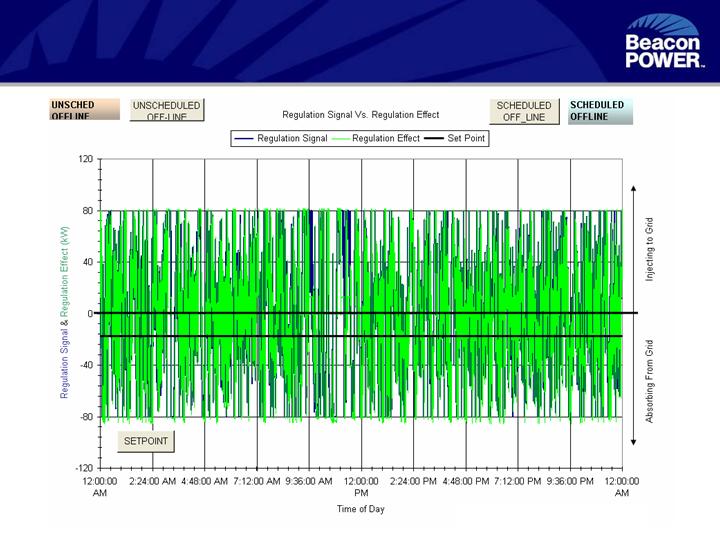
Daily Results – NYSERDA 9/28/06
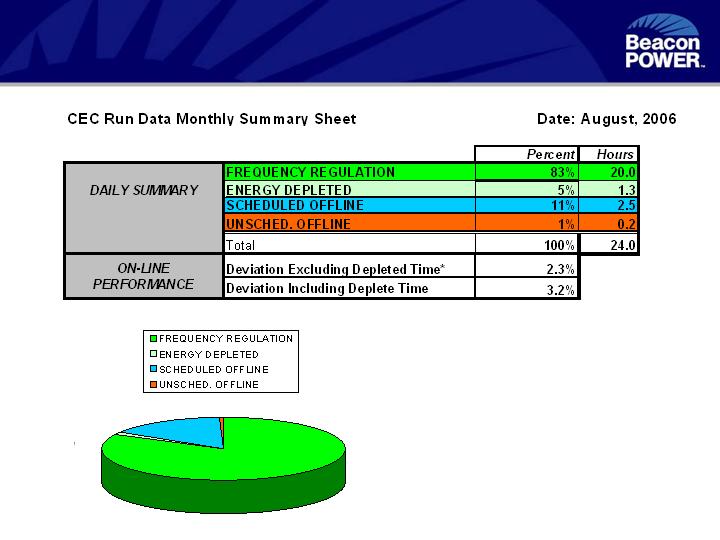
Monthly Performance Summary
(CEC - Aug 2006)
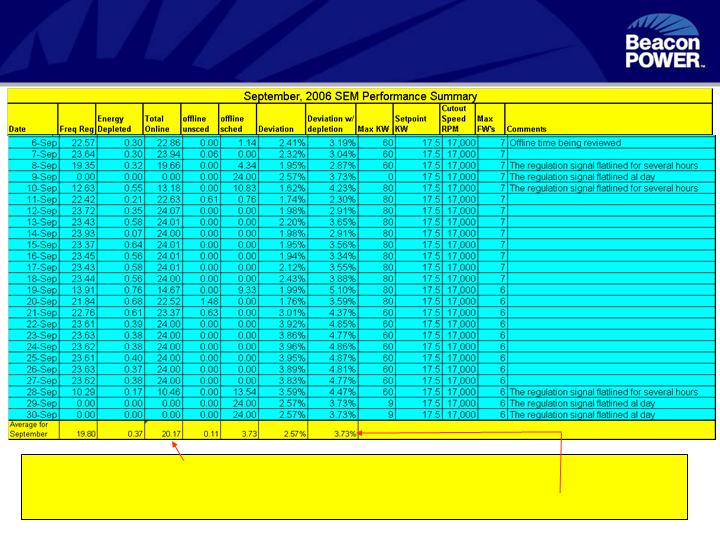
Monthly Performance Details
(CEC - Sept 2006)
System online 20+ hours per day. Majority (>90%) of offline time
is scheduled. Deviation from signal less than 4%.
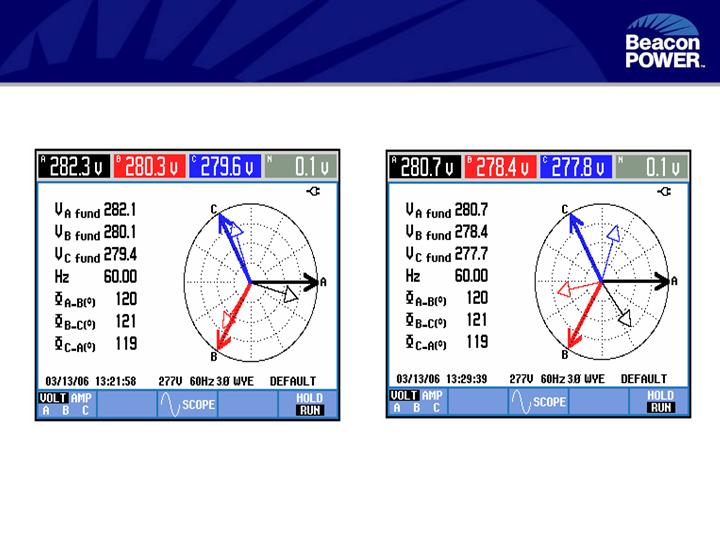
Reactive Power Response (NYSERDA)
Phasor diagram at 50KW with and without reactive power (inductive)
50KW charge, 50KVAR, PF= 0.472
50KW

Test Results Summary
System has been operating for over a year with only two scheduled system
shutdowns
Testing successfully characterizing flywheel response to fast acting
regulation signals
System reliability being validated
Startup / quality items encountered and being addresses as they occur
Flywheel reliability has been excellent with only two minors issues addressed on
site
Lessons from demo system being used to improve design and reliability of the
product system
No technical barriers identified to product introduction.
Final phase should focus on establishing a signal that can be used for
product introduction and identify associated economic value.
CEC system has been operating for over a year with only two scheduled
system shutdowns. NYSERDA since February also with two shutdowns.
Testing successfully characterizing flywheel response to fast-acting
regulation signals
System reliability being validated
Startup / quality issues encountered and addressed as they occur
Flywheel reliability has been excellent with two minor issues addressed on site
Lessons from demo systems being used to improve design and reliability of the
full-power system under development for 2007
No technical barriers to product introduction have been identified
Final phase should focus on establishing a signal that can be used for full-
power product introduction and identify associated economic value
Performance testing nearing completion. No technical barriers
identified. Lessons being incorporated in product design.

Data being collected and summarized. Lessons from demo
being reflected in the full-power system under development.
Collect data for product specifications
Site demonstrations to key stakeholders. Data being
distributed.
Report results - gain industry confidence
All communications systems working
Develop and demonstrate
communications with grid operators
System performance demonstrated. Economic value
analysis being worked with ISOs.
Demonstrate performance and economic
value
Connected to grid with no adverse impact
Validate interconnection capability
Complete - using standard Beckwith relay
Demonstrate anti-islanding
Response time of 4 seconds demonstrated (see data)
Show ability to follow fast-changing
frequency regulation signals
100kW demonstrated vs. 1 MW (or greater) product
Proof of concept on ~1/10th power scale
Status
Objective
Status vs. Objectives
Programs on schedule to meet all objectives
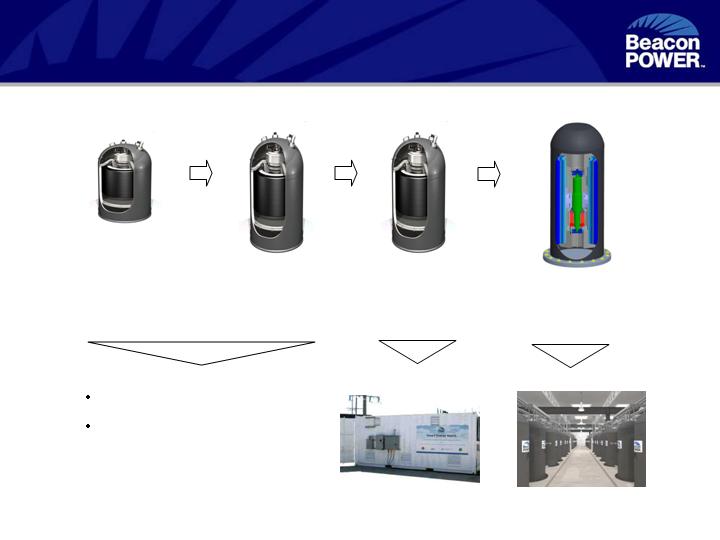
Beacon Flywheel Product Evolution
Gen 1
Telecom
2 kWh / 1 kW
2000
Gen 2
Telecom
6 kWh / 2 kW
2001
Telecom applications
Over 500,000 hours of
operation
Gen 3
Grid
6 kWh / 15 kW
2004
2005
100kW
demonstration unit
2007
1st MW operational in
commercial service
Gen 4
Grid
25 kWh / 100 kW
2006
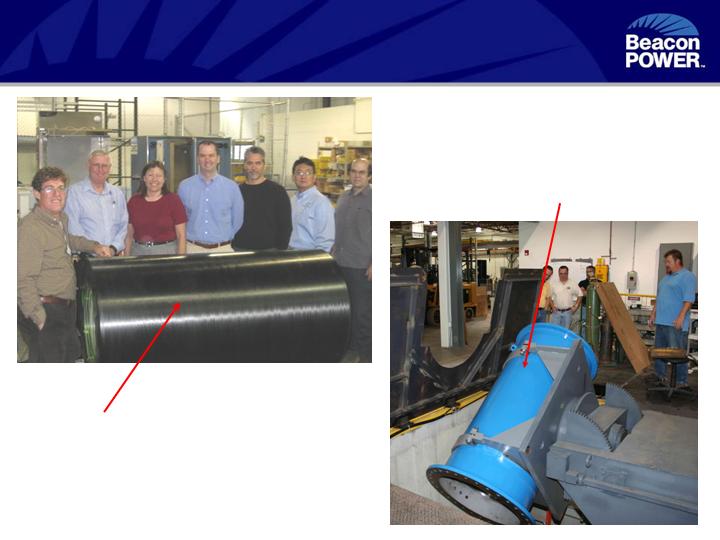
Gen 4 - 25kWh/100kW Flywheel Hardware
Rim
Housing
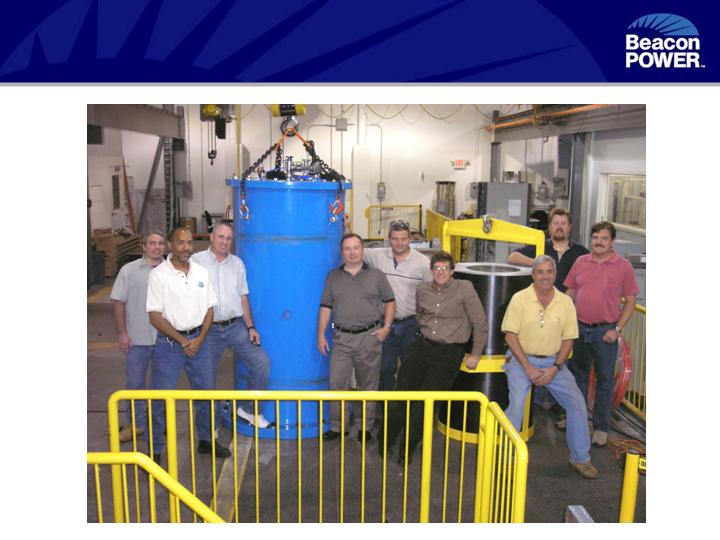
Gen 4 - 25kWh/100kW Flywheel

Related Applications
Other potential applications being considered for
flywheel technology
Mitigation of grid angular instability
Reactive power injection / absorption
Renewable ramp mitigation
UPS
Peak power
Micro-grid power regulation
Renewable energy integration