 0 Mondelez International August 2013 Exhibit 99.1 |
 Forward-looking statements 1 This presentation contains a number of forward-looking statements. The words “will,” “expect,” “outlook,” “guidance,” “drive,” “commitment,” “accelerate,” “improve,” “implied,” “increase,” “deliver,” “growth,” and similar expressions are intended to identify our forward-looking statements. Examples of forward-looking statements include, but are not limited to, statements we make about our future performance, including future revenue growth, earnings per share, margins and tax rates; the drivers of our future performance; increasing return of capital to shareholders; our investments in emerging markets and results of these investments; futures uses and priorities for free cash flow, including share repurchases and dividends; and confidence in our future. These forward-looking statements involve risks and uncertainties, many of which are beyond our control, and important factors that could cause actual results to differ materially from those in our forward-looking statements include, but are not limited to, continued global economic weakness, increased competition, continued volatility of commodity and other input costs, pricing actions, risks from operating globally, and tax law changes. For additional information on these and other factors that could affect our forward-looking statements, see our risk factors, as they may be amended from time to time, set forth in our filings with the SEC, including our most recently filed Annual Report on Form 10-K. We disclaim and do not undertake any obligation to update or revise any forward-looking statement in this presentation, except as required by applicable law or regulation. |
 Creating significant value for shareholders 2 Successfully turned around Kraft Foods by strengthening brand equities and rewiring the organization Strategically repositioned the company to concentrate on the core categories, priority markets and Power Brands to drive top-tier growth Drove a virtuous growth cycle to deliver solid operating performance in a challenging environment Creating a focused, top-tier, global consumer staples company, well-positioned to deliver sustainable, profitable growth over the long term Fix 2006–2009 Focus 2007–2010 Fuel 2010–2012 Future 2013 and Beyond |
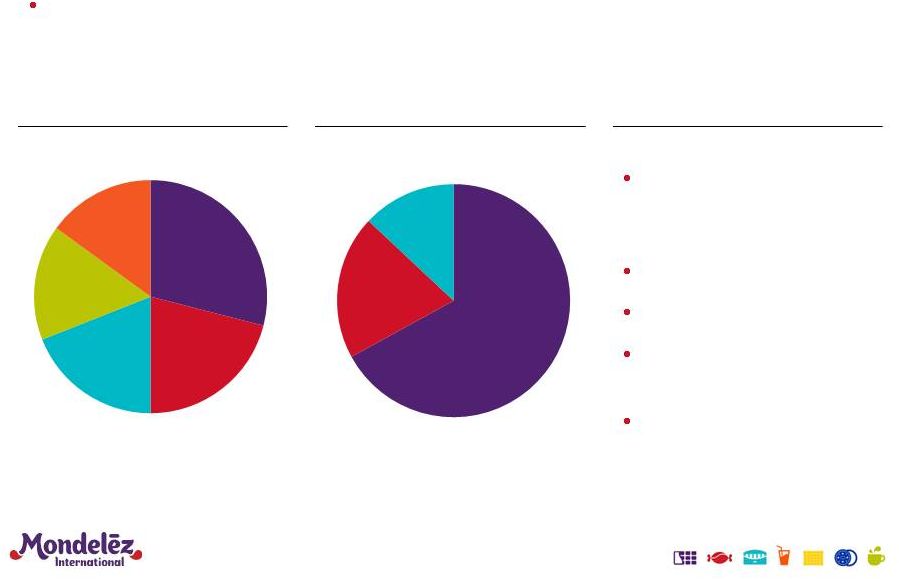 In 2006, Kraft was facing significant challenges … 3 Unfocused Portfolio Concentrated in Low-Growth Markets Poor Operating Fundamentals Portfolio “harvested” over time and misaligned with consumer and growth trends Weak brand equities with limited pricing power Poor product quality Lack of innovation Centralized operating structure Exodus of top talent North America 67% European Union 20% Developing Markets, Oceania, North Asia 13% Snacks 29% Beverages 21% Cheese 19% Convenient Meals 16% Grocery 15% (1) Revenue mix as originally reported in Kraft Foods Inc. 2006 Form 10-K. (1) (1) |
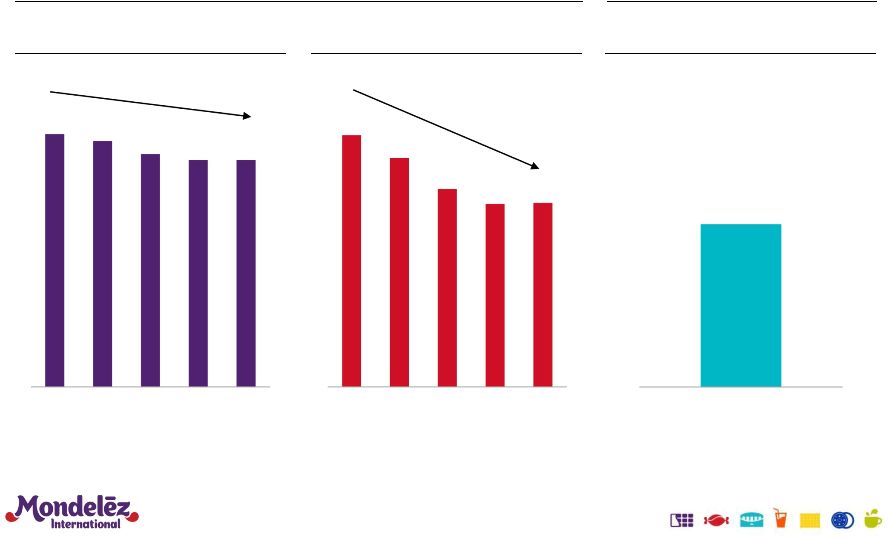 2002 2003 2004 2005 2006 2002 2003 2004 2005 2006 ... which drove margin declines and share losses 4 Gross Margin (ex. items) OI Margin (ex. items) % Rev. Gaining / Holding Share Deteriorating financial performance ... ... and share losses (1) See GAAP to non-GAAP reconciliation at the end of this presentation. Figures may not be directly comparable to other adjusted financial results used in this presentation. (2) Market share data for U.S. H1 2007 40.3% 39.2% 37.1% 36.1% 36.2% (410)bps 21.0% 19.1% 16.5% 15.3% 15.3% (570)bps 26% (1) (1) (2) |
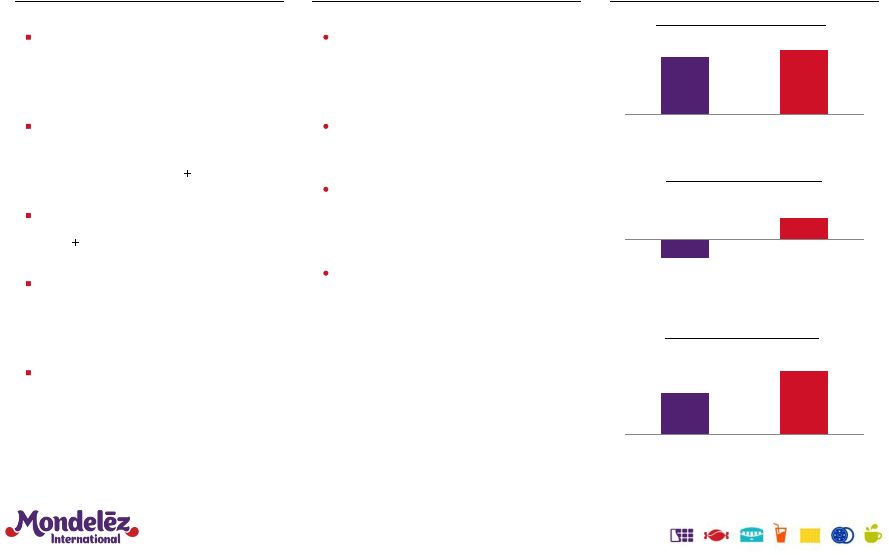 Fixed the base – 2006 to 2009 Rewired Organization Strengthened Brand Equities 4%+ 4.5% LT Target 2006-09 CAGR (3.8%) 4.0% 2002-2006 2006-2009 83% 124% 2006 2009 Rejuvenated Financial Performance Organic Revenue Growth (1) OI (ex. items) CAGRs (1)(2) FCF % of Net Earnings (1) 5 (1) See GAAP to non-GAAP reconciliation at the end of this presentation. (2) 2006-09 includes the frozen pizza business but excludes Post cereal. (3) Market share data for U.S. Improved product quality – ~2/3 revenue preferred vs. ~44% in 2006 Developed innovation pipeline – NPD revenue of 8% in 2009, from 6% in 2006 Increased A&C support – $600mm in 2009 vs. 2006 Restored pricing power – Fully recovered input cost increases Restored market share growth – 45% gaining / holding share in 2009 vs. 26% in H1 2007 (3) Upgraded management talent – 80% of top leaders new to company / position Created accountable business units with full P&L responsibility Optimized incentive systems to align with key drivers of value creation Focused on three operating metrics – Organic revenue growth – Operating income – Free cash flow |
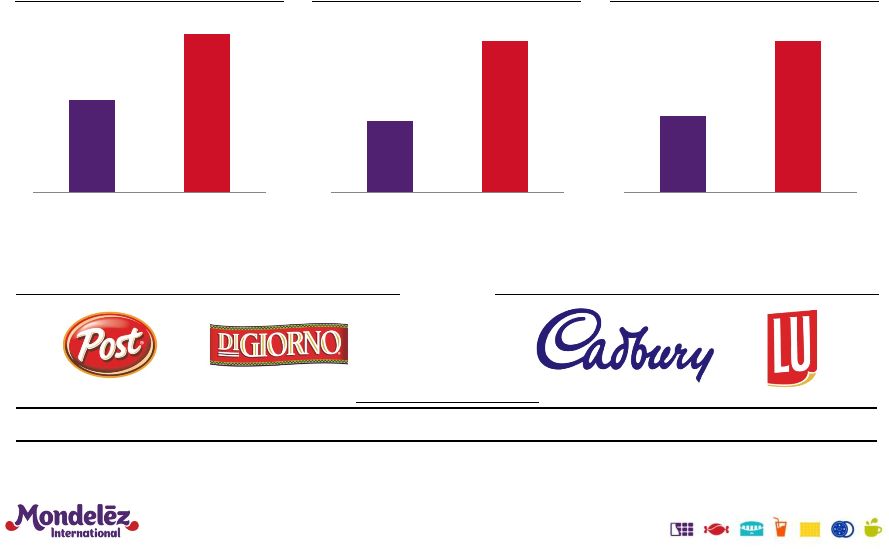 Focused the portfolio – 2007 to 2010 Divestitures Acquisitions 29% 50% 2006 2010 13% 28% 2006 2010 6 ~10% ~20% 2006 2010 (1) As reported originally in Kraft Foods 2006 Form 10-K filed with the SEC on March 1, 2007. Amounts have not been revised to reflect the Kraft Foods reporting structure in 2010. (2) 2010 Pro Forma amounts reflect the acquisition of Cadbury on a full-year basis. As presented at the Consumer Analysts Group of New York conference on February 22, 2011. (3) Taxable equivalent. (1) (2) (1) (2) (2) (2) % Revenue from Snacks % Revenue from Developing Markets % Revenue from Immediate Consumption Channel Multiple to LTM EBITDA 12.9x (3) 14.9x 13.0x 13.2x |
 Created a virtuous cycle of growth in each region … 7 Expand Gross Margin Reinvest in Growth Leverage Overheads Focus on Power Brands & Priority Markets |
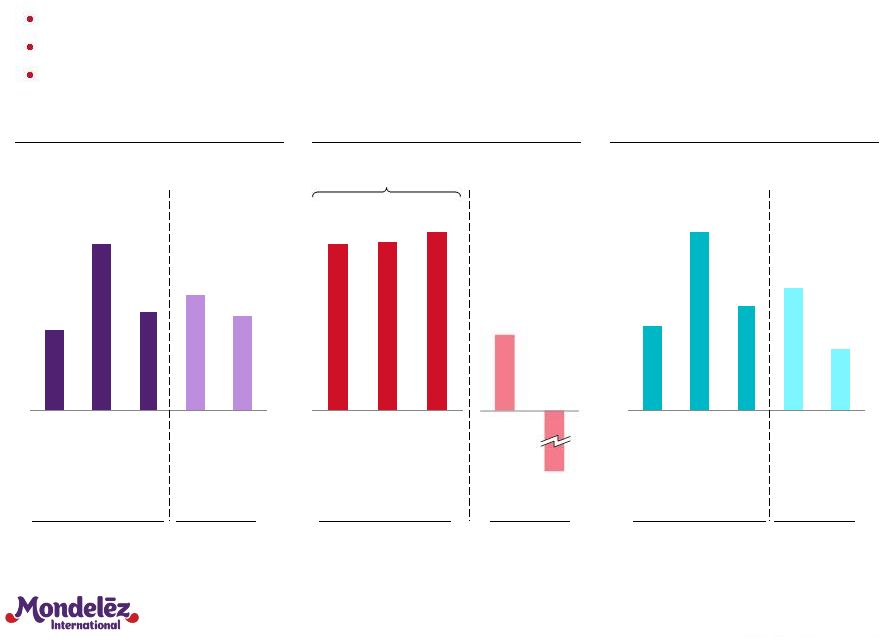 8.1% 9.9% 11.6% 2010 2011 2012 9mo KFT Peer Avg. … Driving superior performance – 2010-2012 8 Organic Revenue Growth (1) Adjusted OI Margin (1) Adjusted EPS Growth (1) 3.2% 6.6% 3.9% 4.6% 3.8% 2010 2011 2012 9mo KFT Peer Avg. x Kraft 3-Year Average (2) (3) 16.9% 2010 2011 LTM 9/2012 3-Year Margin Trend (2) (3) 3-Year Average (2) (3) 13.2% 13.3% 14.1% 90bps (140)bps Increased margin while making significant investments in N. America Revenue performance exceeded that of peers Outperformed peer margins in a period of unprecedented commodity inflation Drove EPS growth over 550 bps above peer average Kraft Kraft 5.9% (1) Reflects KFT results as restated to exclude the frozen pizza business. See GAAP to non-GAAP reconciliation at the end of this presentation. (2) Kraft three-year average organic revenue and EPS growth reflect mean of full-year 2010, full-year 2011 and nine months to September 30, 2012. Kraft three-year margin trend reflects OI margin for twelve months to September 30, 2012 vs. full-year 2010. (3) Peer set includes Campbell, Coca-Cola, ConAgra, Danone, General Mills, Heinz, Hershey, Kellogg, Nestlé and PepsiCo. KFT Peer Avg. |
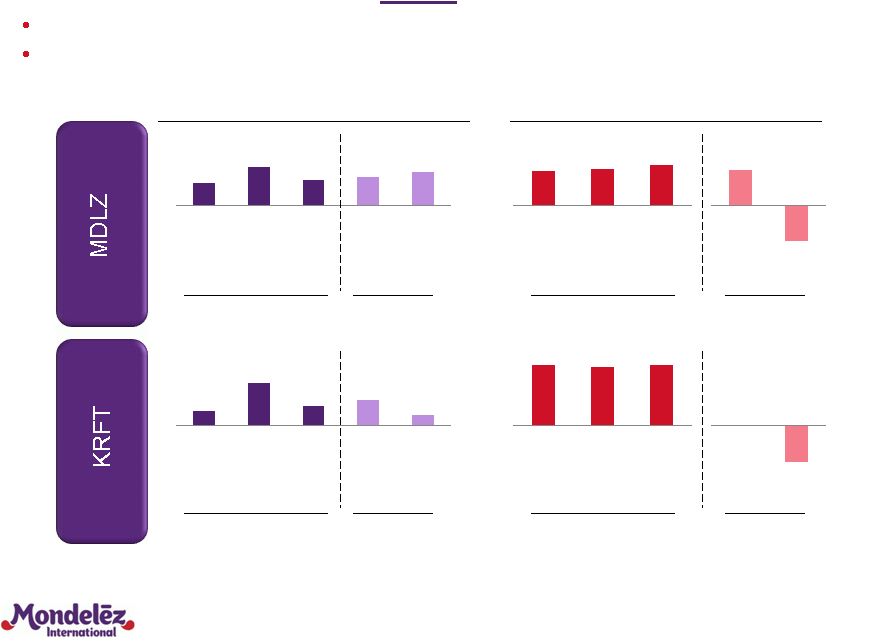 MDLZ Peer Avg. 2010 2011 LTM 9/2012 Underlying strength at both MDLZ and KRFT 9 MDLZ organic growth near peers, with dramatic outperformance on margins KRFT organic growth above peers, with margins constant vs. peer decline 4.1% 7.0% 4.6% 5.2% 6.0% 2010 2011 2012 9mo MDLZ Peer Avg. 2.0% 5.8% 2.6% 3.5% 1.5% 2010 2011 2012 9mo KRFT Peer Avg. 2010 2011 LTM 9/2012 KRFT Peer Avg. Organic Revenue Growth (1) Adjusted OI Margin (1) MDLZ 3-Year Avg. (2) (3) KRFT (4) 3-Year Avg. (2) (3) MDLZ 3-Year Margin Trend (2) (3) 3-Year Margin Trend (2) (3) 11.0% 11.5% 12.2% 120bps (120)bps 16.3% 15.7% 16.3% flat (170)bps (1) See GAAP to non-GAAP reconciliation at the end of this presentation. (2) MDLZ and KRFT three-year average organic revenue growth reflects average of full-year 2010, full-year 2011 and the nine months to September 30, 2012. Three-year margin trend reflects twelve months to September 30, 2012 vs. fiscal year 2010. (3) MDLZ peer set includes Coca-Cola, Danone, Hershey, Nestlé and PepsiCo. KRFT peer set includes Campbell, ConAgra, General Mills, Heinz and Kellogg. (4) Source: Kraft Foods Group earnings releases and Form S-4. KRFT (4) |
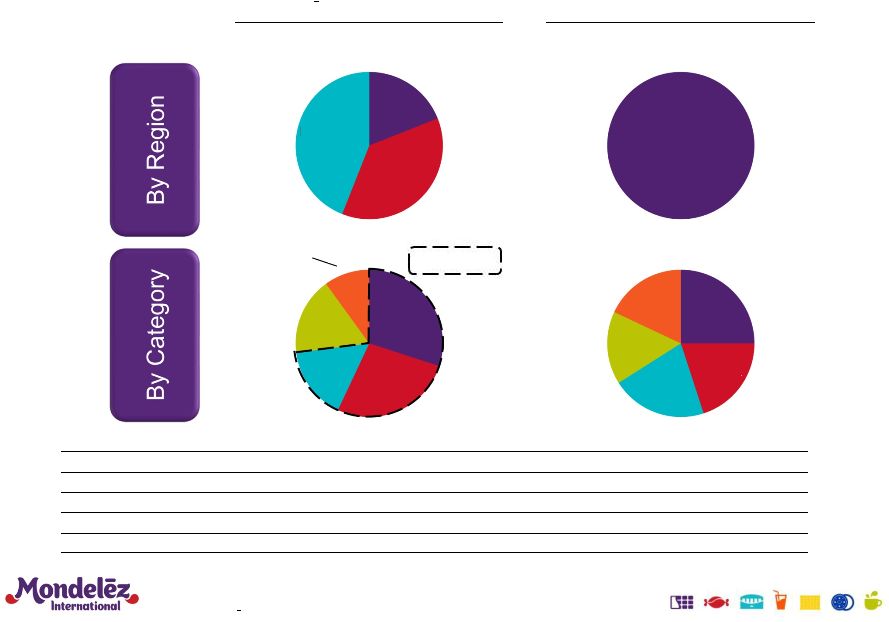 Separated to focus on distinct strategic priorities 10 Mondelez International – 2011 Kraft Foods Group – 2011 North America 19% Europe 37% Developing Markets 44% North America 100% Biscuits 30% Chocolate 27% Beverages 17% Cheese & Grocery 10% Gum & Candy 16% U.S. Grocery 25% U.S. Cheese 20% Canada & NA Foodservice 21% U.S. Beverages 16% U.S. Convenient Meals 18% Categories / Brands Products Store Presence Sales & Distribution Selling Costs Focus On Dividend Policy Global Ubiquitous, Impulse Snacking Aisle, End Caps, Hot Zone DSD, High Touch High Profitable Growth Moderate Payout Regional Everyday Staples Center of Store Warehouse Modest Cash Return High Dividend Yield Net Revenues of $36bn Net Revenues of $19bn Source: Mondelez International figures per 2012 Form 10-K. Kraft Foods Group figures per Form 10. ~75% Snacks |
 46% 39% MDLZ+KRFT Peer Avg 85% 57% MDLZ+KRFT Peer Avg Strong performance and separation unlocked value … resulting in superior TSR 11 Source: FactSet. Note: Peer set includes Campbell, Coca-Cola, ConAgra, Danone, General Mills, Heinz (through June 7, 2013), Hershey, Kellogg, Nestlé and PepsiCo. MDLZ+KRFT TSR reflects return of initial portfolio of one share of KFT, with dividends reinvested on ex. dividend dates and portfolio of 100 shares of KFT at close on October 1, 2012 converted to 100 shares of MDLZ plus 33 1/3 shares of KRFT. (To June 30, 2013) 98% 86% MDLZ+KRFT Peer Avg Since Spin Announcement (August 4, 2011) 3-Year 5-Year |
 Mondelez International is well-positioned for success 12 Advantaged Geographic Footprint Fast- Growing Categories Favorite Snacks Brands Proven Innovation Platforms Strong Routes-to- Market World-Class Talent & Capabilities |
 Virtuous cycle provides framework to achieve long-term targets ... 13 Operating EPS Growth 5%-7% Double-Digit (cst. FX) Organic Net Revenue Growth Long-Term Targets Expand Gross Margin Reinvest in Growth Leverage Overheads Focus on Power Brands & Priority Markets Operating Income Growth High Single- Digit (cst. FX) |
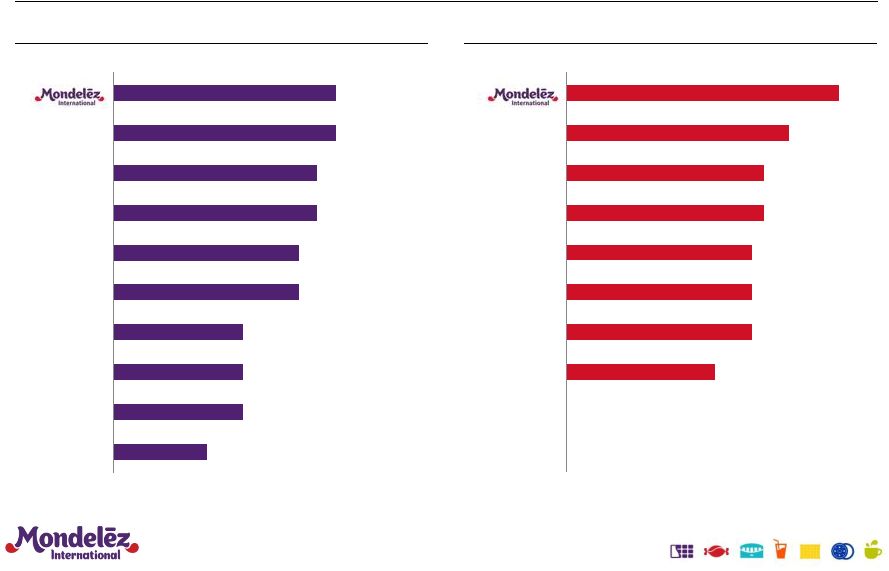 Danone Nestlé Campbell PepsiCo General Mills Coca-Cola Kellogg ConAgra Hershey ... that are top-tier in the food industry 14 Revenue Source: Company presentations. General Mills ConAgra Kellogg Campbell PepsiCo Danone Nestlé Coca-Cola Hershey 5-7% 5-7% 5-6% “Mid Single- Digit” 3-4% “Low Single- Digit” “Double- Digit” 8-10% 7-9% 5-7% “High Single- Digit” (1) “High Single- Digit” “High Single- Digit” EPS Long-Term Targets 5-6% 3-4% 3-4% Not Provided “At Least 5%” Not Provided 7-9% (1) “At least 10%” for FY2015-17 as Ralcorp synergies are phased in, followed by long-term target of 7-9%. |
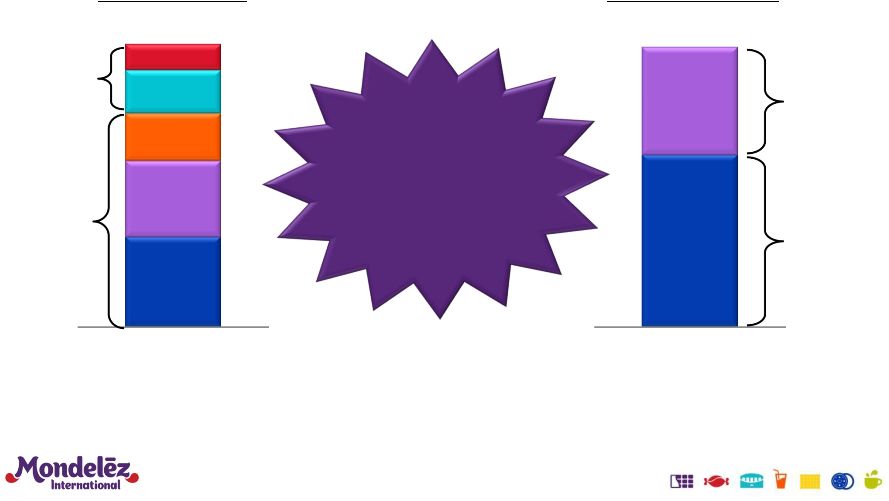 Top-tier, long-term revenue growth target supported by advantaged portfolio 15 Double digit growth Low-to-mid single digit growth Developed Markets Emerging Markets By Geography Low-to-mid single digit growth Mid-to-high single digit growth Chocolate Biscuits Gum & Candy Beverages Ch./Groc. By Category 5% - 7% Organic Growth 2012 2012 |
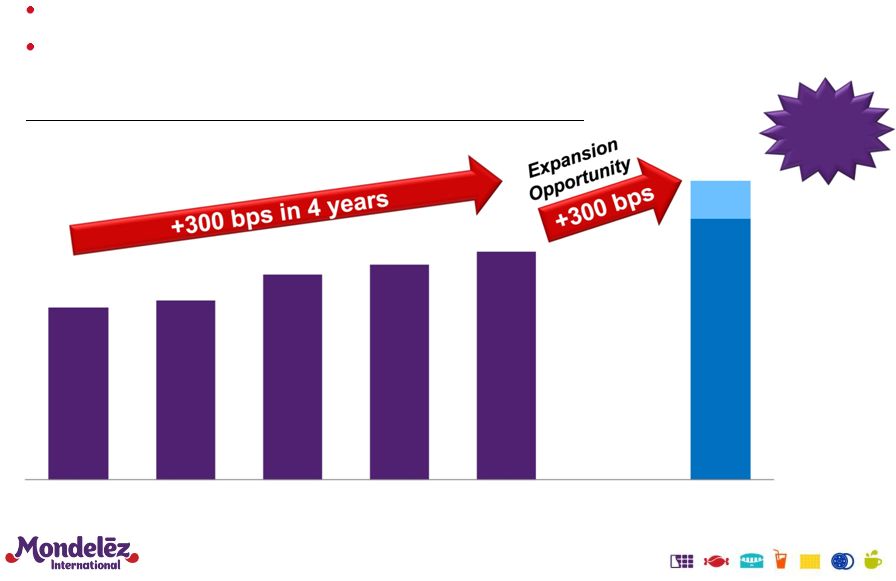 Significant operating income growth driven by margin expansion 16 Adjusted Operating Income Margin (1) (1) See GAAP to non-GAAP reconciliation at the end of this presentation. 9.2% 9.6% 11.0% 11.5% 12.2% 14% 16% 2008 2009 2010 2011 2012 LT Target +50bps excluding restructuring Strong track record of margin gains 250 bps of opportunity from gross margin expansion - |
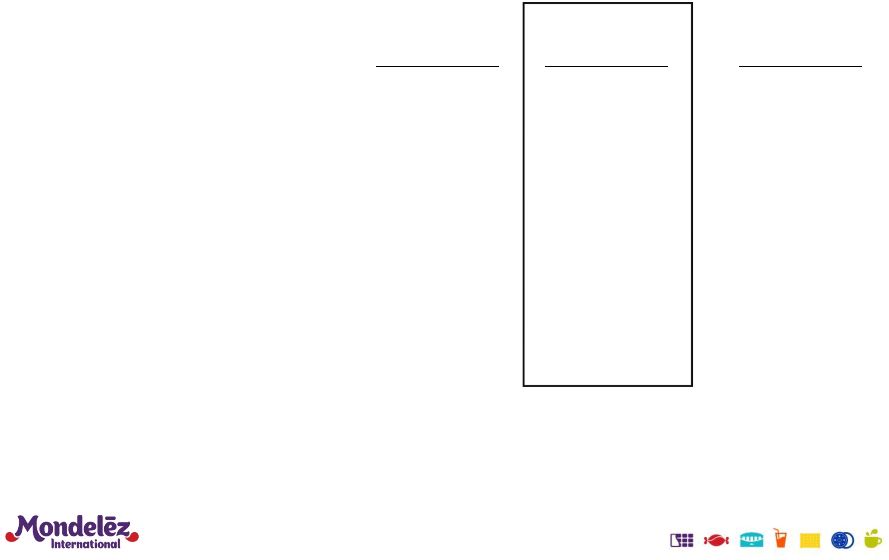
 Focused strategy to drive base margin expansion 17 2012 Adj. OI Margin (1) Target OI Margin Opportunity 13.0% 13%–16% +250bps 13.9% 18%–21% +500bps Key Drivers: Product Focus Supply Chain Optimization Overhead Leverage Drive Power Brands and product mix Upgrade certain Cadbury / LU facilities to world class costs Streamline / consolidate network Deliver 4%+ COGS productivity Integrate Central Europe into category model Leverage service centers in low-cost locations Drive Power Brands and product mix Leverage greenfield Mexico biscuits facility for growth Improve throughput by installing new technology Streamline / consolidate network Deliver 4%+ COGS productivity Offset dis-synergies through overhead reductions Capture synergies by implementing category model (1) See GAAP to non-GAAP reconciliation at the end of this presentation. Europe North America |
 H1 provides solid foundation for strong performance in H2 and 2014 Strong underlying fundamentals in H1 – High-quality revenue growth fueled by strong vol / mix – 60% of revenue gained / held share – Power Brands up 8% – Strong growth in Biscuits (+8%) (1) and Chocolate (+6%) (1) – Emerging Markets up 9.5% – Accelerated investments in emerging markets Difficult operating environment expected in H2 – Emerging markets slowing – Continued low-growth environment in developed markets – Continued coffee price headwinds 18 (1) See GAAP to non-GAAP reconciliation at the end of this presentation. |
 Maintained 2013 outlook based on strong H2 19 Organic Revenue Growth 3.8% ~6% Low end of 5-7% Adjusted OI Margin 10.8% ~13% ~12% Adjusted Effective Tax Rate 5.8% 16-20% 12-14% Adjusted EPS $0.71 $0.84-$0.89 $1.55-$1.60 % vs PY – Cst Fx 14-18% (2) Implied H2’13 Actual H1’13 (1) Outlook FY’13 (1) See GAAP to non-GAAP reconciliation at the end of this presentation. (2) Constant currency calculation excludes the ($0.04) impact from the Venezuelan bolivar devaluation imbedded in the current guidance range of $1.55 - $1.60. |
 Accelerating investments in 2013 enables significant margin expansion in 2014 20 (1) See GAAP to non-GAAP reconciliation at the end of this presentation. Adjusted Operating Income Margin 2012 Base Margin Expansion Emerging Markets Investments Ongoing Restructuring +60 to +90 bps (10) to (20) bps 2013 12.2% (1) Base Margin Expansion +60 to +90 bps High 12s 2014 ~12% Emerging Markets Investments ~(10) bps Ongoing Restructuring (50) to (70) bps (10) to (20) bps |
 Disciplined capital deployment 21 Solid Balance Sheet – Total Debt Steady ROIC Improvement (1) Investment-grade with access to CP Flexibility for tack-on M&A Strong improvement since Cadbury acquisition Ongoing 30-50bps increase through: – Double-digit EPS growth – Tight management of working capital and capex – Return of capital to shareholders +120bps KFT MDLZ Targeting improvement of +30-50bps per annum (1) Calculation excludes non-recurring items. Net Debt $15 - $16bn 7.9% 8.4% 9.1% 7.0% 2010 2011 2012 9mo 2012 $19.4bn $18.1bn Dec. 2012 Jun. 2013 |
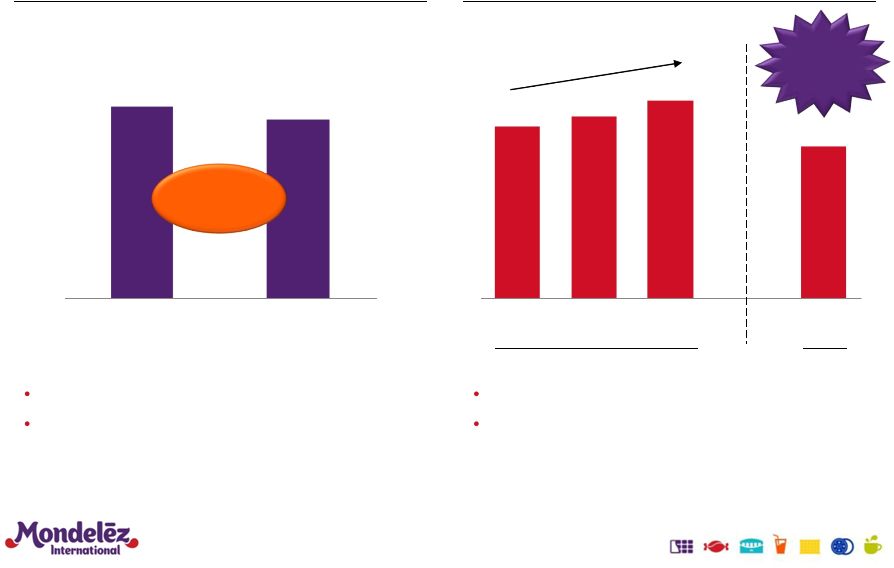
 Significant increase in return of capital to shareholders … 22 Reinvest in the business to drive top-tier growth Tack-on M&A, especially in emerging markets Return of capital to shareholders – Significantly increasing share repurchase authorization from $1.2B to $6B through 2016 ($1-2B annually) – First increase in quarterly dividend since 2008 (+$0.01, +8%) Pay down debt to preserve balance sheet flexibility Priorities for Use of Free Cash Flow 1 2 3 4 |
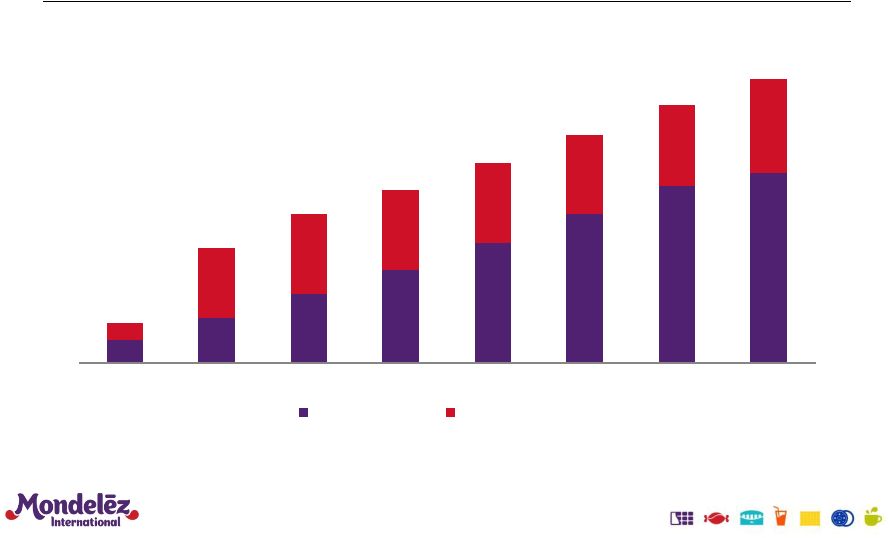 … Consistent with long-standing commitment 23 Cumulative Return of Capital 2006-2013E ($bn) (cash dividends plus share repurchases) 1.6 3.2 4.9 6.6 8.5 10.6 12.6 13.6 1.3 5.0 5.7 5.7 5.7 5.7 5.7 6.7 $2.8 $8.2 $10.6 $12.3 $14.3 $16.3 $18.4 $20.3 2006 2007 2008 2009 2010 2011 2012 2013E Cash Dividends Share Repurchases |
 Committed to delivering top-tier performance Mondel z International is a unique, global consumer staples company with an advantaged footprint in emerging markets, strong positions in fast-growing snacking categories and iconic Power Brands Management has a strong record of delivering TSR well above peers The company’s virtuous growth cycle provides a framework to deliver top-tier revenue and EPS growth as well as significant margin expansion This performance will translate into superior shareholder returns and steady improvement in ROIC 24 - e |
 14 |
 GAAP to Non-GAAP Reconciliation 26 As Reported (GAAP) Integration costs (1) Separation Program costs (2) Restructuring Program costs (3) Asset Impairment costs Loss on Sale of Food Factory Gain on Redemption of United Biscuits investment (Gain)/Loss on Divestitures, net Excluding Items (Non- GAAP) 2002 Net Revenues 29,248 $ - $ - $ - $ - $ - $ - $ - $ 29,248 $ Gross Profit 11,785 - - - - - - - 11,785 Gross Profit Margin 40.3% 40.3% Operating Income 5,961 115 142 - - (4) - (80) 6,134 OI Margin 20.4% 21.0% 2003 Net Revenues 30,498 $ - $ - $ - $ - $ - $ - $ - $ 30,498 $ Gross Profit 11,967 - - - - - - - 11,967 Gross Profit Margin 39.2% 39.2% Operating Income 5,860 (13) - - 6 - - (31) 5,822 OI Margin 19.2% 19.1% 2004 Net Revenues 32,168 $ - $ - $ 7 $ - $ - $ - $ - $ 32,175 $ Gross Profit 11,887 - - 37 - - - - 11,924 Gross Profit Margin 37.0% 37.1% Operating Income 4,612 - - 633 67 - - 3 5,315 OI Margin 14.3% 16.5% 2005 Net Revenues 34,113 $ - $ - $ 2 $ - $ - $ - $ - $ 34,115 $ Gross Profit 12,268 - - 58 - - - - 12,326 Gross Profit Margin 36.0% 36.1% Operating Income 4,752 - - 297 269 - - (108) 5,210 OI Margin 13.9% 15.3% 2006 Net Revenues 34,356 $ - $ - $ - $ - $ - $ - $ - $ 34,356 $ Gross Profit 12,416 - - 25 - - - - 12,441 Gross Profit Margin 36.1% 36.2% Operating Income 4,526 - - 673 424 - (251) (117) 5,255 OI Margin 13.2% 15.3% (1) (2) (3) Gross Profit/Operating Income and Related Margins ($ in millions except percentages) (Unaudited) Kraft Foods Inc. non-recurring costs. For 2004-2006, refers to the 2004-2008 Restructuring Program. Integration costs relate to the charges incurred to consolidate production lines, close facilities and other consolidation programs associated with the acquisition of Nabisco. Separation Program costs are the charges incurred in 2002 related to employee acceptances under a voluntary retirement program. Note: Reported amounts for 2002-2004 as per the 2004 Form 10-K; Reported amounts for 2005 and 2006 are as presented in each respective year's Form 10-K. Restructuring Program costs represent non-recurring restructuring and related implementation costs reflecting primarily severance, asset disposals and other manufacturing related |
 GAAP to Non-GAAP Reconciliation 27 As Reported (GAAP) Impact of Divestitures / Other Impact of Acquisitions Impact of Currency Organic (Non-GAAP) December 31, 2007 8.6% (0.6)pp 0.8pp 3.1pp 5.3% December 31, 2008 16.9% (0.8)pp 8.9pp 2.0pp 6.8% December 31, 2009 (3.7)% (0.7)pp 0.0pp (4.5)pp 1.5% Compound Annual Growth Rate 2006 - 2009: 6.9% 4.5% Net Revenues to Organic Net Revenue Growth (percentages) (Unaudited) Kraft Foods Inc. For the Twelve Months Ended: |
 GAAP to Non-GAAP Reconciliation 28 As Reported (GAAP) Integration costs (1) Separation Program costs (2) Restructuring Program costs (3) Asset Impairment costs Loss on Sale of Food Factory Gain on Redemption of United Biscuits investment (Gain)/Loss on Divestitures, net Excluding Items (Non- GAAP) For the Twelve Months Ended: December 31, 2003 (1.7)% (2.1) pp (2.2) pp - pp 0.1 pp 0.1 pp - pp 0.7 pp (5.1)% December 31, 2004 (21.3)% 0.2 pp - pp 10.8 pp 1.1 pp - pp - pp 0.5 pp (8.7)% December 31, 2005 3.0 % - pp - pp (6.7) pp 3.8 pp - pp - pp (2.1) pp (2.0)% December 31, 2006 (4.8)% - pp - pp 7.8 pp 2.7 pp - pp (4.7) pp (0.1) pp 0.9 % Compound Annual Growth Rate 2002-2006 (6.7)% (3.8)% (1) (2) (3) Integration costs relate to the charges incurred to consolidate production lines, close facilities and other consolidation programs associated with the acquisition of Nabisco. Separation Program costs are the charges incurred in 2002 related to employee acceptances under a voluntary retirement program. Restructuring Program costs represent non-recurring restructuring and related implementation costs reflecting primarily severance, asset disposals and other manufacturing related non-recurring costs. For 2004-2006, refers to the 2004-2008 Restructuring Program. Operating Income Growth (percentages) (Unaudited) Kraft Foods Inc. Note: Reported amounts for 2002-2004 as per the 2004 Form 10-K; Reported amounts for 2005 and 2006 are as presented in each respective year's Form 10-K. |
 GAAP to Non-GAAP Reconciliation 29 As Reported (GAAP) Integration costs (1) Restructuring Program costs (3) Asset Impairment costs Gain on Redemption of United Biscuits investment (Gain)/Loss on Divestitures, net Excluding Items (Non- GAAP) For the Twelve Months Ended: December 31, 2007 0.4 % - pp (4.4) pp (5.5) pp 4.6 pp 2.0 pp (2.9)% December 31, 2008 (8.0)% 2.0 pp 12.0 pp 0.3 pp - pp 2.2 pp 8.5 % December 31, 2009 43.7 % (2.2) pp (30.2) pp (2.7) pp - pp (1.8) pp 6.8 % Compound Annual Growth Rate 2006-2009 9.9 % 4.0 % (1) (2) Integration costs relate to the costs associated with combining the Kraft Foods and LU businesses, and are separate from those costs associated with the acquisition. Restructuring Program costs represent non-recurring restructuring and related implementation costs reflecting primarily severance, asset disposals and other manufacturing related non-recurring costs. For 2006-2009, refers to the 2004-2008 Restructuring Program. Kraft Foods Inc. Operating Income Growth (percentages) (Unaudited) Note: Reported amounts for 2007-2009 as per the 2009 Form 10-K which reflected restatements made for all years associated with the spin-off of the Post c ereals business and the change in the company's method of valuing its U.S. inventories to the average cost method from the LIFO method. |
 GAAP to Non-GAAP Reconciliation 30 2006 2009 Net Cash Provided by Operating Activities (GAAP) 3,720 $ 5,084 $ Capital Expenditures (1,169) (1,330) Free Cash Flow (Non-GAAP) 2,551 $ 3,754 $ Net Earnings Attributable to Kraft 3,060 3,021 Free Cash Flow / Net Earnings (Non-GAAP) 83% 124% Free Cash Flow as a Percentage of Net Earnings ($ in millions) (Unaudited) For the Twelve Months Ended December 31, Kraft Foods Inc. |
 GAAP to Non-GAAP Reconciliation 31 2010 2009 $ Change % Change Organic Net Revenues (Non-GAAP) 39,874 $ 38,645 $ $ 1,229 3.2% Impact of divestitures 21 109 (88) (0.3)pp Impact of acquisitions (1) 9,143 - 9,143 23.6pp Impact of Integration Program (1) - (1) 0.0pp Impact of accounting calendar changes 201 - 201 0.6pp Impact of foreign currency (31) - (31) (0.1)pp Net Revenues (GAAP) 49,207 $ 38,754 $ 10,453 $ 27.0% 2011 2010 $ Change % Change Organic Net Revenues (Non-GAAP) 51,533 $ 48,363 $ $ 3,170 6.6% 91 652 (561) (1.3)pp Impact of acquisitions (3) 697 - 697 1.4pp Impact of Integration Program (1) (1) - 0.0pp Impact of accounting calendar changes (4) 880 193 687 1.4pp Impact of foreign currency 1,165 - 1,165 2.4pp Net Revenues (GAAP) 54,365 $ 49,207 $ 5,158 $ 10.5% 2012 2011 $ Change % Change Organic Net Revenues (Non-GAAP) 40,761 $ 39,225 $ $ 1,536 3.9% - 91 (91) (0.2)pp Impact of accounting calendar changes (4) - 361 (361) (0.9)pp Impact of foreign currency (1,473) - (1,473) (3.8)pp Net Revenues (GAAP) 39,288 $ 39,677 $ (389) $ (1.0)% (1) (2) Impact of divestitures includes for reporting purposes Starbucks CPG business. (3) Impact of acquisitions reflects the incremental January 2011 operating results from our Cadbury acquisition on February 2, 2010 (4) Includes the impacts of accounting calendar changes and the 53 rd week of shipments in 2011. December 31, For the Nine Months Ended September 30, Kraft Foods Inc. Net Revenues to Organic Net Revenues ($ in millions, except percentages) (Unaudited) For the Years Ended For the Years Ended December 31, Impact of acquisitions reflects the incremental February 2010 to December 2010 operating results from the company’s Cadbury acquisition Impact of divestitures (2) Impact of divestitures (2) |
 GAAP to Non-GAAP Reconciliation 32 As Reported (GAAP) Integration Program Costs (1) Spin-Off Costs (2) Restructuring Program Costs (3) Acquisition- Related Costs (4) Impact of Divestitures (5) Loss on Divestitures, net As Adjusted (Non-GAAP) For the Year Ended December 31, 2010 Net Revenues $49,207 $ 1 $ - $ - $ - $ (652) $ - $ 48,556 Operating Income 5,666 646 - (37) 273 (149) 6 6,405 Operating Income Margin 11.5% 13.2% For the Year Ended December 31, 2011 Net Revenues $54,365 $ 1 $ - $ - $ - $ (91) $ - $ 54,275 Operating Income 6,657 521 46 (7) - (15) - 7,202 Operating Income Margin 12.2% 13.3% For the Nine Months Ended September 30, 2012 Net Revenues $39,288 $ - $ - $ - $ - $ - $ - $ 39,288 Operating Income 5,222 64 365 238 - - - 5,889 Operating Income Margin 13.3% 15.0% For the Three Months Ended December 31, 2011 Net Revenues $14,688 $ 1 $ - $ - $ - $ - $ - $ 14,689 Operating Income 1,507 169 46 - - - - 1,722 Operating Income Margin 13.3% 11.7% For the Twelve Months Ended September 30, 2012 Net Revenues $53,976 $ 1 $ - $ - $ - $ - $ - $ 53,977 Operating Income 6,729 233 411 238 - - - 7,611 Operating Income Margin 12.5% 14.1% Kraft Foods Inc. Reported to Adjusted Operating Income Margin ($ in millions, except percentages) (Unaudited) |
 GAAP to Non-GAAP Reconciliation 33 2010 2009 % Change Adjusted EPS 2.01 $ 1.86 $ 8.1 % Integration Program costs and other acquisition integration costs (1) (0.29) (0.01) Acquisition-related costs (2) and financing fees (3) (0.21) (0.04) U.S. Healthcare legislation impact on deferred taxes (0.08) - Restructuring Program costs (4) 0.01 0.04 Gains/(Losses) on divestitures, net - 0.04 Net Earnings from divested businesses - - Dilutes EPS attributable to Kraft Foods from Continuing Operations 1.44 $ 1.89 $ (23.8)% Discontinued Operations 0.95 0.14 Diluted EPS attributable to Kraft Foods 2.39 $ 2.03 $ 17.7 % 2011 2010 % Change Adjusted EPS 2.28 $ 1.95 $ 16.9 % Integration Program costs (1) (0.28) (0.29) Acquisition-related costs (2) and financing fees (3) - (0.21) U.S. Healthcare legislation impact on deferred taxes - (0.08) Restructuring Program costs (4) - 0.01 Spin-Off Costs (0.02) - Gains/(Losses) on divestitures, net - - Net Earnings from divested businesses (5) 0.01 0.06 Dilutes EPS attributable to Kraft Foods from Continuing Operations 1.99 $ 1.44 $ 38.2 % Discontinued Operations - 0.95 Diluted EPS attributable to Kraft Foods 1.99 $ 2.39 $ (16.7)% 2012 2011 % Change Adjusted EPS 1.88 $ 1.71 $ 9.9 % Integration Program costs (1) (0.04) (0.20) Restructuring Program costs (0.08) - Spin-Off Costs (0.36) - Gains/(Losses) on divestitures, net - - Net Earnings from divested businesses (4) - 0.01 Diluted EPS attributable to Kraft Foods 1.40 $ 1.52 $ (7.9)% December 31, For the Years Ended Kraft Foods Inc. Diluted EPS to Adjusted EPS (Unaudited) For the Years Ended December 31, For the Nine Months Ended September 30, (1) (2) (3) (4) (5) Impact of divestitures includes for reporting purposes Starbucks CPG business. Integration Program costs are defined as the costs associated with combining the Kraft Foods and Cadbury businesses, and are separate from those costs associated with acquisition. Other acquisition integration costs are the costs associated with combining the Kraft Foods and LU businesses, and are separate from those costs associated with the acquisition. Acquisition-related costs relate to the acquisition of Cadbury and include transaction advisory fees, U.K. stamp taxes and the impact of the Cadbury inventory revaluation. Acquisition-related financing fees include hedging and foreign currency impacts associated with the Cadbury acquisition and other fees associated with the Cadbury Bridge Facility. Restructuring Program costs represent non-recurring restructuring and related implementation costs reflecting primarily severance, asset disposals and other manufacturing related non- recurring costs. For 2012, refers to the 2012-2014 Restructuring Program; for 2010 and 2011, refers to reversals of 2004-2008 Restructuring Program costs. |
 GAAP to Non-GAAP Reconciliation 34 week of shipments in 2011. 2010 2009 $ Change % Change Organic Net Revenues (Non-GAAP) 22,369 $ 21,486 $ $ 883 4.1% Impact of foreign currency (223) - (223) (1.0)pp Impact of acquisitions (1) 9,143 - 9,143 42.6pp Impact of accounting calendar changes 201 - 201 0.9pp Impact of Integration Program (1) - (1) 0.0pp Impact of divestitures - 73 (73) (0.5)pp Net Revenues (GAAP) 31,489 $ 21,559 $ 9,930 $ 46.1% 2011 2010 $ Change % Change Organic Net Revenues (Non-GAAP) 33,385 $ 31,192 $ $ 2,193 7.0% Impact of foreign currency 1,074 - 1,074 3.4pp Impact of acquisitions (2) 697 - 697 2.3pp Impact of accounting calendar changes (3) 655 193 462 1.4pp Impact of Integration Program (1) (1) - 0.0pp Impact of divestitures - 105 (105) (0.4)pp Net Revenues (GAAP) 35,810 $ 31,489 $ 4,321 $ 13.7% 2012 2011 $ Change % Change Organic Net Revenues (Non-GAAP) 26,704 $ 25,520 $ $ 1,184 4.6% Impact of foreign currency (1,414) - (1,414) (5.4)pp Impact of accounting calendar changes - 349 (349) (1.4)pp Impact of divestitures 230 262 (32) (0.1)pp Net Revenues (GAAP) 25,520 $ 26,131 $ (611) $ (2.3)% (1) Impact of acquisitions reflects the incremental February 2010 to December 2010 operating results from the company's Cadbury acquisition. (2) Impact of acquisitions reflects the incremental January 2011 operating results from our Cadbury acquisition on February 2, 2010. (3) Includes the impacts of accounting calendar changes and the 53 rd December 31, Net Revenues to Organic Net Revenues ($ in millions, except percentages) (Unaudited) For the Years Ended For the Years Ended December 31, For the Nine Months Ended September 30, Mondelez International |
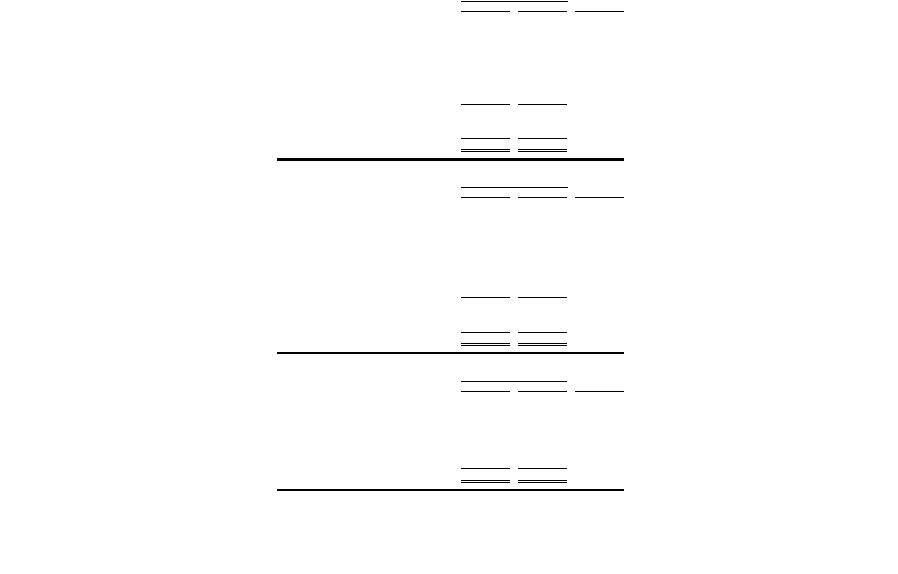
 GAAP to Non-GAAP Reconciliation 35 As Revised (GAAP) Integration Program Costs and other acquisition integration costs (1) Spin-Off Costs and related adjustments (2) Restructuring Program Costs (3) Acquisition- Related Costs (4) Impact of Divestitures (5) (Gain)/Loss on divestitures, net As Adjusted (Non-GAAP) For the Year Ended December 31, 2008 Net Revenues 22,872 $ - $ - $ - $ - $ (666) $ - $ 22,206 $ Operating Income 1,148 81 91 708 - (84) 91 2,035 Operating Income Margin 5.0% 9.2% For the Year Ended December 31, 2009 Net Revenues 21,559 $ - $ - $ - $ - $ (377) $ - $ 21,182 $ Operating Income 2,016 27 91 (76) 40 (73) 6 2,031 Operating Income Margin 9.4% 9.6% For the Year Ended December 31, 2010 Net Revenues 31,489 $ 1 $ - $ - $ - $ (500) $ - $ 30,990 $ Operating Income 2,496 646 91 (29) 273 (67) - 3,410 Operating Income Margin 7.9% 11.0% For the Year Ended December 31, 2011 Net Revenues 35,810 $ 1 $ - $ - $ - $ (429) $ - $ 35,382 $ Operating Income 3,498 521 137 (5) - (67) - 4,084 Operating Income Margin 9.8% 11.5% For the Year Ended December 31, 2012 Net Revenues 35,015 $ - $ - $ - $ - $ (340) $ - $ 34,675 $ Operating Income 3,637 140 512 110 1 (58) (107) 4,235 Operating Income Margin 10.4% 12.2% Reported to Adjusted Operating Income Margin ($ in millions, except percentages) (Unaudited) Mondelez International |
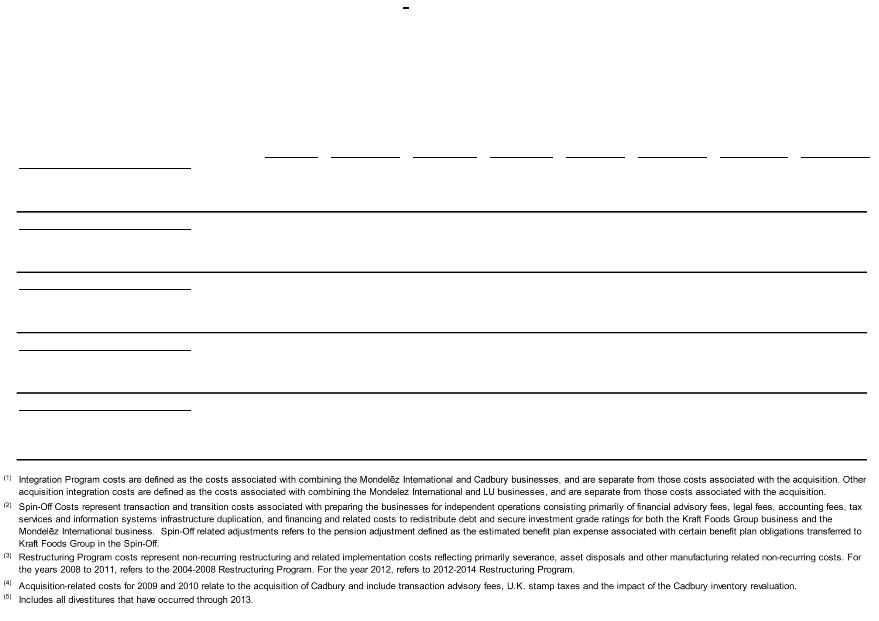
 GAAP to Non-GAAP Reconciliation 36 As Revised (GAAP) Integration Program Costs (1) Spin-Off Costs and related adjustments (2) 2012-2014 Restructuring Program Impact of As Adjusted (Non-GAAP) For the Nine Months Ended September 30, 2012 Net Revenues 25,520 $ - $ - $ - $ (297) $ 25,223 $ Operating Income 2,678 64 433 69 (51) 3,193 Operating Income Margin 10.5% 12.7% For the Three Months Ended December 31, 2011 Net Revenues 9,679 $ 1 $ - $ - $ (81) $ 9,599 $ Operating Income 823 169 69 - (12) 1,049 Operating Income Margin 8.5% 10.9% For the Twelve Months Ended September 30, 2012 Net Revenues 35,199 $ 1 $ - $ - $ (378) $ 34,822 $ Operating Income 3,501 233 502 69 (63) 4,242 Operating Income Margin 9.9% 12.2% Mondelez International Reported to Adjusted Operating Income Margin ($ in millions, except percentages) (Unaudited) - Costs (3) (4) Divestitures Integration Program costs are defined as the costs associated with combining the Mondelez International and Cadbury businesses, and are separate from those costs associated with the acquisition. Spin-Off Costs represent transaction and transition costs associated with preparing the businesses for independent operations consisting primarily of financial advisory fees, legal fees, accounting fees, tax services and information systems infrastructure duplication, and financing and related costs to redistribute debt and secure investment grade ratings for both the Kraft Foods Group business and the Mondelez International business. Spin-Off related adjustments refers to the pension adjustment defined as the estimated benefit plan expense associated with certain benefit plan obligations transferred to Kraft Foods Group in the Spin-Off. Restructuring Program costs represent non-recurring restructuring and related implementation costs reflecting primarily severance, asset disposals and other manufacturing related non-recurring costs. Includes all divestitures that have occurred through 2013. - - (4) (3) (2) (1) |
 GAAP to Non-GAAP Reconciliation 37 2010 2009 $ Change % Change Organic Net Revenues (Non-GAAP) 17,589 $ 17,248 $ 2.0% Impact of divestitures (1) 14 30 (0.1)pp Impact of foreign currency 194 - 1.1 pp Net Revenues (GAAP) 17,797 $ 17,278 $ 341 (16) 194 519 $ 3.0% 2011 2010 $ Change % Change Organic Net Revenues (Non-GAAP) 18,248 $ 17,250 $ 5.8% Impact of divestitures (2) 91 547 (2.8)pp Impact of the 53rd week of shipments 225 - 1.3 pp Impact of foreign currency 91 - 0.5 pp Net Revenues (GAAP) 18,655 $ 17,797 $ 998 (456) 225 91 858 $ 4.8% 2012 2011 $ Change % Change Organic Net Revenues (Non-GAAP) 13,885 $ 13,529 $ 2.6% Impact of foreign currency (40) - (0.3)pp Impact of the Starbucks CPG business cessation - 91 (0.6)pp Net Revenues (GAAP) 13,845 $ 13,620 $ $ 356 (40) (91) 225 $ 1.7% (1) The Starbucks CPG business net revenues were included in 2009 and 2010 within Organic Net Revenues. (2) Impact of divestitures includes for reporting purposes the Starbucks CPG business. For the Years Ended December 31, For the Nine Months Ended September 30, December 31, Kraft Foods Group Net Revenues to Organic Net Revenues ($ in millions, except percentages) (Unaudited) For the Years Ended $ $ |
 GAAP to Non-GAAP Reconciliation 38 (1) (2) Impact of divestitures includes for reporting purposes the Starbucks CPG business. Restructuring Program costs represent non-recurring restructuring and related implementation costs reflecting primarily severance, asset disposals and other manufacturing related non-recurring costs. For the years 2010 and 2011, refers to reversals of 2004-2008 Restructuring Program costs. For the year 2012, refers to costs incurred related to the 2012-2014 Restructuring Program. As Reported (GAAP) Restructuring Program Costs (1) Impact of Divestitures (2) Loss on Divestitures, net As Adjusted (Non-GAAP) For the Twelve Months Ended December 31, 2010 Net Revenues 17,797 $ - $ (547) $ - $ 17,250 $ Operating Income 2,961 (8) (145) 6 2,814 Operating Income Margin 16.6% 16.3% For the Twelve Months Ended December 31, 2011 Net Revenues 18,655 $ - $ (91) $ - $ 18,564 $ Operating Income 2,923 (2) (15) - 2,906 Operating Income Margin 15.7% 15.7% For the Nine Months Ended September 30, 2012 Net Revenues 13,845 $ - $ - $ - $ 13,845 $ Operating Income 2,392 170 - - 2,562 Operating Income Margin 17.3% 18.5% For the Three Months Ended December 31, 2011 Net Revenues 5,034 $ - $ - $ - $ 5,034 $ Operating Income 508 - - - 508 Operating Income Margin 10.1% 10.1% For the Twelve Months Ended September 30, 2012 Net Revenues 18,879 $ - $ - $ - $ 18,879 $ Operating Income 2,900 170 - - 3,070 Operating Income Margin 15.4% 16.3% Kraft Foods Group Reported to Adjusted Operating Income Margin ($ in millions, except percentages) (Unaudited) |
 GAAP to Non-GAAP Reconciliation 39 As Revised (GAAP) Integration Program costs (1) Spin-Off Costs and Related Adjustments (2) 2012-2014 Restructuring Program costs (3) Impact from Divestitures (4) As Adjusted (Non-GAAP) Europe Net Revenues 13,817 $ - $ - $ - $ (197) $ 13,620 $ Segment Operating Income 1,762 $ 47 $ 1 $ 6 $ (51) $ 1,765 $ Segment Operating Income Margin 12.8% 13.0% North America Net Revenues 6,903 $ - $ - $ - $ (47) $ 6,856 $ Segment Operating Income 781 $ 6 $ 77 $ 98 $ (7) $ 955 $ Segment Operating Income Margin 11.3% 13.9% Mondelez International Segment Operating Income To Adjusted Segment Operating Income For the Twelve Months Ended December 31, 2012 ($ in millions, except percentages) (Unaudited) |
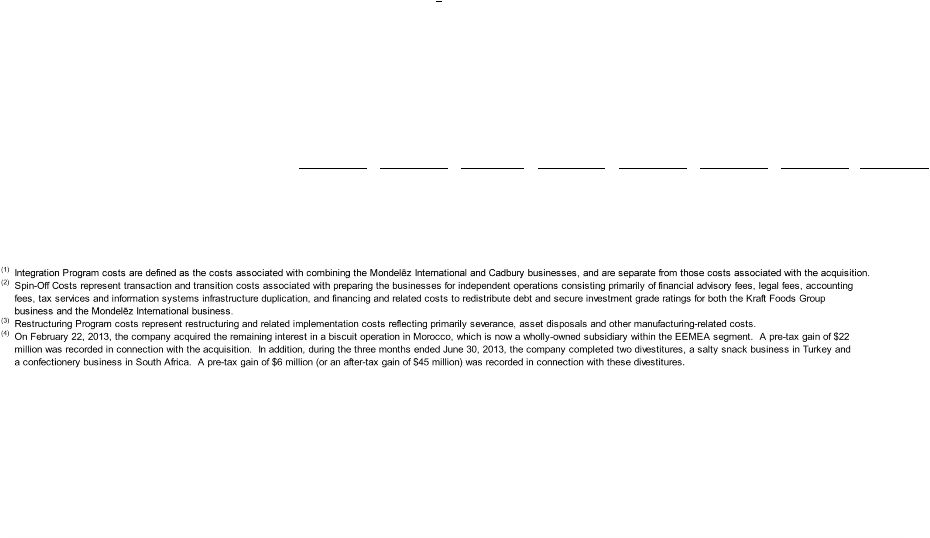
 GAAP to Non-GAAP Reconciliation 40 As Reported/ Revised (GAAP) Impact of Divestitures Impact of Acquisitions (1) Impact of Currency Organic (Non-GAAP) As Reported (GAAP) Organic (Non-GAAP) 2013 Biscuits 5,815 $ (17) $ (36) $ 89 $ 5,851 $ 5.9% 8.0% Chocolate 4,559 - - 121 4,680 3.1% 5.8% Gum & Candy 2,501 (3) - 75 2,573 (4.8)% (1.8)% Beverage 2,956 - - 39 2,995 (0.3)% 1.0% Cheese & Grocery 1,508 - - 36 1,544 10.9% (1.7)% Mondelez International 17,339 $ (20) $ (36) $ 360 $ 17,643 $ 0.8% 3.8% 2012 Biscuits 5,489 $ (69) $ - $ - $ 5,420 $ Chocolate 4,422 - - - 4,422 Gum & Candy 2,626 (7) - - 2,619 Beverage 2,965 (1) - - 2,964 Cheese & Grocery 1,692 (122) - - 1,570 Mondelez International 17,194 $ (199) $ - $ - $ 16,995 $ (1) On February 22, 2013, the company acquired the remaining interest in a biscuit operation in Morocco, which is now a wholly-owned subsidiary within the EEMEA segment. Net Revenues to Organic Net Revenues by Consumer Sector For the Six Months Ended June 30, ($ in millions, except percentages) (Unaudited) % Change Mondelez International |
 GAAP to Non-GAAP Reconciliation 41 As Reported/ Revised (GAAP) Integration Program and other acquisition integration costs (1) Spin-Off Costs and Related Adjustments (2) 2012-2014 Restructuring Program costs (3) Impact of divestitures Gains on acquisition and divestitures, net (4) Acquisition- related costs As Adjusted (Non-GAAP) Net Revenues 17,339 $ - $ - $ - $ (20) $ - $ - $ 17,319 $ Operating income 1,699 $ 74 $ 24 $ 99 $ 7 $ (28) $ 2 $ 1,877 $ Operating income margin 9.8% 10.8% Mondelez International Operating Income Margin To Adjusted Operating Income Margin For the Six Months Ended June 30, 2013 ($ in millions, except percentages) (Unaudited) - |
 GAAP to Non-GAAP Reconciliation 42 As Reported (GAAP) Integration Program and other acquisition integration costs (1) Spin-Off Costs (2) 2012-2014 Restructuring Program Costs (3) Net Earnings from divestitures Gains on acquisition and divestitures, net (4) Acquisition- related costs As Adjusted (Non-GAAP) Earnings from continuing operations before income taxes 1,185 $ 74 $ 24 $ 99 $ 7 $ (28) $ 7 $ 1,368 $ Provision for income taxes (6) $ 15 $ 10 $ 26 $ 2 $ 39 $ (7) $ 79 $ Effective tax rate (0.5)% 5.8% Mondelez International Effective Tax Rate To Adjusted Effective Tax Rate For the Six Months Ended June 30, 2013 ($ in millions, except percentages) (Unaudited) |
 GAAP to Non-GAAP Reconciliation 43 Diluted EPS Diluted EPS Attributable to Mondelez International for the Six Months Ended June 30, 2012 (GAAP) 1.03 $ Discontinued operations, net of income taxes 0.57 Diluted EPS Attributable to Mondelez International from continuing operations for the Six Months Ended June 30, 2012 (GAAP) 0.46 Integration Program and other acquisition integration costs (1) 0.04 Spin-Off Costs (2) 0.11 Spin-Off related adjustments (3) 0.05 2012-2014 Restructuring Program costs (4) 0.02 Net earnings from divestitures (0.01) Adjusted EPS for the Six Months Ended June 30, 2012 (Non-GAAP) 0.67 Decrease in operations (0.04) Gain on sale of property in 2012 (0.03) Intangible asset impairment charge in 2012 0.01 Lower interest and other expense, net 0.02 Changes in taxes 0.13 Adjusted EPS for the Six Months Ended June 30, 2013 (Constant Currency) 0.76 Unfavorable foreign currency (5) (0.05) Adjusted EPS for the Six Months Ended June 30, 2013 (Non-GAAP) 0.71 Integration Program and other acquisition integration costs (1) (0.03) Spin-Off Costs (2) (0.01) 2012-2014 Restructuring Program costs (4) (0.04) Net earnings from divestitures - Gains on acquisition and divestitures, net (6) 0.04 Acquisition-related costs (0.01) Diluted EPS Attributable to Mondelez International from continuing operations for the Six Months Ended June 30, 2013 (GAAP) 0.66 $ Mondelez International Diluted EPS to Adjusted EPS (Unaudited) |