Exhibit 99.4
Viasystems to Acquire DDi Corp.
April 2012
Disclaimer
This presentation and accompanying oral commentary contain forward-looking statements within the meaning of Section 27A of the Securities Act of 1933, as amended, and Section 21E of the Securities Exchange Act of 1934, as amended.
In addition, from time to time, Viasystems Group, Inc. (the “Company” or “Viasystems”) and DDi Corp. (“DDi”) or its representatives have made or may make forward-looking statements, orally or in writing. Such forward-looking statements may be included in, but are not limited to, various filings made by the companies with the Securities and Exchange Commission, press releases or oral statements made with the approval of an authorized executive officer of the companies.
Actual results could differ materially from those projected or suggested in any forward-looking statements as a result of a wide variety of factors and conditions. These factors and conditions have been described in the Company’s Form 10-K filed on February 15, 2012, DDi’s Form 10-K filed on February 17, 2012 and in other documents the companies file from time to time with the Securities and Exchange Commission.
Furthermore, in the presentation, the Company uses “Adjusted EBITDA”, “Adjusted Net Income”, and “Adjusted EPS.” The Company uses these non-GAAP financial measure in its decision-making because management believes they provide additional information that facilitates internal comparisons to competitors’ historical operating performance. The Company believes Adjusted EBITDA, Adjusted Net Income and Adjusted EPS provide investors useful information with which to measure performance.
Adjusted EBITDA is not a recognized financial measure under GAAP and does not purport to be an alternative to operating income as an indicator of operating performance. Adjusted EBITDA has limitations as an analytical tool, and you should not consider it in isolation, or as a substitute for analysis of the Company’s results as reported under GAAP. Similarly, Adjusted Net Income and Adjusted EPS have certain material limitations, primarily due to the exclusion of certain amounts that are material to the Company’s consolidated results of operations, such as costs associated with acquisitions and equity registrations, restructuring and impairment charges, certain interest and other expenses, and certain adjustments to net income. For a reconciliation to GAAP numbers, see Appendix A at the end of this presentation.
Adjusted Net Income and Adjusted EPS are not recognized financial measures under U.S. GAAP, do not purport to be indicators of the Company’s financial performance, and might not be consistent with measures used by other companies. The Company’s management believes these supplemental measures are useful in understanding underlying trends of the business and analyzing the effects of certain events that are infrequent or unusual for the Company.
2
Disclaimer (cont’d)
Adjusted Net Income and Adjusted EPS have certain material limitations, primarily due to the exclusion of certain amounts from earnings that are material to the Company’s consolidated results of operations, such as costs associated with acquisitions and equity registrations, restructuring and impairment charges, certain interest and other expenses, and certain adjustments to net income to arrive at net income available to common stockholders. As a result, Adjusted Net Income and Adjusted EPS differ materially from the earnings calculations reported by other companies in the industry, limiting their usefulness as comparative measures.
Additional Information and Where to Find It
DDi Corp. intends to file with the Securities and Exchange Commission (the “SEC”) a proxy statement in connection with the proposed merger with Viasystems Group, Inc. The definitive proxy statement will be sent or given to the stockholders of DDi and will contain important information about the proposed merger and related matters. SECURITY HOLDERS ARE URGED TO READ THE PROXY STATEMENT CAREFULLY WHEN IT BECOMES AVAILABLE. The proxy statement and other relevant materials (when they become available), and any other documents filed by DDi with the SEC, may be obtained free of charge at the SEC’s website, at www.sec.gov. In addition, security holders will be able to obtain free copies of the proxy statement by contacting DDi by mail at DDi Corp., 1220 N. Simon Circle, Anaheim, California 92806, Attn: Corporate Secretary, or by telephone at (714) 688-7200.
Participants in the Solicitation
Viasystems and DDi and their respective directors and executive officers may be deemed to be participants in the solicitation of proxies from DDi stockholders in connection with the proposed merger. Information about Viasystems’ directors and executive officers is set forth in Viasystems’ proxy statement for its 2012 Annual Meeting of Stockholders filed with the SEC on March 21, 2012 and in its Annual Report on Form 10-K for the year ended December 31, 2011, filed on February 15, 2012. These documents can be obtained free of charge by visiting the SEC’s web site at www.sec.gov, by mailing Viasystems at 101 South Hanley Road, St. Louis, MO 63105, Attention: Investor Relations Department or by visiting Viasystems’ corporate web site at www.viasystems.com. Information about DDi’s directors and executive officers is set forth in its proxy statement for its 2011 Annual Meeting of Stockholders, which was filed with the SEC on April 14, 2011. This document is available free of charge at the SEC’s web site at www.sec.gov, and from DDi by telephone at (714) 688-7200, or by mail at DDi Corp., 1220 N. Simon Circle, Anaheim, California 92806, Attn: Corporate Secretary, or by going to DDi’s annual meeting website at www.ddiglobal.com/annualmeeting. Additional information regarding the interests of participants in the solicitation of proxies in connection with the merger will be included in the proxy statement that DDi intends to file with the SEC.
3
Table of Contents
I. Transaction Summary
II. Investment Highlights
III. Financial Highlights
4
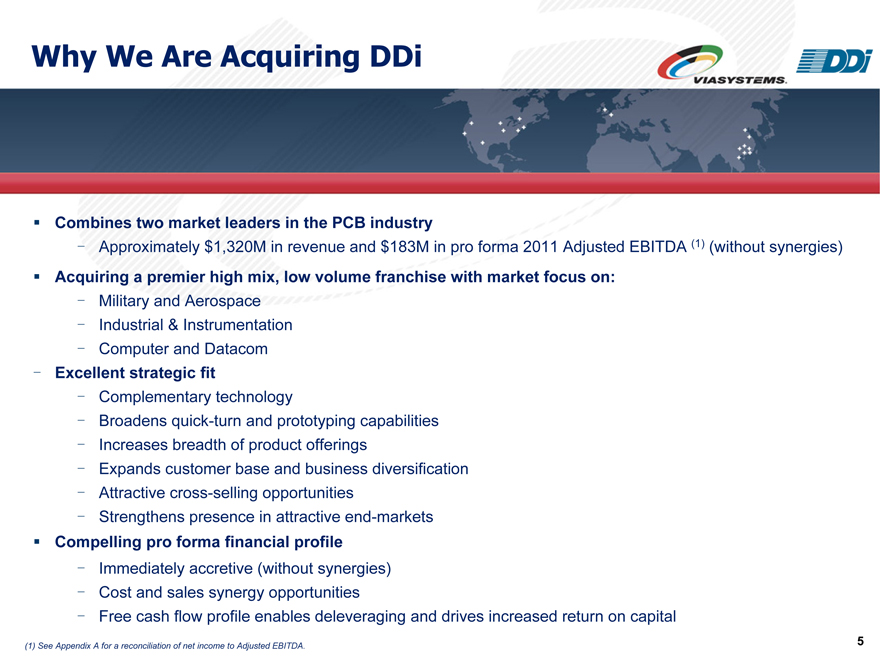
Why We Are Acquiring DDi
Combines two market leaders in the PCB industry
Approximately $1,320M in revenue and $183M in pro forma 2011 Adjusted EBITDA (1) (without synergies)
Acquiring a premier high mix, low volume franchise with market focus on:
Military and Aerospace
Industrial & Instrumentation
Computer and Datacom
Excellent strategic fit
Complementary technology
Broadens quick-turn and prototyping capabilities
Increases breadth of product offerings
Expands customer base and business diversification
Attractive cross-selling opportunities
Strengthens presence in attractive end-markets
Compelling pro forma financial profile
Immediately accretive (without synergies)
Cost and sales synergy opportunities
Free cash flow profile enables deleveraging and drives increased return on capital
(1) See Appendix A for a reconciliation of net income to Adjusted EBITDA.
5
I. Transaction Summary
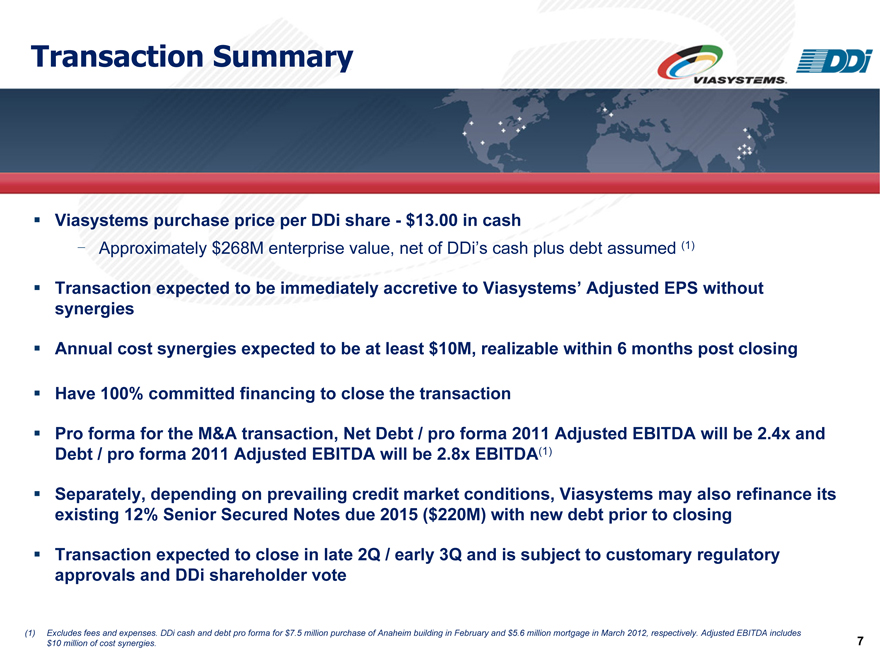
Transaction Summary
Viasystems purchase price per DDi share—$13.00 in cash
Approximately $268M enterprise value, net of DDi’s cash plus debt assumed (1)
Transaction expected to be immediately accretive to Viasystems’ Adjusted EPS without synergies
Annual cost synergies expected to be at least $10M, realizable within 6 months post closing
Have 100% committed financing to close the transaction
Pro forma for the M&A transaction, Net Debt / pro forma 2011 Adjusted EBITDA will be 2.4x and Debt / pro forma 2011 Adjusted EBITDA will be 2.8x EBITDA(1)
Separately, depending on prevailing credit market conditions, Viasystems may also refinance its existing 12% Senior Secured Notes due 2015 ($220M) with new debt prior to closing
Transaction expected to close in late 2Q / early 3Q and is subject to customary regulatory approvals and DDi shareholder vote
(1) Excludes fees and expenses. DDi cash and debt pro forma for $7.5 million purchase of Anaheim building in February and $5.6 million mortgage in March 2012, respectively. Adjusted EBITDA includes $10 million of cost synergies.
7
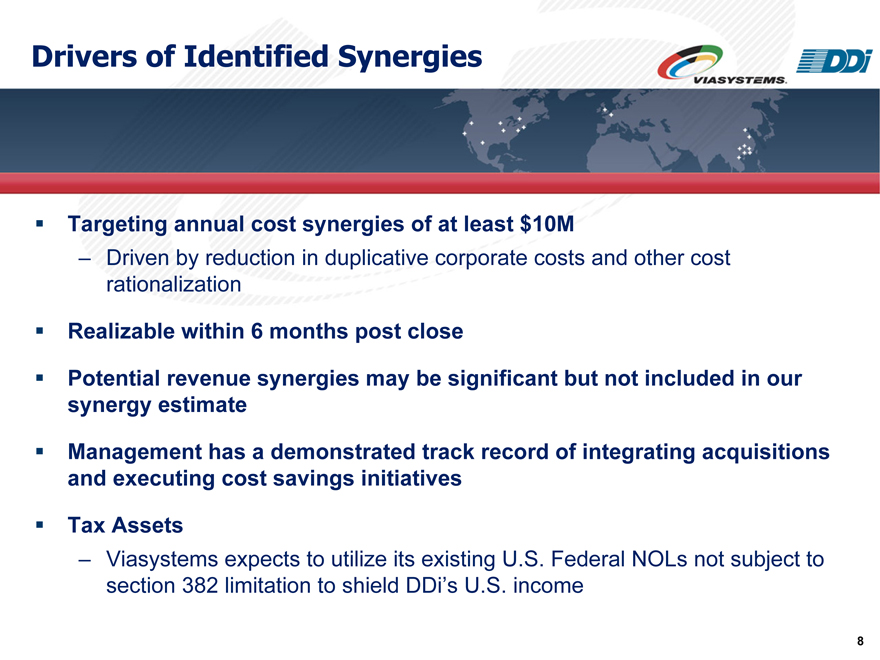
Drivers of Identified Synergies
Targeting annual cost synergies of at least $10M
– Driven by reduction in duplicative corporate costs and other cost rationalization
Realizable within 6 months post close
Potential revenue synergies may be significant but not included in our synergy estimate
Management has a demonstrated track record of integrating acquisitions and executing cost savings initiatives
Tax Assets
– Viasystems expects to utilize its existing U.S. Federal NOLs not subject to section 382 limitation to shield DDi’s U.S. income
8
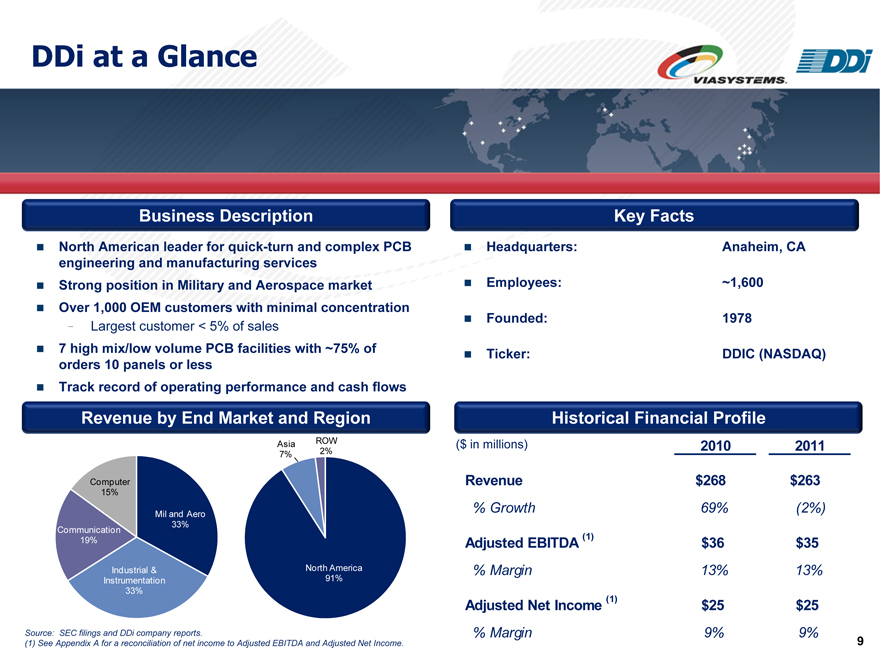
DDi at a Glance
Business Description
North American leader for quick-turn and complex PCB engineering and manufacturing services Strong position in Military and Aerospace market Over 1,000 OEM customers with minimal concentration
Largest customer < 5% of sales
7 high mix/low volume PCB facilities with ~75% of orders 10 panels or less Track record of operating performance and cash flows
Key Facts
Headquarters: Anaheim, CA Employees: ~1,600 Founded: 1978 Ticker: DDIC (NASDAQ)
Revenue by End Market and Region
Computer 15%
Communication 19%
Industrial & Instrumentation 33%
Mil and Aero 33%
Asia 7%
ROW 2%
North America 91%
Source: SEC filings and DDi company reports.
(1) See Appendix A for a reconciliation of net income to Adjusted EBITDA and Adjusted Net Income.
Historical Financial Profile
($ in millions) 2010 2011
Revenue $268 $263
% Growth 69% (2%)
Adjusted EBITDA (1) $36 $35
% Margin 13% 13%
Adjusted Net Income (1) $25 $25
% Margin 9% 9%
9
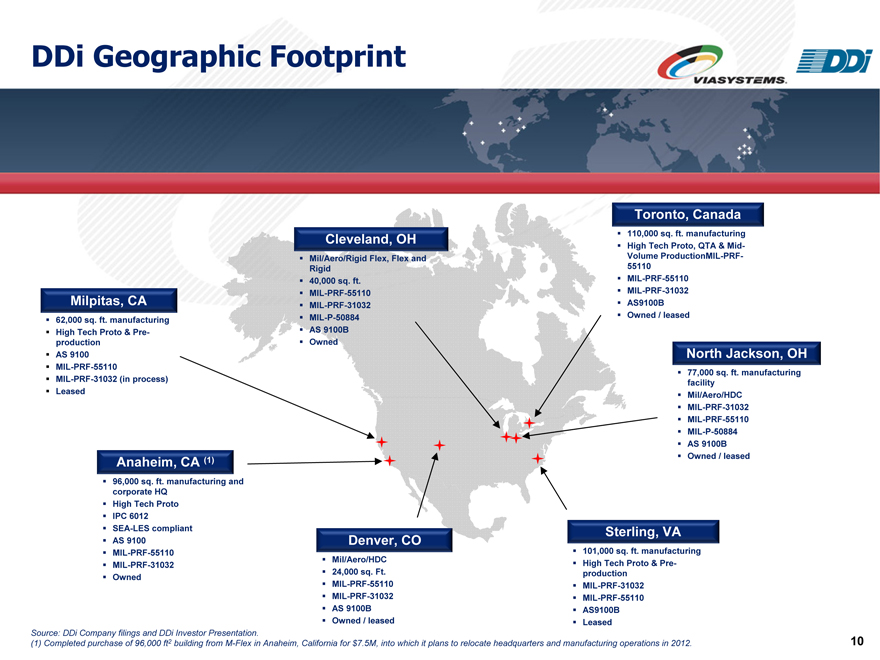
DDi Geographic Footprint
Cleveland, OH
Mil/Aero/Rigid Flex, Flex and Rigid 40,000 sq. ft.
MIL-PRF-55110 MIL-PRF-31032 MIL-P-50884 AS 9100B Owned
Milpitas, CA
62,000 sq. ft. manufacturing High Tech Proto & Preproduction AS 9100 MIL-PRF-55110 MIL-PRF-31032 (in process) Leased
Anaheim, CA (1)
96,000 sq. ft. manufacturing and corporate HQ
High Tech Proto IPC 6012 SEA-LES compliant AS 9100 MIL-PRF-55110 MIL-PRF-31032 Owned
Denver, CO
Mil/Aero/HDC 24,000 sq. Ft. MIL-PRF-55110 MIL-PRF-31032 AS 9100B Owned / leased
Toronto, Canada
110,000 sq. ft. manufacturing High Tech Proto, QTA & Mid-Volume ProductionMIL-PRF-55110 MIL-PRF-55110 MIL-PRF-31032 AS9100B
Owned / leased
North Jackson, OH
77,000 sq. ft. manufacturing facility Mil/Aero/HDC
MIL-PRF-31032 MIL-PRF-55110 MIL-P-50884 AS 9100B Owned / leased
Sterling, VA
101,000 sq. ft. manufacturing High Tech Proto & Preproduction MIL-PRF-31032 MIL-PRF-55110 AS9100B
Leased
Source: DDi Company filings and DDi Investor Presentation.
(1) Completed purchase of 96,000 ft2 building from M-Flex in Anaheim, California for $7.5M, into which it plans to relocate headquarters and manufacturing operations in 2012.
10
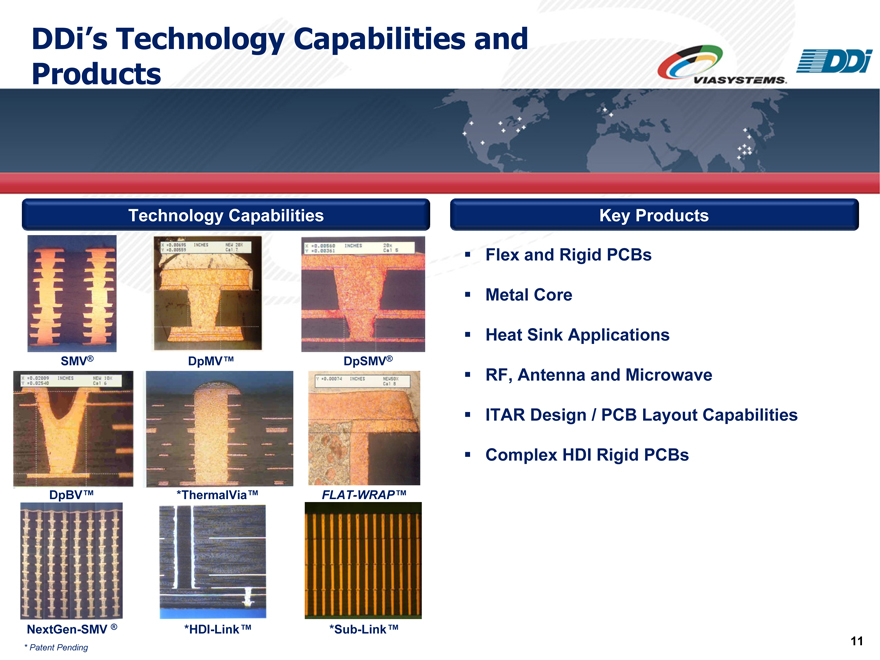
DDi’s Technology Capabilities and Products
Technology Capabilities
SMV® DpMV™ DpSMV®
DpBV™ *ThermalVia™ FLAT-WRAP™
NextGen-SMV ® *HDI-Link™ *Sub-Link™
* Patent Pending
Key Products
Flex and Rigid PCBs Metal Core Heat Sink Applications RF, Antenna and Microwave
ITAR Design / PCB Layout Capabilities
Complex HDI Rigid PCBs
11
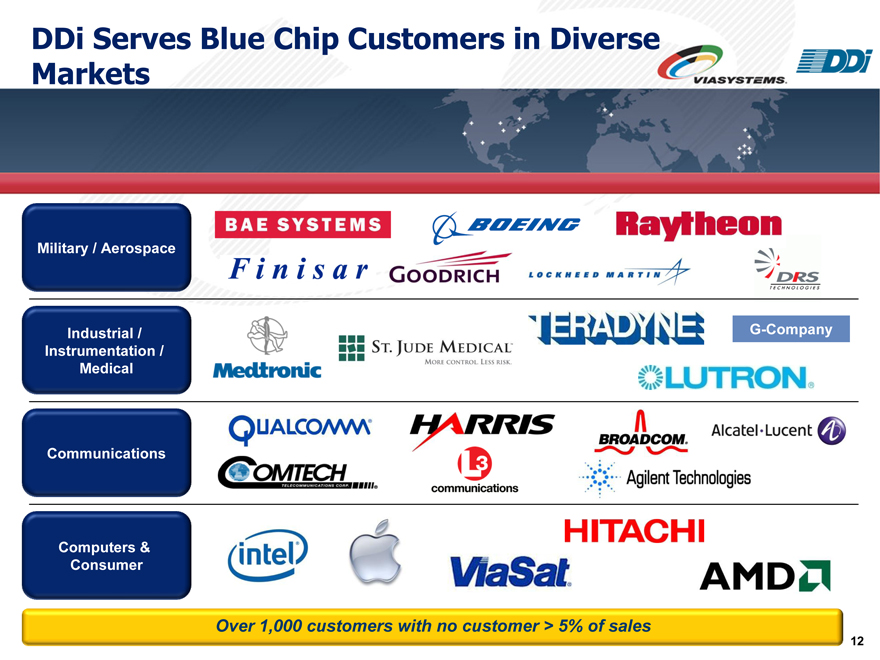
DDi Serves Blue Chip Customers in Diverse Markets
Military / Aerospace
Industrial / Instrumentation / Medical
Communications
Computers & Consumer
Over 1,000 customers with no customer > 5% of sales
12

II. Investment Highlights
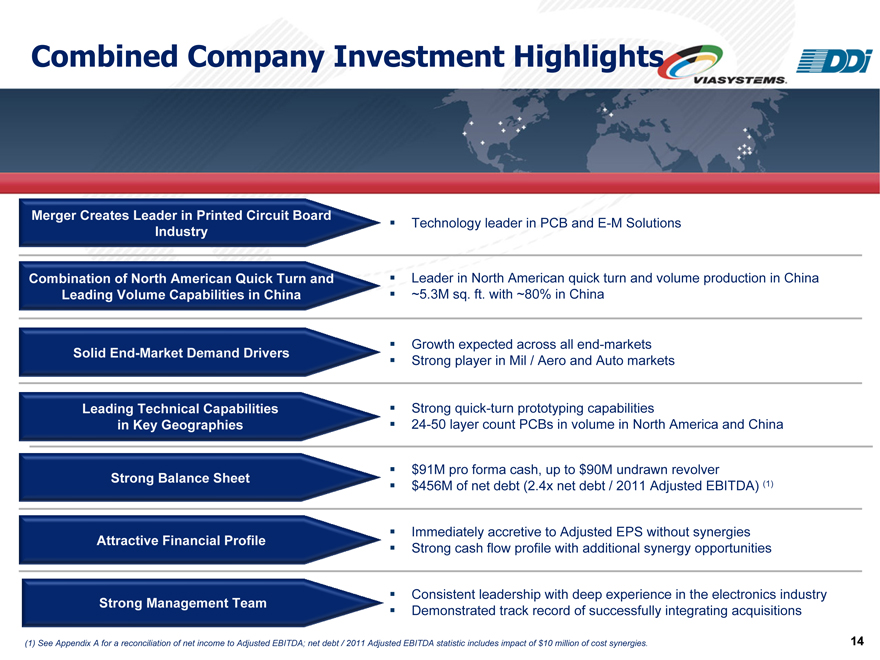
Combined Company Investment Highlights
Merger Creates Leader in Printed Circuit Board Industry
Combination of North American Quick Turn and Leading Volume Capabilities in China
Solid End-Market Demand Drivers
Leading Technical Capabilities in Key Geographies
Strong Balance Sheet Attractive Financial Profile Strong Management Team
Technology leader in PCB and E-M Solutions
Leader in North American quick turn and volume production in China
~5.3M sq. ft. with ~80% in China
Growth expected across all end-markets Strong player in Mil / Aero and Auto markets
Strong quick-turn prototyping capabilities
24-50 layer count PCBs in volume in North America and China
$91M pro forma cash, up to $90M undrawn revolver $456M of net debt (2.4x net debt / 2011 Adjusted EBITDA) (1)
Immediately accretive to Adjusted EPS without synergies Strong cash flow profile with additional synergy opportunities
Consistent leadership with deep experience in the electronics industry Demonstrated track record of successfully integrating acquisitions
(1) See Appendix A for a reconciliation of net income to Adjusted EBITDA; net debt / 2011 Adjusted EBITDA statistic includes impact of $10 million of cost synergies.
14
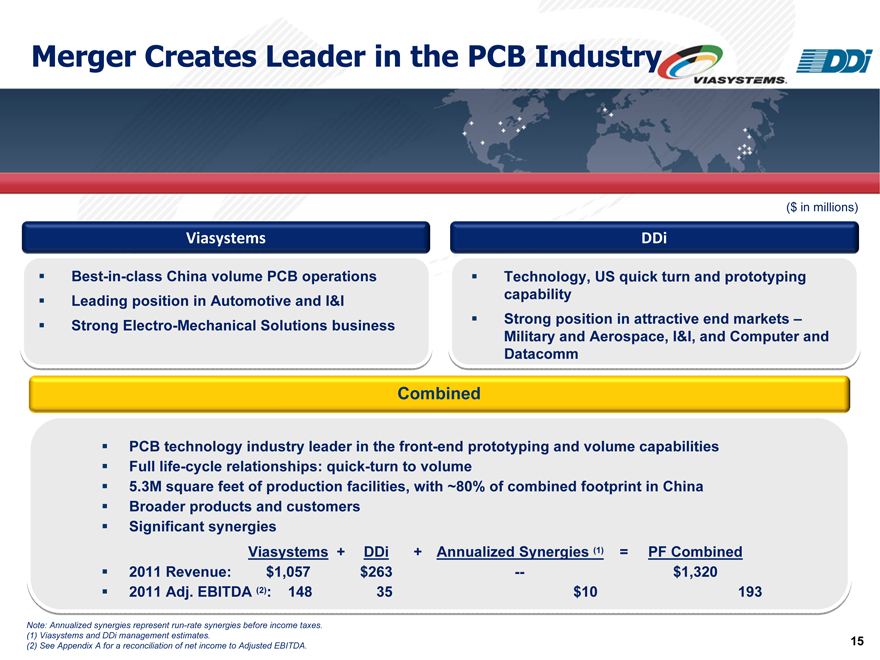
Merger Creates Leader in the PCB Industry
Viasystems
Best-in-class China volume PCB operations Leading position in Automotive and I&I Strong Electro-Mechanical Solutions business
DDi
Technology, US quick turn and prototyping capability Strong position in attractive end markets –Military and Aerospace, I&I, and Computer and Datacomm
Combined
PCB technology industry leader in the front-end prototyping and volume capabilities Full life-cycle relationships: quick-turn to volume 5.3M square feet of production facilities, with ~80% of combined footprint in China Broader products and customers Significant synergies
Viasystems + DDi + Annualized Synergies (1) = PF Combined
2011 Revenue: $1,057 $263 — $1,320
2011 Adj. EBITDA (2): 148 35 $10 193
Note: Annualized synergies represent run-rate synergies before income taxes. (1) Viasystems and DDi management estimates.
(2) See Appendix A for a reconciliation of net income to Adjusted EBITDA.
15
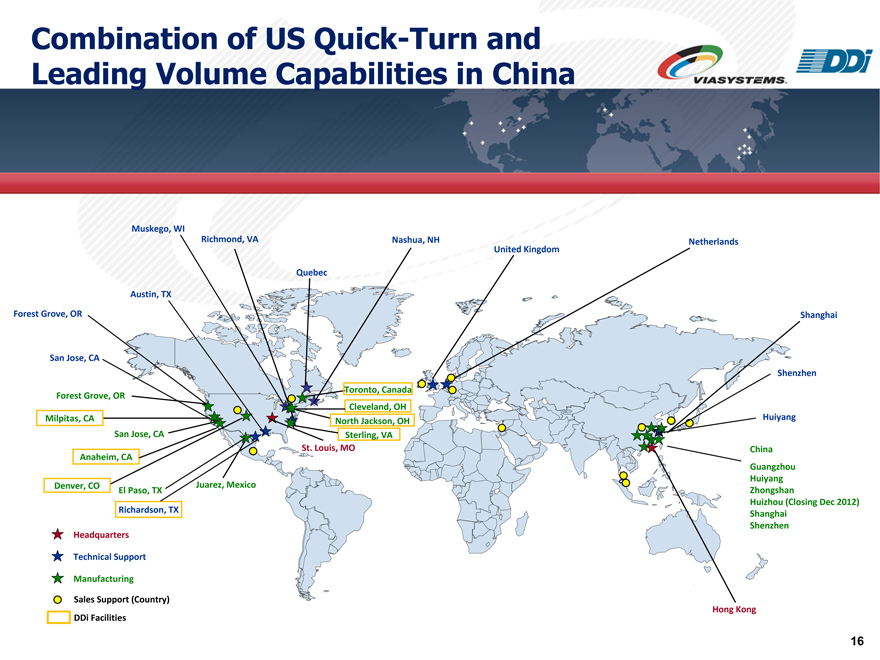
Combination of US Quick-Turn and Leading Volume Capabilities in China
Muskego, WI
Richmond, VA
Quebec
Nashua, NH
United Kingdom
Netherlands
Shanghai
Shenzhen
Huiyang
China Guangzhou Huiyang Zhongshan
Huizhou (Closing Dec 2012) Shanghai Shenzhen
Toronto, Canada Cleveland, OH
North Jackson, OH Sterling, VA
St. Louis, MO
Austin, TX
Forest Grove, OR
San Jose, CA
Forest Grove, OR
Milpitas, CA
San Jose, CA
Anaheim, CA
Denver, CO
El Paso, TX
Richardson, TX
Juarez, Mexico
Headquarters Technical Support Manufacturing
Sales Support (Country) DDi Facilities
Hong Kong
16
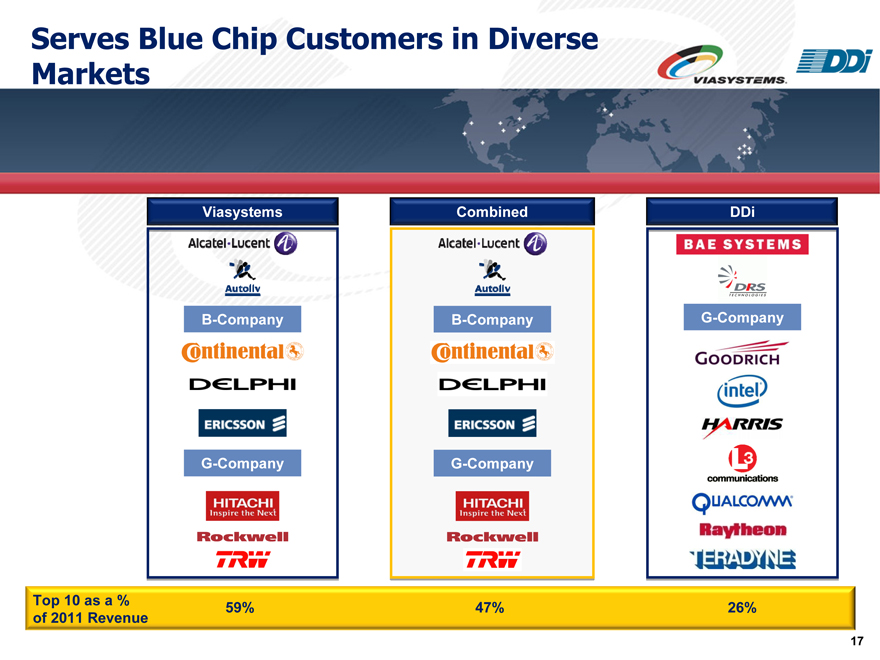
Serves Blue Chip Customers in Diverse Markets
Viasystems
Combined
DDi
Top 10 as a %
59% 47% 26% of 2011 Revenue
17
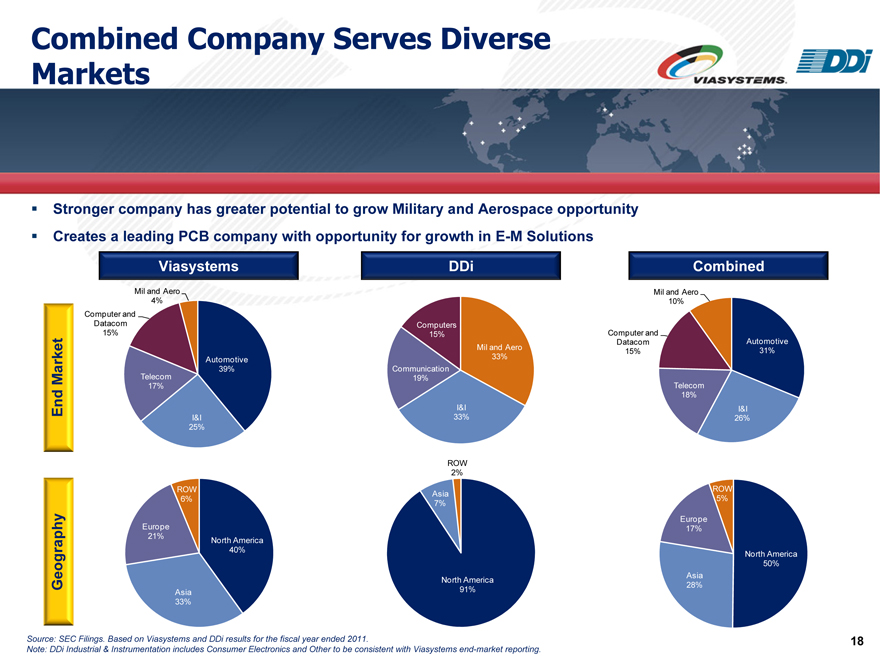
Combined Company Serves Diverse Markets
Stronger company has greater potential to grow Military and Aerospace opportunity Creates a leading PCB company with opportunity for growth in E-M Solutions
Viasystems
DDi
Combined
Mil and Aero 4% Computer and Datacom 15%
Automotive Telecom 39% 17%
I&I 25%
Computers 15%
Mil and Aero 33% Communication 19%
I&I 33%
Mil and Aero 10%
Computer and
Datacom Automotive 15% 31%
Telecom 18%
I&I 26%
End Market
Geography
ROW 6%
Europe 21%
North America 40%
Asia 33%
ROW 2%
Asia 7%
North America 91%
ROW 5%
Europe 17%
North America 50% Asia 28%
Source: SEC Filings. Based on Viasystems and DDi results for the fiscal year ended 2011.
Note: DDi Industrial & Instrumentation includes Consumer Electronics and Other to be consistent with Viasystems end-market reporting.
18
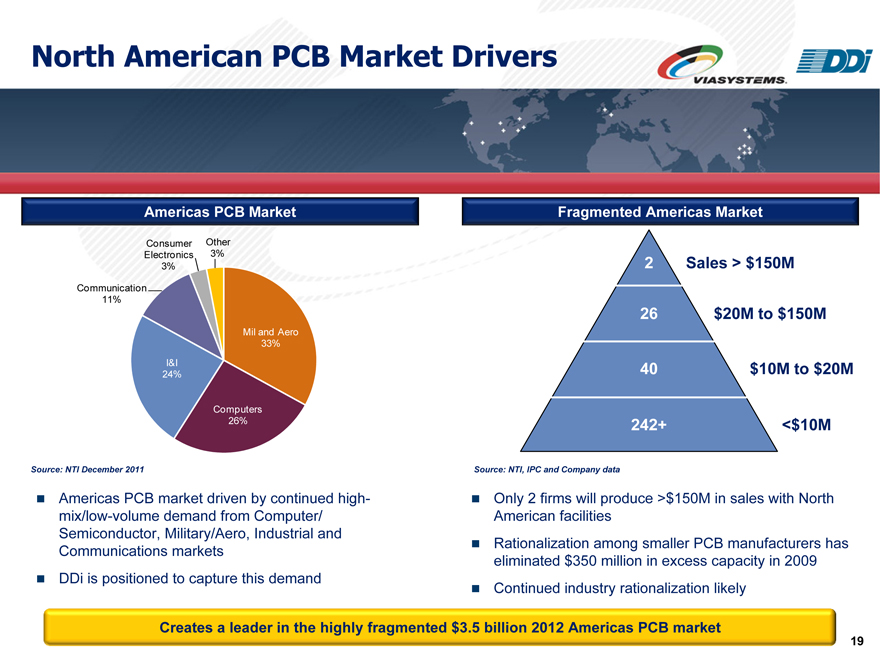
North American PCB Market Drivers
Americas PCB Market
Consumer Other Electronics 3% 3%
Communication 11%
Mil and Aero 33% I&I
24%
Computers 26%
Fragmented Americas Market
2 Sales > $150M
26 $20M to $150M
40 $10M to $20M
242+ <$10M
Source: NTI December 2011
Americas PCB market driven by continued high-mix/low-volume demand from Computer/ Semiconductor, Military/Aero, Industrial and Communications markets
DDi is positioned to capture this demand
Source: NTI, IPC and Company data
Only 2 firms will produce >$150M in sales with North American facilities
Rationalization among smaller PCB manufacturers has eliminated $350 million in excess capacity in 2009
Continued industry rationalization likely
Creates a leader in the highly fragmented $3.5 billion 2012 Americas PCB market
19
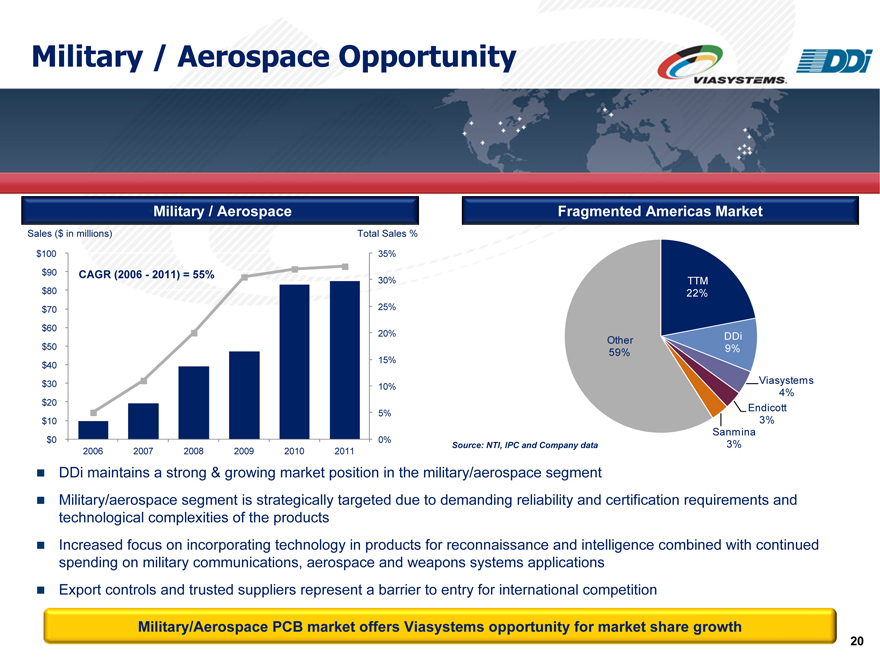
Military / Aerospace Opportunity
•Military / Aerospace
Fragmented Americas Market
Sales ($ in millions)
Total Sales %
$100 $90 $80 $70 $60 $50 $40 $30 $20 $10 $0
CAGR (2006—2011) = 55%
2006 2007 2008 2009 2010 2011
35% 30% 25% 20% 15% 10% 5% 0%
Source: NTI, IPC and Company data
Other 59%
TTM 22%
DDi 9%
Viasystems 4%
Endicott 3%
Sanmina 3%
DDi maintains a strong & growing market position in the military/aerospace segment
Military/aerospace segment is strategically targeted due to demanding reliability and certification requirements and technological complexities of the products Increased focus on incorporating technology in products for reconnaissance and intelligence combined with continued spending on military communications, aerospace and weapons systems applications Export controls and trusted suppliers represent a barrier to entry for international competition
Military/Aerospace PCB market offers Viasystems opportunity for market share growth
20
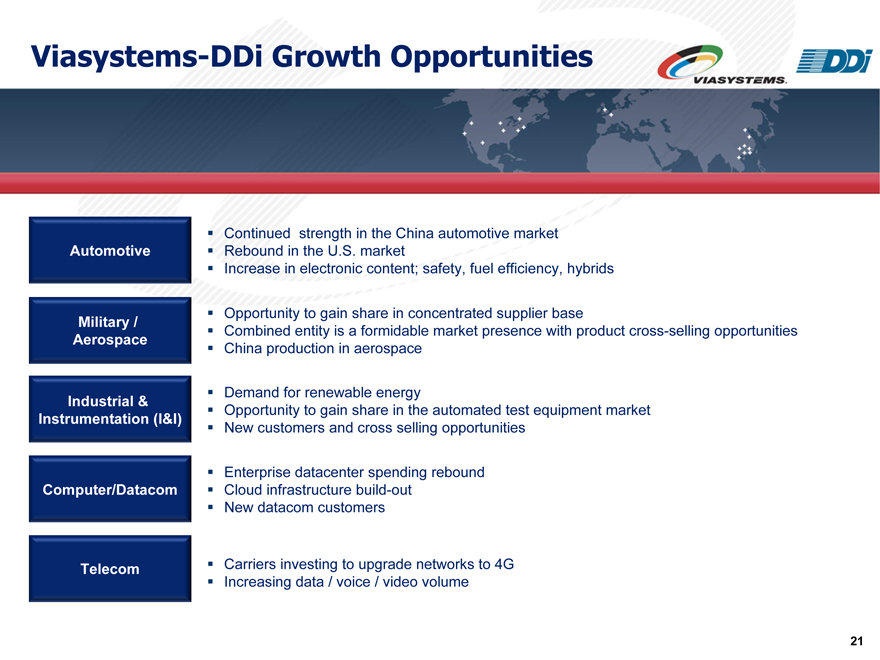
Viasystems-DDi Growth Opportunities
Continued strength in the China automotive market Rebound in the U.S. market
Increase in electronic content; safety, fuel efficiency, hybrids
Opportunity to gain share in concentrated supplier base
Combined entity is a formidable market presence with product cross-selling opportunities China production in aerospace
Demand for renewable energy
Opportunity to gain share in the automated test equipment market New customers and cross selling opportunities
Enterprise datacenter spending rebound Cloud infrastructure build-out New datacom customers
Carriers investing to upgrade networks to 4G Increasing data / voice / video volume
21

III. Financial Highlights
22
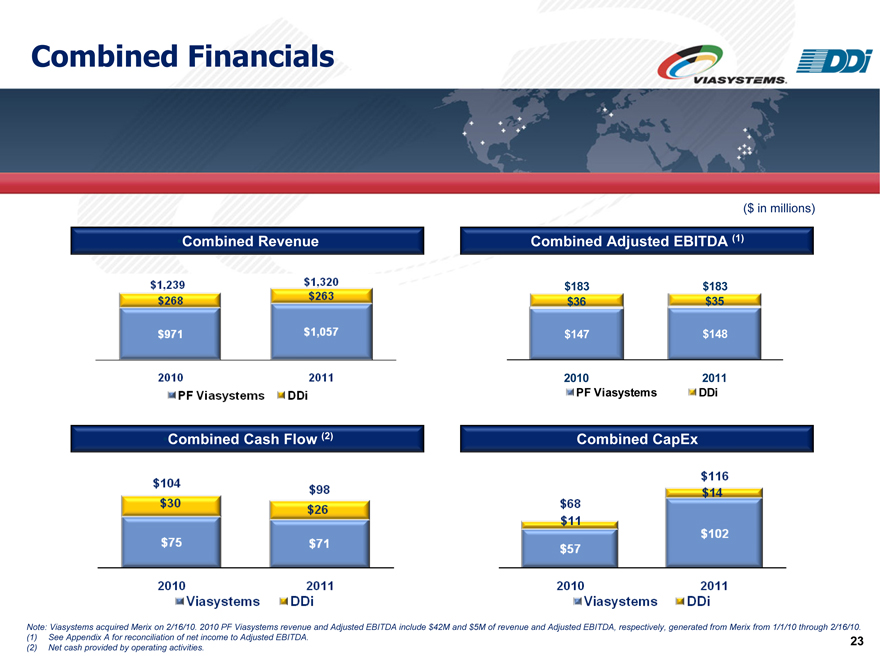
Combined Financials
•Combined Revenue
Combined Adjusted EBITDA (1)
($ in millions)
•Combined Cash Flow (2)
Combined CapEx
Note: Viasystems acquired Merix on 2/16/10. 2010 PF Viasystems revenue and Adjusted EBITDA include $42M and $5M of revenue and Adjusted EBITDA, respectively, generated from Merix from 1/1/10 through 2/16/10. (1) See Appendix A for reconciliation of net income to Adjusted EBITDA. (2) Net cash provided by operating activities.
23
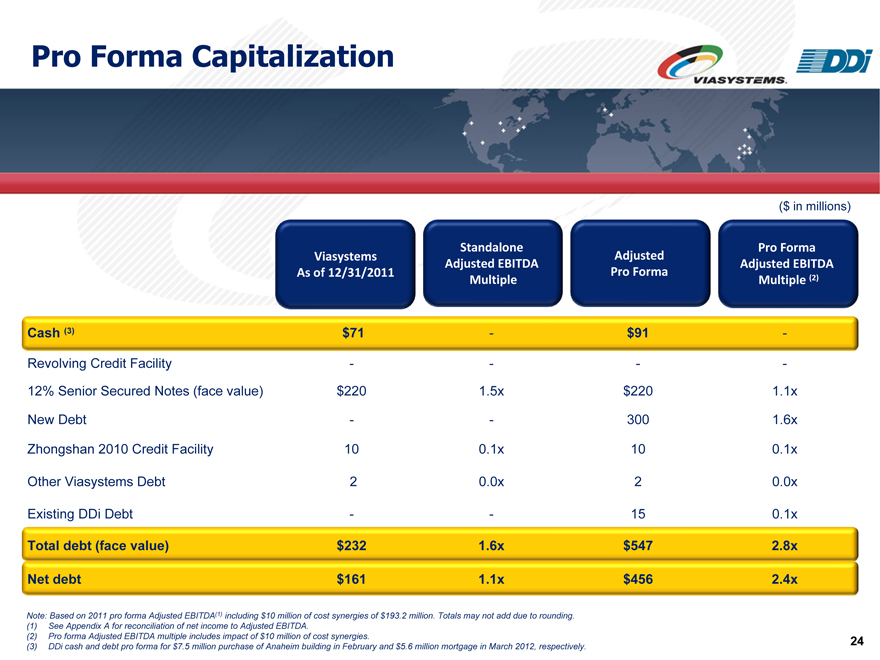
Pro Forma Capitalization
Viasystems As of 12/31/2011
Standalone Adjusted EBITDA
Multiple
Adjusted Pro Forma
Pro Forma Adjusted EBITDA
Multiple (2)
($ in millions)
Cash (3) $71—$91 -
Revolving Credit Facility—— -
12% Senior Secured Notes (face value) $220 1.5x $220 1.1x
New Debt—- 300 1.6x
Zhongshan 2010 Credit Facility 10 0.1x 10 0.1x
Other Viasystems Debt 2 0.0x 2 0.0x
Existing DDi Debt—- 15 0.1x
Total debt (face value) $232 1.6x $547 2.8x
Net debt $161 1.1x $456 2.4x
Note: Based on 2011 pro forma Adjusted EBITDA(1) including $10 million of cost synergies of $193.2 million. Totals may not add due to rounding. (1) See Appendix A for reconciliation of net income to Adjusted EBITDA.
(2) Pro forma Adjusted EBITDA multiple includes impact of $10 million of cost synergies.
(3) DDi cash and debt pro forma for $7.5 million purchase of Anaheim building in February and $5.6 million mortgage in March 2012, respectively.
24
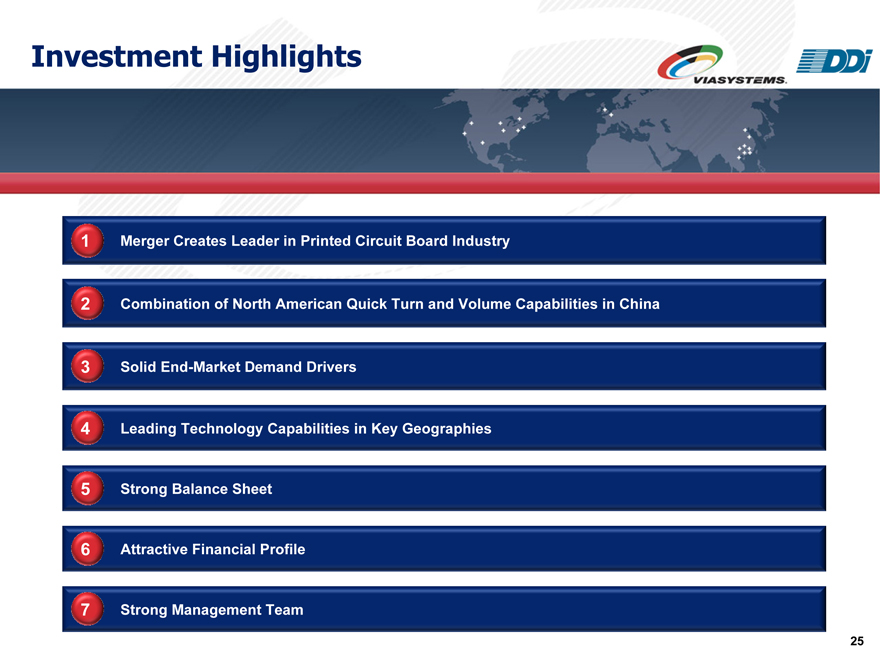
Investment Highlights
1 Merger Creates Leader in Printed Circuit Board Industry
2 Combination of North American Quick Turn and Volume Capabilities in China
3 Solid End-Market Demand Drivers
4 Leading Technology Capabilities in Key Geographies
5 Strong Balance Sheet
6 Attractive Financial Profile
7 Strong Management Team
25
Appendix A. Reconciliation
26
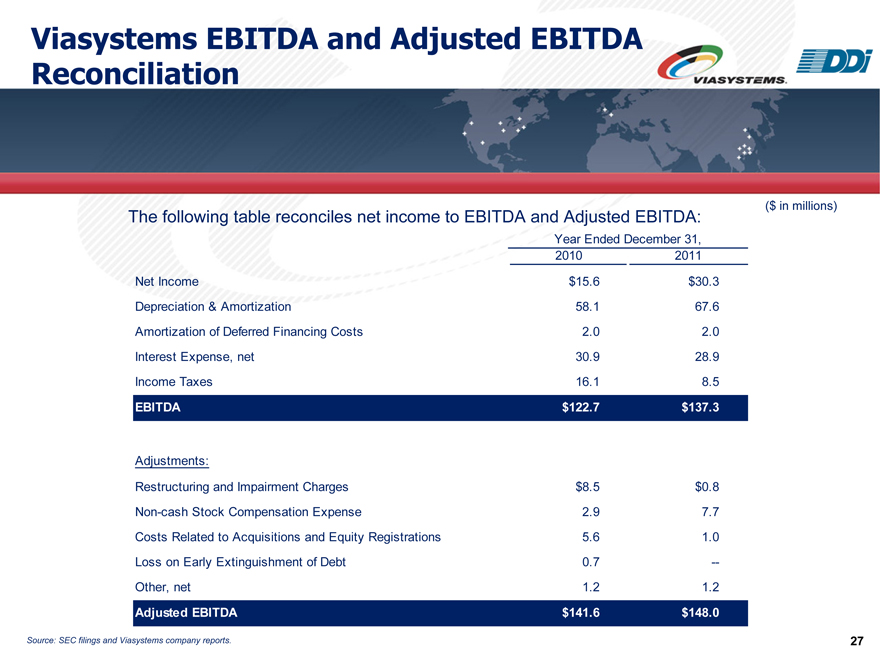
Viasystems EBITDA and Adjusted EBITDA Reconciliation
($ in millions)
The following table reconciles net income to EBITDA and Adjusted EBITDA:
Year Ended December 31, 2010 2011
Net Income $15.6 $30.3 Depreciation & Amortization 58.1 67.6 Amortization of Deferred Financing Costs 2.0 2.0 Interest Expense, net 30.9 28.9 Income Taxes 16.1 8.5
EBITDA $122.7 $137.3
Adjustments:
Restructuring and Impairment Charges $8.5 $0.8 Non-cash Stock Compensation Expense 2.9 7.7 Costs Related to Acquisitions and Equity Registrations 5.6 1.0 Loss on Early Extinguishment of Debt 0.7 —Other, net 1.2 1.2
Adjusted EBITDA $141.6 $148.0
Source: SEC filings and Viasystems company reports.
27
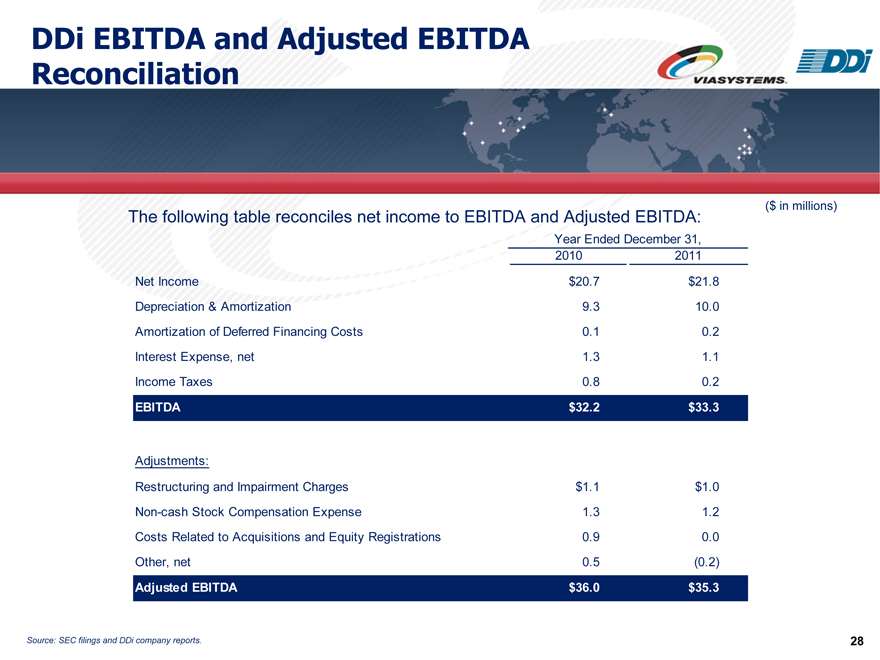
DDi EBITDA and Adjusted EBITDA Reconciliation
($ in millions)
The following table reconciles net income to EBITDA and Adjusted EBITDA:
Year Ended December 31, 2010 2011
Net Income $20.7 $21.8 Depreciation & Amortization 9.3 10.0 Amortization of Deferred Financing Costs 0.1 0.2 Interest Expense, net 1.3 1.1 Income Taxes 0.8 0.2
EBITDA $32.2 $33.3
Adjustments:
Restructuring and Impairment Charges $1.1 $1.0 Non-cash Stock Compensation Expense 1.3 1.2 Costs Related to Acquisitions and Equity Registrations 0.9 0.0 Other, net 0.5 (0.2)
Adjusted EBITDA $36.0 $35.3
Source: SEC filings and DDi company reports.
28
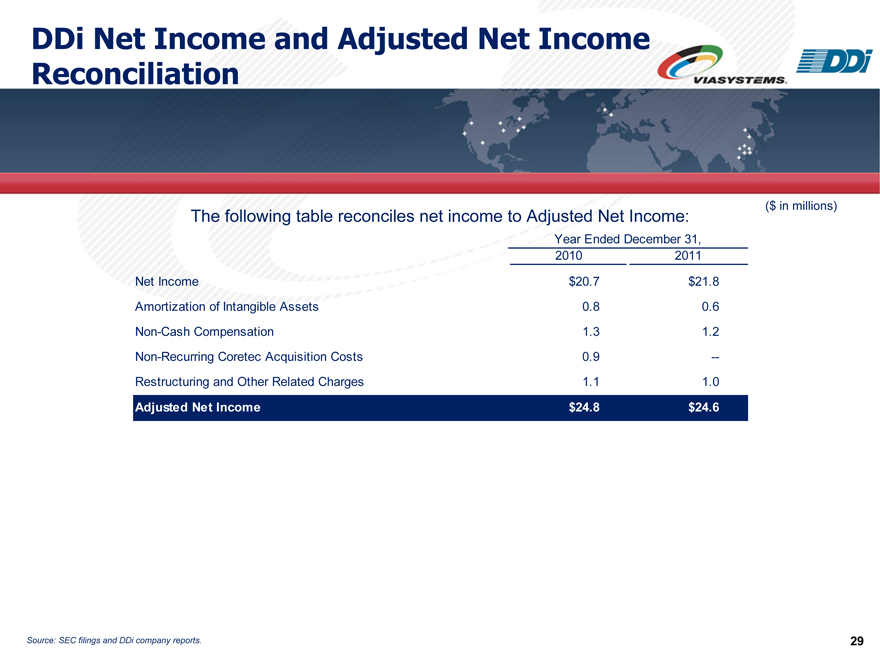
DDi Net Income and Adjusted Net Income Reconciliation
($ in millions)
The following table reconciles net income to Adjusted Net Income:
3Year Ended December 31,
3201032011
Net Income3$20.73$21.8
Amortization of Intangible Assets30.830.6
Non-Cash Compensation31.331.2
Non-Recurring Coretec Acquisition Costs30.93—
Restructuring and Other Related Charges31.131.0
Adjusted Net Income3$24.83$24.6
Source: SEC filings and DDi company reports.
29