INTERIM REPORT
ON
RESERVES AND RESOURCES
ON
SOUTH MINERALIZATION, MACASSA MINE
FOR
KIRKLAND LAKE GOLD INC.
Stewart J. Carmichael, P.Geo. | January 24, 2007 |
TABLE OF CONTENTS
List of Tables
List of Figures
List of Appendices
Diamond drilling and limited drifting on recently discovered gold mineralization south of the Macassa #3 shaft has resulted in expansion of the reserves and resources for the Macassa Mine. Kirkland Lake Gold Inc. KLG) requested the author to prepare interim estimates on both reserves and resources after the first two quarters of KLG’s fiscal 2007 year, from May 1st 2006 to October 31st, 2006. These estimates encompass only new mineralization located 700 feet to 2,000 feet south of the Macassa mine workings and centered between the -4600 and the -5500 foot elevations. The combined mineralized zones cover a strike length of approximately 2,000 feet.
These estimates will again be updated and the end of KLG’s fiscal year and will be included as part of a year end review of resources and reserves for the entire KLG operation.
The estimates detailed in this interim report are made by Stewart J. Carmichael, P.Geo., KLG’s Chief Exploration Geologist. They are in compliance with the requirements of National Instrument 43-101 Standards of Disclosure for Mineral Properties for technical reports.
PROPERTY
The Macassa Mine is in the Municipality of Kirkland Lake within Teck Township, District of Timiskaming, in the eastern part of Northern Ontario, Canada. Macassa is at approximately 48°10’ N Latitude and 80°2’ W Longitude at an elevation of approximately 1000 feet (305 m). Kirkland Lake is approximately 370 miles (600 km) by road north of Toronto.
The Macassa Mine started production in 1933.
KLG holds title to 224 mining claims covering 8842 acres in Teck and Lebel Townships. There are 174 patented claims, 5 crown grants and 45 staked claims.
HISTORY
The Kirkland Lake mining camp has been a prolific gold producer since mining began in 1915. The Macassa Mine and the 4 former producing properties that KLG now owns have produced about 22 million ounces of gold since 1917. The production from these 5 mines accounts for about 90% of the production from the 7 mines in the Kirkland Lake mining camp.
The Macassa Mine started processing ore in October 1933. The first mill on the property began processing the ore at a rate of 200 tons per day. The milling rate increased over the years. In 1988 a new mill was built which could process 500 to 600 tons of rock and 750 tons of tailings per day. The current configuration can process about 1500 tons per day of mine ore.
In 1986, the No. 3 Shaft was sunk from surface to 7,300 ft. This shaft was the deepest single lift shaft in the Western Hemisphere.
Rock burst activity was quite common in the deeper sections of the mines in the Kirkland Lake camp. Macassa was not an exception and in November 1993 a rock burst collapsed 2 stopes at the 6700 level and in April 1997 damaged the No. 3 shaft at the 5800 level. Both these occurrences created work stop interruptions at the mine otherwise it would have operated continuously from 1933 to 1999. The rock burst on April 12, 1997 limited mining to levels between 4,250 ft. and 5,150 ft.
Operations at Macassa were suspended in 1999 due to the declining price of gold. The workings were allowed to flood in 2000.
From 1933 to 1999, Macassa produced about 3.5 million ounces of gold from 7.9 million tons of ore. The head grade during that period averaged 0.47 oz Au/ton and the recovered grade was 0.45 oz Au/ton.
In May of 2002 the Macassa mill was restarted and processed Lake Shore tailings at a rate of 880 tons per day. An additional 45 thousand tons of surface rock from Lake Shore and the Teck-Hughes properties were also processed.
In December 2002 underground mining at Macassa recommenced.
CORPORATE HISTORY
Macassa Mines Ltd. was incorporated in 1926 and evolved through a succession of mergers and acquisitions to become a division of Lac Minerals Ltd. in 1982. This consolidated the properties of the Little Long Lac group into the one entity and the Macassa Mine and the other Kirkland Lake properties were included.
Lac Minerals was acquired by Barrick Gold Corporation in August 1994. After a short period of operation by Barrick the property was sold to Kinross in May 1995. KLG purchased the Kirkland Lake properties of Kinross in December 2001. This purchase included the Macassa Mine and all of the plant.
KLG purchased the mining assets that Kinross owned in and around Kirkland Lake for $5 million and the assumption of $2 million in reclamation bond obligations related to the closure plan for the properties. In addition, royalties must be paid to Kinross and previous property holders.
REGIONAL GEOLOGY
The Kirkland Lake mining camp is located in the west portion of the Archean Abitibi greenstone belt of the Abitibi Subprovince that forms part of the Superior Province in the Precambrian Shield.
The Timiskaming Group of rocks is the main feature of the Kirkland Lake area. It is up to 10,500 feet thick and extends for about 40 miles from Kenogami Lake in the west to the Quebec border in the east. In the Kirkland Lake area, the Timiskaming is predominantly conglomerates and sandstones, trachytic lava flows and pyroclastic tuffs. The Timiskaming trends N65°E and dips steeply south at Kirkland Lake. Immediately east of Kirkland Lake, the formations are warped to an east-southeast direction and then return to an east-northeast direction at Larder Lake and continue this way to the Québec border.
The Timiskaming sediments are intruded by syenite porphyries and lamprophyre dykes and sills. Alkali stocks have intruded the Timiskaming Group and the supracrustal assemblage along the south margin of the synclinorium. Matachewan diabase dykes trending north-northeast cut all rocks in the area.
At the Macassa Mine the Timiskaming tuffs, conglomerates and the syenite porphyries are encountered. The syenites are the preferential hosts of the gold mineralization. Most of the mine workings are also in the syenites.
The Kirkland Lake-Larder Lake Break, and its associated splay faults and fracture system, forms a complex, major structural feature which transects and follows the trend of the Timiskaming Group at Kirkland Lake. This Break can be traced for about 200 miles from Matachewan in the west of Kirkland Lake all the way to the Grenville Front east of Louvicourt, Quebec. As well as Kirkland Lake, it passes through, or near, the important mining areas of Larder Lake, Rouyn-Noranda, Cadillac, Malartic, Val d’Or and Louvicourt. Numerous gold occurrences and gold mines are spatially related to this regional structure.
The fault or break system that hosts the Kirkland Lake gold deposits is north of the main Kirkland Lake-Larder Lake Break.
At Macassa, the Kirkland Lake structures have been mined from 2,175 ft. to 5,600 ft. (660 m to 1,700 m) with the Main Break being the most important zone in the eastern part of the mine. The ‘04’ Break is in the western part of the property and is the main producing break at Macassa. It has been mined from the 4375 Level (1,330 m) to the bottom of the mine and it is known to continue deeper.
KLG has discovered the D zones and other zones to the south of the historically productive main structures in the Kirkland lake Camp. These significant new zones are flatter lying and strike almost perpendicular to the main structures. The D zones strike generally to the NE and dip at about 35° to the south.
Within the past three years a new mineralized system has been discovered located between 700 and 2,000 feet south of the `04 Break. At this time the relationship between the new mineralization to the south and the `04 Break is still under study.
The following report by Kirkland Lake Gold Inc. (KLG) is interim summary on reserve and resource estimates for recently discovered mineralization south of the Macassa Mine for the first two quarters of fiscal year 2007 (May 1st 2006 to October 31st 2006). New drilling data from the mineralization being generated on a weekly basis and KLG requested the geological department to prepare an interim reserve and resource estimate as part of an exploration update. The geological department was tasked with providing this update for the first two quarters of KLG fiscal year 2007. These estimates have been completed by KLG geological staff in accordance with the requirements of National Instrument 43-101 Standards of Disclosure for Mineral Properties.
This report is intended to be an update to the estimates completed by and reported by Glenn R. Clark, P. Eng on July 18, 2006 titled “Review Of Resources and Reserves, Macassa Mine, Kirkland Lake, Ontario” (2006 Clark Report). A full review of the entire KLG operation will be completed and reported by Mr. Clark upon completion of the fiscal year 2007 with a report completion date in mid to late July, 2007. Glenn Clark has been retained by KLG on an annual basis since 2005 to audit reserves and resources for KLG.
There are a number of previous reports regarding the Macassa Mine. The information in these technical reports and the information supplied by KLG has been relied upon for this review. The most recent report, the 2006 Clark Report, is available on the KLG web site (www.klgold.com). Reports prepared by the Mine staff dated April 30, 2004 and April 30, 2003 are also available on KLG’s web site. Both of these staff reports, a 2005 report by Glenn R. Clark & Associates Limited, the 2006 Clark Report and a report by Roscoe Postle Associates Inc. (RPA) “Review of Mineral Resources and Mineral Reserves of the Macassa Mine Property, Kirkland Lake, Ontario” dated December 23, 2002, have also been filed on SEDAR (www.Sedar.com). A list of references is available in Appendix B attached to this report.
The author of this report meets all requirements defined in the National Instrument 43-101 as a “qualified person” in respect to this report and is currently employed as the Chief Exploration Geologist for KLG.
Resource and reserve calculations are based on chip sampling of the veins and diamond drill hole results.
This report refers extensively to statements and definitions taken from the 2006 Clark Report. They have been used with permission from Glenn R. Clark. The 2006 Clark Report was filed on SEDAR on August 1, 2006.
The reader is asked to refer to the 2006 Clark Report for definitions, methodology and other criteria used to form the basis of the resource and reserve estimates outline in this report. The methodology used in the estimates detailed in this report follow the methodology outlined in the 2006 Clark Report.
The resources and reserves in this report have been classified to meet the requirements of NI 43-101.
The Reserve and Resource estimation classifications as prescribed in National Instrument 43-101 are given here for clarity.
MINERAL RESOURCE
Mineral Resources are sub-divided into 3 categories depending on the geological confidence. The highest level or the level with the most confidence is the ‘Measured’ category. The next level of confidence is the ‘Indicated’ category and the lowest level, or the resource with the least confidence, is the ‘Inferred’ category.
INFERRED MINERAL RESOURCE
An ‘Inferred Mineral Resource’ is that part of a Mineral Resource for which quantity and grade or quality can be estimated on the basis of geological evidence and limited sampling and reasonably assumed, but not verified, geological and grade continuity. The estimate is based on limited information and sampling, gathered through appropriate techniques from locations such as outcrops, trenches, pits, workings and drill holes.
INDICATED MINERAL RESOURCE
An ‘Indicated Mineral Resource’ is that part of a Mineral Resource for which quantity, grade or quality, densities, shape and physical characteristics, can be estimated with a level of confidence sufficient to allow the appropriate application of technical and economic parameters, to support mine planning and evaluation of the economic viability of the deposit. The estimate is based on detailed and reliable exploration and testing information gathered through appropriate techniques from locations such as outcrops, trenches, pits, workings and drill holes that are spaced closely enough for geological and grade continuity to be reasonably assumed.
MEASURED MINERAL RESOURCE
A ‘Measured Mineral Resource’ is that part of a Mineral Resource for which quantity, grade or quality, densities, shape and physical characteristics are so well established that they can be estimated with confidence sufficient to allow the appropriate application of technical and economic parameters, to support production planning and evaluation of the economic viability of the deposit. The estimate is based on detailed and reliable exploration, sampling and testing information gathered through appropriate techniques from locations such as outcrops, trenches, pits, workings and drill holes that are spaced closely enough to confirm both geological and grade continuity.
MINERAL RESERVE
Mineral Reserves are sub-divided into 2 categories. The highest level of Reserves or the level with the most confidence is the ‘Proven’ category and the lower level of confidence of the Reserves is the ‘Probable’ category. Reserves are distinguished from resources as all of the technical and economic parameters have been applied and the estimated grade and tonnage of the resources should closely approximate the actual results of mining. The guidelines state “Mineral Reserves are inclusive of diluting material that will be mined in conjunction with the Mineral Reserves and delivered to the treatment plant or equivalent facility.” The guidelines also state “The term ‘Mineral Reserve’ need not necessarily signify that extraction facilities are in place or operative or that all government approvals have been received. It does signify that there are reasonable expectations of such approvals.”
PROBABLE MINERAL RESERVE
A ‘Probable Mineral Reserve’ is the economically mineable part of an Indicated and in some circumstances a Measured Mineral Resource demonstrated by at least a Preliminary Feasibility Study. This Study must include adequate information on mining, processing, metallurgical, economic, and other relevant factors that demonstrate, at the time of reporting, that economic extraction can be justified.
PROVEN MINERAL RESERVE
A ‘Proven Mineral Reserve’ is the economically mineable part of a Measured Mineral Resource demonstrated by at least a Preliminary Feasibility Study. This Study must include adequate information on mining, processing, metallurgical, economic, and other relevant factors that demonstrate, at the time of reporting, that economic extraction is justified.
All of the assay data is plotted on plans and sections to be used for zone interpretations.
The ore reserves are calculated on 20 scale longitudinal sections or plan views in the case of veins dipping less than 45 degrees.
Each stope area has a section or plan and a work sheet that is kept on file.
The calculated grade, zone width, area of influence and resource or reserve category for each data set (ie. drill hole or chip sample assays) is entered into a spread sheet. For reserves the expected dilution based on the assumed mining method is included. A separate page for each stope area is kept.
MINIMUM WIDTH
The minimum mining width for steep-dipping structures is 5 feet with a minimum zonal dip of forty-five degrees.
The minimum mining height for flat structures is 6.5 ft for a zonal dip of less than forty-five degrees.
MINIMUM STRIKE LENGTH
The minimum strike length for a block is 21 ft (3 sets of chip assays).
AREAS OF INFLUENCE
The radius of influence from a sampled heading is 30 ft. for Measured Resource/Proven Reserve(MR/PR).
A MR/PR Block must be exposed by at least one drift and tested between drifts by drilling in a 25 to 30 ft. pattern. Where continuity is proven with the drilling, the intervening polygons that are based on the 25 to 30 ft. drill pattern may be considered as MR/PR blocks.
For an Indicated Resource/Probable Reserve (IR/PbR) block the radius of influence is an additional 50 ft. (30-80 feet from the data). This applies to blocks sampled on two sides by workings a maximum of 150 ft. apart where no drilling exists, or above and below a drift where drill hole spacing is greater than 100 ft. For blocks with only drilling, 50’ radius is used.
Inferred Resource blocks are an additional 50 feet from the IR/PR block (from 80 to 130 ft. from the data). This applies to blocks bounded on one side by a MR/PR or IR/PbR. Blocks on a proven mineralized trend that are drilled on a spacing of greater than 100 ft. are included as Inferred Resource.
Raises that have been bored are usually ignored in the calculations. Most of the raises are only 42-60” in diameter, and are not representative of the ore width.
Test hole, and drift muck data is not used for ore reserve calculations.
The resource and reserve estimates detailed in this report are based for the most part of drill hole core. Only one zone, the Lower D North, has been drifted on at the time of these estimates.
DENSITY OF ORE
The density or tonnage factor used to convert the volume of the blocks to tons is 11.7 cu ft/ton.
The South Zone and Lower D zone volumes were converted at a density of 11.5 cu ft/ton.
The density traditionally used in the camp was 12.0 cu ft/ton. There have been a number of studies that suggest that the traditional number was too high and consequently gave an understated tonnage. The difference in the tonnage estimate is only about 2.5% between the density used in the past and the current density being used. As this has been applied to all blocks the changed density does not affect the reserve grades.
Further density testing in 2005 and 2006 has confirmed the densities used in the resource and reserve calculations. Additional density testing for the new mineralization south of the mine workings is on-going.
CUT-OFF GRADE
Cut-off grades of both 0.25 oz Au/ton and 0.30 oz Au/ton are used for resource and reserve calculations depending on the location and economics of the block. Generally a cut-off of 0.32 is required on a whole-block basis to achieve profitability. For mining or geotechnical reasons some sub-blocks below the cut-off may be included. Blocks that grade between 0.20 and the cut-off are classified as resource blocks.
CAPPING OF ASSAYS
Macassa used to use a more complex system for cutting assays than it does now. The capping system, currently in use, is based on a Kinross report by B. Davis (1995). It appears that this simpler single cap method gives much the same results as the old system. It is probably not the final answer. As new ore is found in different settings the capping procedure may need to be modified.
The effect of grade capping can only be truly examined when a large tonnage has been mined and the recovered gold can be compared with the forecast for that period.
Grade capping or cutting is necessary at Macassa and assays higher than 3.5 oz Au/ton are cut to 3.5 oz.
DILUTION OF RESERVES
The dilution applied to the reserves depends on the type of stope that is anticipated for the mining blocks. The dilution is added on a stope basis. All dilution is assigned a grade of 0.02 oz Au/ton.
Long hole stopes are diluted by 32-50%, mostly 32%.
Cut-and-fill stopes 5-7 feet wide are diluted 15-24%. Some of the narrower stopes are diluted by 32%.
Cut-and-fill stopes that are greater than 7 feet wide are diluted 10-15%.
The dilution factors are based on a comprehensive study by Barrick in 1994.
The average dilution of the reserves outlined in this report is 32%. These dilution levels can be obtained with good mining plans and careful supervision of the miners.
Dilution has not been added to the resource blocks.
MINING RECOVERY
The recovery of the ore blocks is anticipated at 94.2% of the diluted reserve.
This figure has been applied to all of the reserve blocks but not to the resource blocks.
GOLD PRICE
The gold price used to establish the cut-off grades has been set at $541 Canadian. This is based on the average price for gold and the exchange rate in the past three years and was used in the 2006 Clark Report. ($US429.58 and $C1.00= $US0.794)
The procedures used for sampling and assaying of drill core, chip and muck samples are detailed in the 2006 Clark Report. There is no variation the procedures used in the estimates outline in this report.
Mineralized systems discovered by KLG geological staff over the past three years differs in many respects to the classic, historically mined areas in the Kirkland Lake camp. Though typical “Break” style lode quartz mineralization is present, many of the new mineralize zones are characterized by carbonate-altered tuff and porphyry mineralized with up to 15% disseminated pyrite, averaging of 8-10% pyrite. Accessory minerals include telluride, traces of chalcopyrite, molybdenite and/or graphite and visible gold. The mineralization is similarly structurally controlled by shearing, mylonitic fault zone and breaks. Silver is present both amalgamated with the gold and in tellurides. Higher grades in some of the recently discovered mineralized zones are often associated with elevated pyrite content. Preliminary recoveries of some of the new mineralized zones are consistent with the rest of the mine and additional bench scale recovery tests are ongoing.
The new mineralized systems exhibit variable geometry with dips varying from 20 degrees to 60 degrees averaging 40 to 45 degrees. The largest single zone of mineralization, termed the “New South Zone” exhibits an average dip of 20 degrees locally increasing to 40 degrees. Variations in strike geometry are present as well; the Lower D Zone trends near north-south astronomic or 57 degrees from the main mine trend.
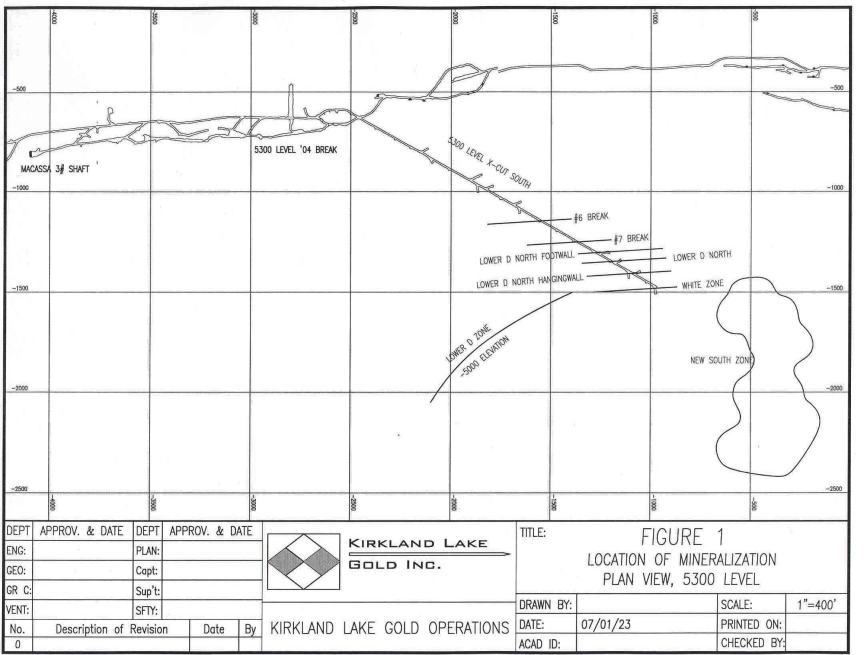
Access for drilling the new zones is facilitated by a line drive drift cross cut from the Macassa 5300 level which has been driven a linear distance of 1,700 feet, the end of which is located 1,100 feet south of the main portion of the 5300 level drift. (see figure 1)
A number of small drill bays were excavated during the driving of this cross cut to facilitate diamond drilling with small air-powered machines. At the time of this report a total of 55 diamond drill holes have been completed from the cross cut. These holes have complimented earlier drilling completed with larger electric hydraulic machines and have greatly increased the rate at which information on the various mineralized zones is being generated. Drilling has been undertaken at 100 foot centers and pierce points from which the resource and reserve estimates are derived from are generally at 100 foot intervals or less.
Using the prescribed methodology outlined in the 2006 Clark Report, the author has estimated the resources and reserves for new mineralization to the south as shown in the table below. The classifications are in keeping with the guidelines in the NI 43-101.
The resource estimates do not include the reserves.
The reserve estimates are recoverable, diluted and in-situ.
The estimates in this report cover an area from 700 feet to 2,000 feet south of the Macassa mine workings and centered between the -4600 and -5500 foot elevations. The combined mineralization zones cover a strike length of approximately 2,000 feet.
The Proven and Probable Reserves are only 94.2% of the estimated size of the zones to allow for recovery losses due to pillars and other reasons.
The Proven and Probable Reserves are considered recoverable by mining.
The Measured and Indicated Resources have not been diluted and a recovery factor has not been applied.
ESTIMATED PROVEN AND PROBABLE RESERVES FOR SOUTH ZONES | ||||||
Location | Proven | Probable | Total | |||
Tons | Grade | Tons | Grade | Tons | Grade | |
South Zones | 1,200 | 0.84 | 269,000 | 0.62 | 270,200 | 0.62 |
Total | 1,200 | 0.84 | 269,000 | 0.62 | 270,200 | 0.62 |
| Note 1: Mining of the reserves below the 5300 Level is dependent on the current restriction imposed by the Ministry of Labour being removed. There is a reasonable expectation that this will be done when KLG presents a new mining plan. |
The total of the Estimated Proven and Probable Reserves at October 31, 2006 is 270,200 tons at a grade of 0.62 oz Au/ton.
ESTIMATED MEASURED AND INDICATED RESOURCES FOR SOUTH ZONES | ||||||
Location | Measured | Indicated | Total | |||
Tons | Grade | Tons | Grade | Tons | Grade | |
South Zones | 0 | 184,000 | 0.74 | 184,000 | 0.74 | |
Total | 0 | 184,000 | 0.74 | 184,000 | 0.74 | |
The total of the Estimated Measured and Indicated Resources at October 31, 2006 is 184,000 tons at a grade of 0.74 oz Au/ton.
In addition, there is an estimated 563,000 tons at a grade of 0.71 oz Au/ton that is classified as an Inferred Resource.
A more detailed distribution of the resources and reserves are shown in Appendix C.
Newly discovered mineralization to the south of the Macassa
Mine differs from the typical `04 Break ore system. The main differing characteristic is an increase in pyrite mineralization compared the classic quartz vein style of mineralization. The new mineralized zones each individually exhibit variations in mineralogy and KLG geological staff are required to maintain their diligence with regard to ore density and recoveries.
It is recommended that further testing for ore densities and gold recoveries should be completed.

Stewart J. Carmichael, P.Geo.
Chief Exploration Geologist
CERTIFICATE OF QUALIFICATIONS
I, Stewart J. Carmichael, P.Geo. do hereby certify that:
1. | I am currently employed as the Chief Exploration Geologist by Kirkland Lake Gold Inc., P.O. Box 370, Kirkland Lake, Ontario P2N 3J1, Canada. I have been employed by Kirkland Lake Gold Inc. since April 2002. |
2. | I graduated with a Bachelor of Science degree, from McMaster University, Hamilton Ontario, in 1982. |
3. | I am a Professional Geoscientist, registered as a Geoscientist with the Association of Professional Geoscientists of Ontario, Canada; Registration number 0455. |
4. | I have been engaged in mineral exploration and mine development for more than twenty-four years. |
5. | As a result of my experience and education, I am a “Qualified Person” as defined in National Policy 43-101. |
6. | I am the author of the report entitled “Interim Report on Reserves and Resources on South Mineralization, Macassa Mine for Kirkland Lake Gold Inc.” dated January 24, 2007 This report is based on the examination of the available data including previous reports. |
7. | The sources of all information are noted in the report. The information provided by the various parties to the best of my knowledge and experience is correct. |
8. | I reported on the Resources and Reserves for Kirkland Lake Gold Inc. on August 30, 2003 and August 30, 2004. |
| 9. | I have read National Instrument 43-101 and Forms 43-101F1. This report has been prepared in compliance with these documents. |
| 10. | I am not aware of any material fact or material change with respect to the subject matter of the Technical Report that is not reflected in the Technical Report, the omission to disclose which makes the Technical Report misleading. |
| 11. | I am not independent of Kirkland Lake Gold Inc., however, under National Instrument 43-101 I am not required to be independent to prepare this report. |
| 12. | As of the date of this certificate, to the best of my knowledge, information and belief, the report contains all scientific and technical information that is required to be disclosed to make the report not misleading. |
Dated this 24th day of January, 2007
Stewart J. Carmichael P.Geo.
References
There are a number of previous reports regarding the Macassa Mine. The information in these technical reports and the information supplied by Kirkland Lake Gold was relied upon for this review.
- Charlewood, G. H. (1964): Geology of deep developments on the Main Ore Zone at Kirkland Lake. Ontario Department of Mines Geological Circular No. 11, 49 p.
- Canadian Institute of Mining, Metallurgy and Petroleum (2000): Resource and reserve definitions CIM standards on mineral resources and reserves - definitions and guidelines. CIM Bulletin, Vol. 93, No.1044, p.53-60.
- Clark, Glenn R. (2006): Review Of Resources and Reserves, Macassa Mine, Kirkland Lake, Ontario. Dated July 18, 2006.
- Clark, Glenn R. (2005): Review Of Resources and Reserves, Macassa Mine, Kirkland Lake, Ontario. Dated September 9, 2005.
- Jensen, L. L. and Langford, F. F. (1985): Geology and petrogenesis of the Archean Abitibi Belt in the Kirkland Lake area, Ontario. Ontario Geological Survey Miscellaneous Paper 123.
- Ridler, Roland (2001): Technical report on Kirkland Lake mineral properties (Macassa Mine, Kirkland Lake Gold, Teck-Hughes, Lake Shore, Wright-Hargreaves) located in Kirkland Lake, Ontario, Canada for Kirkland Lake Gold Inc. Published Kirkland Lake Gold Inc. report, November 30, 2001, 71 p.
- Rhys, David (2006): Summary of June-July, 2006, Structural Work at the Macassa Mine. Unpublished structural geology memo prepared for Kirkland Lake Gold Inc. by Panterra Geoservices Inc. dated August 19, 2006.
- Rhys, David (2005): Structural Study Of The Kirkland Lake Gold System, Ontario With Exploration Implications Unpublished structural geology report prepared for Kirkland Lake Gold Inc. by Panterra Geoservices Inc. dated October 31, 2005.
- Sutton, M and Carmichael, S. (2003): Kirkland Lake Gold Inc. Mneral Resources and Mineral Reserves of the Macassa Mine Property, Kirkland Lake, Ontario, April 30, 2003, dated August 30, 2004.
- Sutton, M and Carmichael, S. (2004): Kirkland Lake Gold Inc. Mineral Resources and Mineral Reserves of the Macassa Mine Property, Kirkland Lake, Ontario, April 30, 2004, dated August 30, 2004.
- Rennie, D.W., Routledge, R.E. (2002): Roscoe Postle Associates Inc. Review of Mineral Resources and Mineral Reserves of the Macassa Mine Property, Kirkland Lake dated December 23, 2002.
- Toronto Stock Exchange and Ontario Securities Commission (1999): Setting new standards; recommendations for public mineral exploration and mining companies; Mining Standards Task Force final report. TSE Publications, January 1999, 141 p.
DETAILED ESTIMATE SUMMARY, SOUTH ZONES ONLY
BLOCK NAME | MEASURED RESOURCES | INDICATED RESOURCES | INFERRED RESOURCES | PROVEN ORE | PROVABLE ORE | ||||||||||||
| Tons | oz/t | Au oz | Tons | oz/t | Au oz | Tons | oz/t | Au oz | Dilution | Tons | oz/t | Au oz | Tons | oz/t | Au oz | ||
| 4714.37 | #6 | 3,278 | 0.41 | 1,344 | |||||||||||||
| 5020.37A | #6 | 4,194 | 0.44 | 1,865 | 23 | 0.56 | 13 | ||||||||||
| 5020.37B | #6 | 4,327 | 0.41 | 1,774 | |||||||||||||
| 5017.37 | #6 Splay | 9,613 | 0.38 | 3,672 | 32% | 10,314 | 0.58 | 5,989 | |||||||||
| 5019.37 | #6 Splay | 7,311 | 1.28 | 9,331 | |||||||||||||
| 5021.37 | #6 Splay | 2,002 | 1.13 | 2,262 | |||||||||||||
| 5308.37 | White Zone | 17,773 | 1.28 | 22,729 | 20,597 | 1.10 | 22,664 | ||||||||||
| 5310.37 | Lower D North HW | 28,266 | 0.59 | 16,585 | 31,443 | 0.63 | 19,880 | ||||||||||
| 5319.47 | Lower D | 6,875 | 0.18 | 1,244 | 95,627 | 0.75 | 71,788 | 35% | 76,835 | 0.65 | 49,636 | ||||||
| 5318.47 | Lower D Splay | 29,306 | 0.51 | 15,077 | |||||||||||||
| 5307.27 | Lower D North FW | 4,648 | 0.36 | 1,661 | 7,624 | 0.54 | 4,088 | ||||||||||
| 5317.37 | #7 | 6,811 | 0.37 | 2,490 | 34,036 | 0.85 | 29,021 | 32% | 47,746 | 0.85 | 40,591 | ||||||
| 5306.27 | Lower D North | 30,688 | 0.88 | 27,119 | 17,655 | 0.57 | 10,147 | ||||||||||
| 5312.37 | Lower D North | 19,991 | 0.79 | 15,847 | 30,781 | 0.82 | 25,158 | ||||||||||
| 5313.37 | Lower D North FW | 22,989 | 0.51 | 11,819 | 20,175 | 0.56 | 11,259 | 32% | 1,181 | 0.84 | 990 | ||||||
| 5316.37 | #6 | 13,303 | 0.73 | 9,698 | 12,213 | 0.75 | 9,188 | ||||||||||
| 5315.37 | #7 FW | 2,818 | 1.13 | 3,191 | 2,589 | 0.70 | 1,813 | ||||||||||
| 5604.37 | New S. | 18,192 | 0.73 | 13,232 | 242,029 | 0.71 | 172,455 | 32% | 133,932 | 0.53 | 71,296 | ||||||
TOTAL | 183,860 | 0.74 | 136,811 | 563,316 | 0.71 | 401,604 | 1,181 | 0.84 | 990 | 268,828 | 0.62 | 167,512 | |||||
FIGURE 1