Exhibit 99.3
Filed by Dynegy Acquisition, Inc.
Pursuant to Rule 425 of the Securities Act of 1933, as amended, and
deemed filed pursuant to Rule 14a-12 of the Securities Exchange Act of 1934, as amended
Subject Company: Dynegy Inc.
Commission File No: 001-15659
Executing our Growth and Value Vision Investor Presentation September 15, 2006 Dynegy Investor and Public Relations: John Sousa, Vice President Hillarie Forister, Senior Analyst (713) 507-6466 ir@dynegy.com |
2 CONFIDENTIAL Growth • Value • Vision FORWARD-LOOKING STATEMENTS FORWARD-LOOKING STATEMENTS This presentation includes statements that do not directly or exclusively relate to historical facts. Such statements are “forward-looking statements” within the meaning of Section 27A of the Securities Act of 1933 and Section 21E of the Securities Exchange Act of 1934. These forward-looking statements include statements regarding benefits of the proposed transaction, expected synergies and anticipated future financial operating performance and results, including estimates of growth. These statements are based on the current expectations of Dynegy’s management. There are a number of risks and uncertainties that could cause actual results to differ materially from the forward- looking statements included in this document. For example: The company may be unable to obtain shareholder approval required for the transaction; the company may be unable to obtain regulatory approvals required for the transaction, or required regulatory approvals may delay the transaction or result in the imposition of conditions that could have a material adverse effect on the company or cause the companies to abandon the transaction; conditions to the closing of the transaction may not be satisfied; problems may arise in successfully integrating the operations of the companies, which may result in Dynegy not operating as effectively and efficiently as expected; Dynegy may be unable to achieve expected synergies or it may take longer than expected to achieve the synergies; the transaction may involve unexpected costs or unexpected liabilities, or the effects of purchase accounting may be different from the companies’ expectations; the businesses of the companies may suffer as a result of uncertainty surrounding the transaction; the industry may be subject to future regulatory or legislative actions that could adversely affect the companies; and the companies may be adversely affected by other economic, business, and/or competitive factors. Additional factors that may affect the future results of Dynegy are set forth in its filings with the Securities and Exchange Commission, which are available free of charge on the SEC's web site at www.sec.gov. In connection with the LS Power transaction announced on September 15, 2006, Dynegy will file a proxy statement/prospectus with the SEC. INVESTORS AND SECURITY HOLDERS ARE URGED TO CAREFULLY READ THE IMPORTANT INFORMATION CONTAINED IN THE MATERIALS REGARDING THE PROPOSED TRANSACTION WHEN IT BECOMES AVAILABLE. IT WILL CONTAIN IMPORTANT INFORMATION ABOUT DYNEGY, LS POWER, THE NEW COMPANY AND THE PROPOSED TRANSACTION. Investors and security holders will be able to obtain a copy of the proxy statement/prospectus and other documents containing information about Dynegy and LS Power, free of charge, at the SEC’s web site at www.sec.gov and at Dynegy’s web site at www.dynegy.com. Copies of the proxy statement/prospectus may also be obtained by writing Dynegy Inc. Investor Relations, 1000 Louisiana Street, Houston, Texas 77002 or by calling 713-507-6466. Dynegy, LS Power and their respective directors and executive officers and other members of management and employees may be deemed to be participants in the solicitation of proxies from Dynegy’s shareholders in respect of the proposed transaction. Information regarding Dynegy’s directors and executive officers is available in the company’s proxy statement for its 2006 Annual Meeting of Shareholders, dated April 3, 2006. Additional information regarding the interests of such potential participants will be included in the forthcoming proxy statement/prospectus and other relevant documents filed with the SEC when they become available. Non-GAAP Financial Measures: We use the non-GAAP financial measures “EBITDA” and “free cash flow” in these materials. EBITDA is a non-GAAP financial measure. Consolidated EBITDA can be reconciled to Net income (loss) using the following calculation: Net income (loss) less Income tax benefit (expense), plus Interest expense and Depreciation and amortization expense equals EBITDA. Management and some members of the investment community utilize EBITDA to measure financial performance on an ongoing basis. However, EBITDA should not be used in lieu of GAAP measures such as net income and cash flow from operations. Free cash flow is a non-GAAP financial measure. Free cash flow can be reconciled to operating cash flow using the following calculation: Operating cash flow plus investing cash flow (consisting of asset sale proceeds less business acquisition costs, capital expenditures and changes in restricted cash) equals free cash flow. We use free cash flow to measure the cash generating ability of our operating asset-based energy business relative to our capital expenditure obligations. Free cash flow should not be used in lieu of GAAP measures with respect to cash flows and should not be interpreted as available for discretionary expenditures, as mandatory expenditures such as debt obligations are not deducted from the measure. |
3 CONFIDENTIAL Growth • Value • Vision AGENDA AGENDA Enhanced Scale, Diversity and Market Position Bruce A. Williamson, Dynegy Inc. Chairman and CEO LS Power Overview and Transaction Rationale Mike Segal, LS Power Group Chairman and CEO Financial Stability and Rapid Deleveraging Holli C. Nichols, Dynegy Inc. EVP and CFO Proven Development Platform Jason Hochberg, LS Power President Dynegy’s Next Chapter: Multiple Value Options for Investors Bruce A. Williamson Q&A All |
4 CONFIDENTIAL Growth • Value • Vision TRANSACTION OVERVIEW TRANSACTION OVERVIEW Dynegy and LS Power have agreed to combine: 100% of Dynegy’s power generation portfolio 100% of LS Power Group’s power generation portfolio Dynegy to acquire 50% ownership interest in LS Power’s generation development business Increased organic growth prospects through existing repowering opportunities Assets Development Repowering Pro forma 20,000+ MW concentrated in Midwest, Northeast, and Western regions Enhanced fuel and dispatch diversity New strategic position in California Pro forma 20,000+ MW concentrated in Midwest, Northeast, and Western regions Enhanced fuel and dispatch diversity New strategic position in California Approximately 7,600 MW of predominantly coal generation in various stages of development Approximately 30% of development projects in advanced stages Approximately 7,600 MW of predominantly coal generation in various stages of development Approximately 30% of development projects in advanced stages Creates leading merchant power generator with proven asset development capabilities and multiple value drivers Approximately 2,270 MW of predominantly CCGT repowering opportunities at existing LS Power sites Experienced LS Power personnel to lead development joint venture Approximately 2,270 MW of predominantly CCGT repowering opportunities at existing LS Power sites Experienced LS Power personnel to lead development joint venture |
5 CONFIDENTIAL Growth • Value • Vision KEY VALUATION METRICS KEY VALUATION METRICS Transaction consideration: $2.0 B equity value; $4.1 B enterprise value LS operating assets 2007 expected EBITDA: $360 MM – $400 MM LS Power 2007 expected free cash flow: $205 MM – $245 MM Transaction Consideration (Enterprise) 4,141 $ 2007 Expected EBITDA (Mid-Point) 380 $ Less: Consideration for Non-Operating Assets (350) Less: Interest Expense (125) Less: Net Debt of Non-Operating Assets (1) (106) Less: Capital Expenditures (30) Consideration for Operating Assets (Enterprise) 3,685 Free Cash Flow (Mid-Point) 225 $ Less: Operating Asset Debt Assumed (1,702) Operating Assets Consideration (Equity) 1,983 $ 2007 Operating Asset EBITDA Multiple (Mid-Point) 9.7x 2007 Operating Asset Free Cash Flow Yield 11.3% Transaction Consideration 2007 Expected Operating Asset EBITDA/Free Cash Flow (2) Significantly accretive to 2007 expected free cash flow (1) Amount related to Plum Point 1, which is under construction. (2) Assumes utilization of Dynegy NOLs. Note: $2.0 B equity value calculated using 340,000,000 newly issued shares at $5.76 per share (Dynegy closing price on 9/14/06.) Enterprise value calculated using $2.0 B equity value plus $1.8 B in project debt assumed and $375 MM other consideration. Financial expectations for LS Power are preliminary and based on indicative measures and various assumptions and other factors beyond our control, including commodity prices in applicable regions. Actual future performance may differ materially from these preliminary expectations,which will be impacted by purchase accounting adjustments and may not be updated to reflect future changes. |
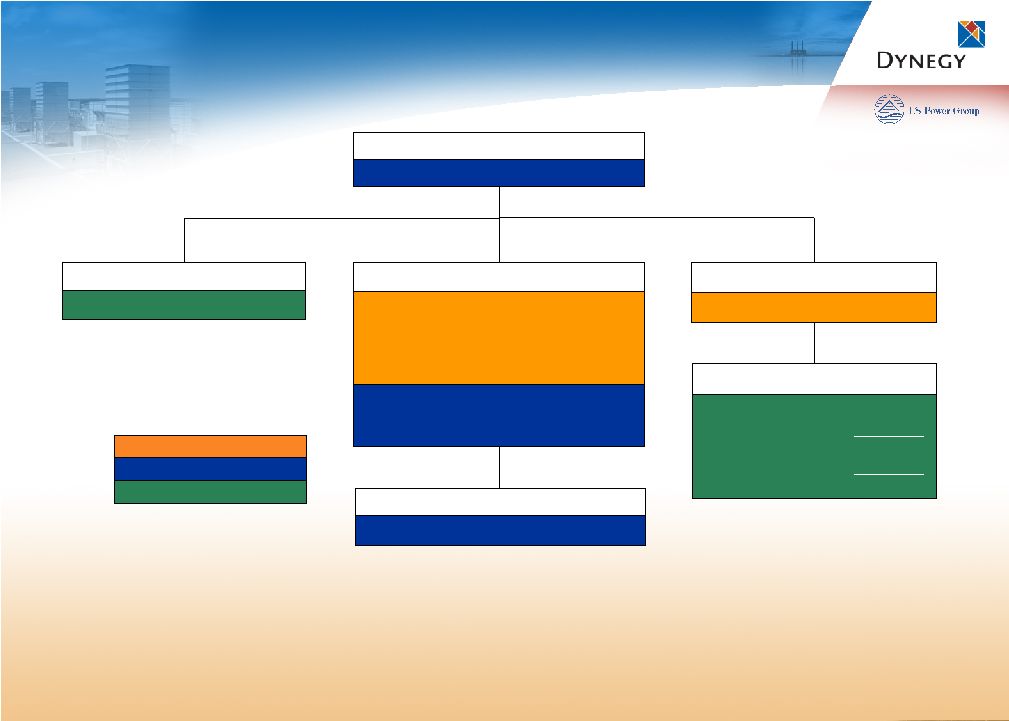
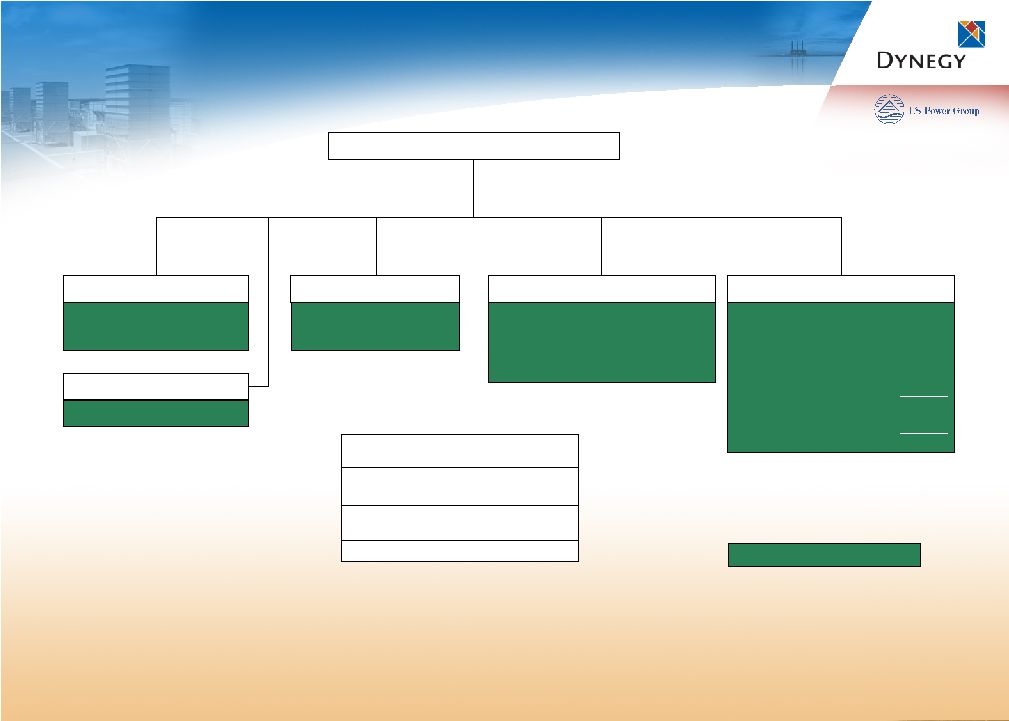
6 CONFIDENTIAL Growth • Value • Vision GOVERNANCE AND COMPANY LEADERSHIP GOVERNANCE AND COMPANY LEADERSHIP Board to be expanded from 10 to 11 members Chevron’s two directors to step down as a result of reduced ownership interest Third Board position available to Chevron currently vacant LS Power to add three Board representatives at closing Board to remain independent under NYSE standards and benefit from experienced LS Power representatives Bruce A. Williamson Chairman and CEO Steve A. Furbacher President and COO Holli C. Nichols Chief Financial Officer J. Kevin Blodgett EVP Lynn A. Lednicky EVP Jason Hochberg EVP Board of Directors Executive Management Team Company to retain Dynegy Inc. name and remain headquartered in Houston |
7 CONFIDENTIAL Growth • Value • Vision TRANSACTION VALUATION TRANSACTION VALUATION Free Cash Flow Accretion Enhanced Financial Stability Valuation and Financial Metrics Immediately and increasingly accretive to free cash flow LS operating assets’ contracted sales provide stable free cash flow even in low commodity price environment Immediately and increasingly accretive to free cash flow LS operating assets’ contracted sales provide stable free cash flow even in low commodity price environment LS operating assets provide a highly predictable cash flow stream to rapidly deleverage and shift value to common stock Dynegy’s baseload- oriented cash flow stream provides significant upside potential for common stock Dynegy’s peaking assets create upside with future power market recovery LS operating assets provide a highly predictable cash flow stream to rapidly deleverage and shift value to common stock Dynegy’s baseload- oriented cash flow stream provides significant upside potential for common stock Dynegy’s peaking assets create upside with future power market recovery Transaction is accretive to free cash flow and improves multiple financial metrics Free cash flow yield of LS operating assets expected to be approximately 11% (1) Approximately $470/kW (2) for operating portfolio with strong long-term contracts Net debt-to-capital ratio initially expected to be 56% (3) pro forma, and rapidly deleveraging Free cash flow yield of LS operating assets expected to be approximately 11% (1) Approximately $470/kW (2) for operating portfolio with strong long-term contracts Net debt-to-capital ratio initially expected to be 56% (3) pro forma, and rapidly deleveraging (1) See page 5 for more details. (2) Based on 7,919 MW of operating assets, excluding Plum Point. (3) Excludes Plum Point. |
8 CONFIDENTIAL Growth • Value • Vision KEY TRANSACTION BENEFITS KEY TRANSACTION BENEFITS Enhanced Scale, Diversity and Market Position Enhanced Scale, Diversity and Market Position Financial Stability and Rapid Deleveraging Financial Stability and Rapid Deleveraging CONTINUED FOCUS ON FINANCIAL DISCIPLINE GREATER GROWTH AND VALUE FOR SHAREHOLDERS Long-Term Investment Outlook and Proven Development Platform Long-Term Investment Outlook and Proven Development Platform |
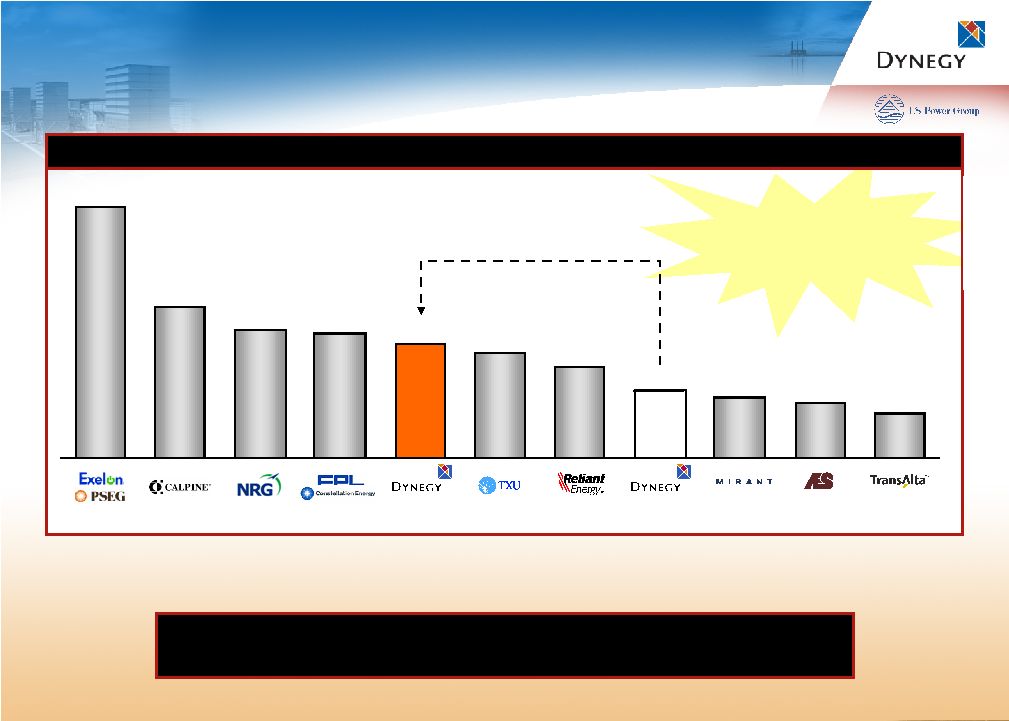
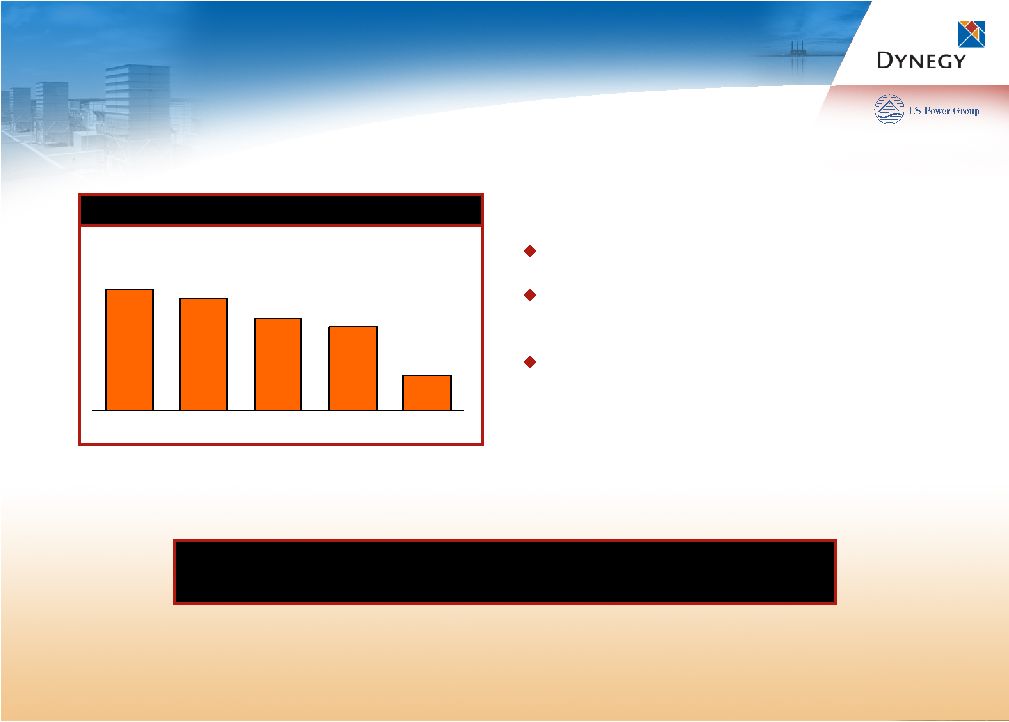
9 CONFIDENTIAL Growth • Value • Vision More sources of earnings More sources of earnings and value without and value without substantial cost increases substantial cost increases A TOP TIER MERCHANT GENERATOR A TOP TIER MERCHANT GENERATOR Pro Forma (1) (4) U.S. Unregulated Generation (Net MW) 43,911 26,675 22,584 21,960 20,104 18,300 15,934 11,920 10,567 9,749 7,664 Note: Excludes announced development programs. (1) Pro forma for divestiture of mitigation assets. (2) Pro forma for announced asset sales. (3) Pro forma for the expected 4Q 2006 sale of Rockingham, a 900-MW dual-fuel facility in North Carolina. (4) Includes 10,228 MW capacity from natural gas fired plants forwhich TXU has announced intentions to explore strategic alternatives, including a potential sale. Increased scale and scope significantly enhances competitive position of our power generation business (3) (2) (2) (3) |
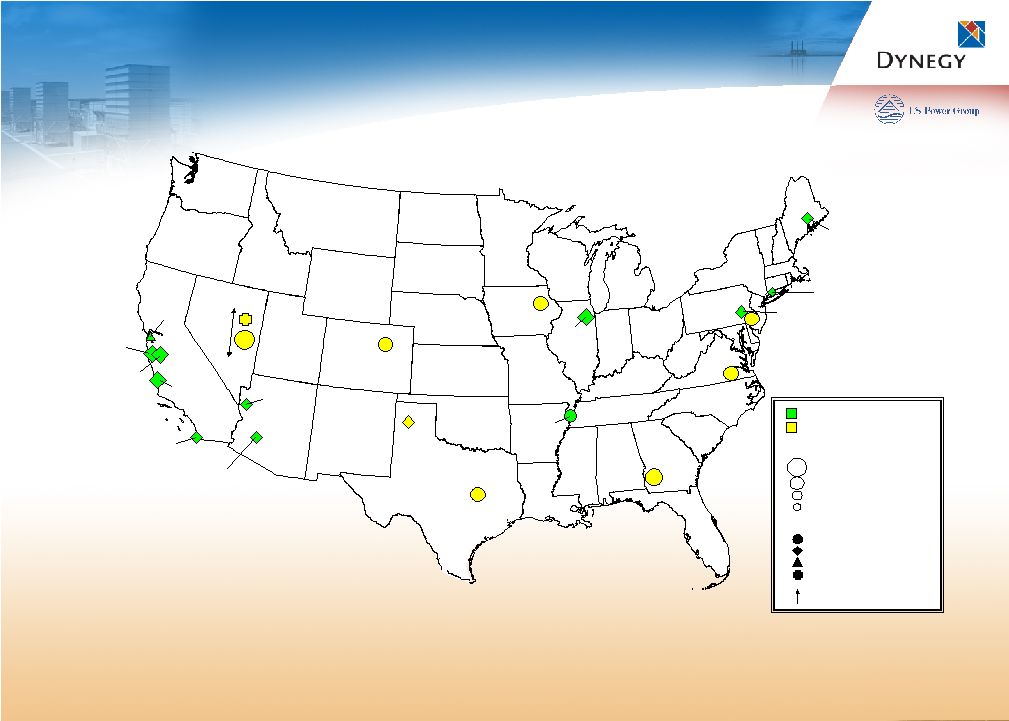
10 CONFIDENTIAL Growth • Value • Vision NEW DYNEGY PORTFOLIO NEW DYNEGY PORTFOLIO Strategically concentrated portfolio in key regions with strong new position in California Note: Plum Point 1 currently under construction. MW totals exclude development and repowerings. Primary Fuel Type Nameplate Capacity (MW) More than 900 MW 500 MW to 900 MW 150 MW to 500 MW Less than 150 MW LS Power - Operating Coal Gas Gas/Oil Wind LS Power - Development Dynegy Inc. West 5,232 MW Midwest 8,976 MW Northeast 4,373 MW Transmission |
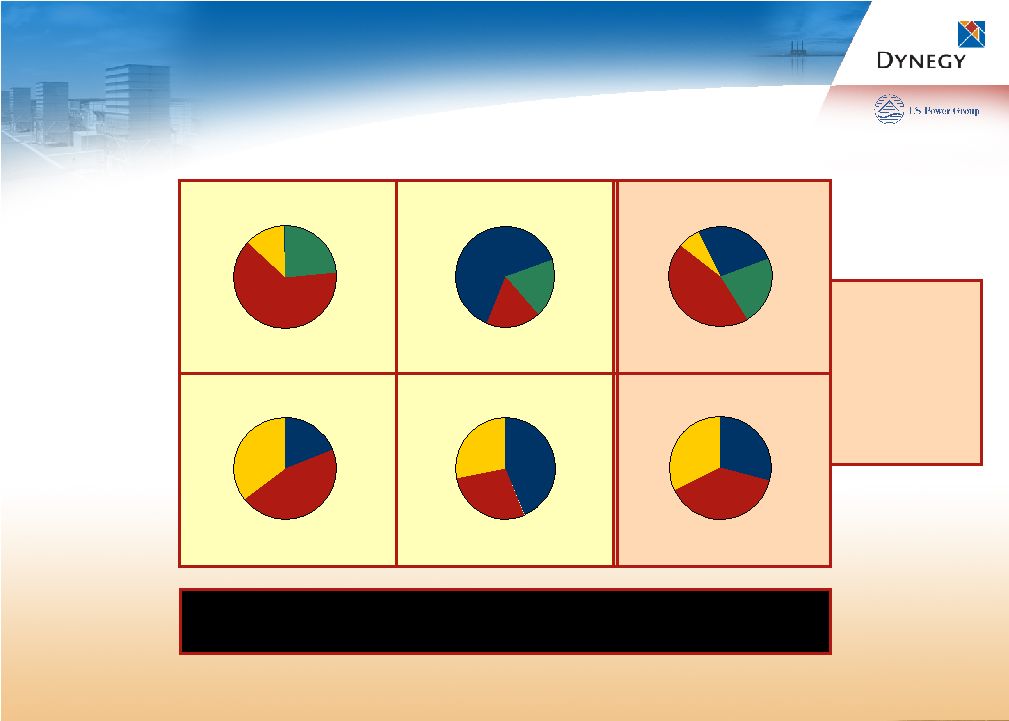
11 CONFIDENTIAL Growth • Value • Vision DIVERSIFIED AND BALANCED PORTFOLIO DIVERSIFIED AND BALANCED PORTFOLIO Dynegy LS Power Combined Geographic Diversity Dispatch Diversity A complementary mix of geographic locations with baseload, intermediate and peaking capabilities Note: Includes Plum Point, which is under construction. Fuel Diversity Coal/Oil 21.2% Dual Fuel 6.7% Gas - CCGT 32.8% Gas - Simple Cycle 39.3% Northeast 23.5% Midwest 63.3% South 12.8% West 0.4% Midwest 17.4% Northeast 19.2% West 63.4% Intermediate 19.3% Peaking 45.2% Baseload 35.5% Intermediate 43.6% Peaking 28.4% Baseload 28.0% Intermediate 29.2% Peaking 38.3% Baseload 32.5% Midwest 44.6% Northeast 21.8% West 26.0% South 7.6% |
12 CONFIDENTIAL Growth • Value • Vision KEY TRANSACTION BENEFITS KEY TRANSACTION BENEFITS Enhanced Scale, Diversity and Market Position Enhanced Scale, Diversity and Market Position CONTINUED FOCUS ON FINANCIAL DISCIPLINE GREATER GROWTH AND VALUE FOR SHAREHOLDERS Increases Dynegy’s operating portfolio to more than 20,000 MW Cost advantage to integrate with Dynegy’s scaleable platform Concentrated positions in key regions of Midwest, Northeast and West Re-entry into California with stronger strategic position and well-positioned assets Greater fuel and dispatch diversity improves economic stability Generates significant free cash flow to deleverage and shifts value to common shareholders |
13 CONFIDENTIAL Growth • Value • Vision Mike Segal LS Power Group Chairman and CEO LS Power Overview and Transaction Rationale |
14 CONFIDENTIAL Growth • Value • Vision LS POWER OVERVIEW LS POWER OVERVIEW Power plant developer, owner and operator since 1990 Value creation based on maximizing free cash flow and opportunistic capital deployment Investment activities Acquired 11 power generation projects, totaling approximately 8,200 MW Development track record More than 15 years development experience with strong history of performance and returns Successfully completed nine greenfield development projects, totaling more than 6,100 MW Execution of existing pipeline and future developments through the 50/50 joint venture Business philosophy based on identifying and acting on macro industry trends, disciplined execution and a focus on high-value added activities |
15 CONFIDENTIAL Growth • Value • Vision LONG-TERM INVESTMENT PLAY LONG-TERM INVESTMENT PLAY LS Power will own approximately 40% of equity of the combined company Aligns interests with that of the combined company’s public shareholders Strategic and long-term investment to capitalize on two macro industry trends Consolidation – Complementary assets and institutional capabilities Demand growth – Uniquely positioned to deliver solutions through new power plant development and utilization of existing generation capacity Confidence in a management team with strong track record of execution, performance and harvesting value The right transaction at the right time with the right acquisition partner |
16 CONFIDENTIAL Growth • Value • Vision Holli C. Nichols Dynegy Inc. Executive Vice President and CFO Financial Stability and Rapid Deleveraging |
17 CONFIDENTIAL Growth • Value • Vision TRANSACTION TERMS TRANSACTION TERMS Total consideration consists of 340 MM shares of Dynegy Class B common stock (1) to LS Power, $100 MM cash and $275 MM Dynegy Inc. Junior Subordinated Note to LS Power Chevron, with ownership of approximately 97 MM shares of Class B common stock, has agreed to vote in favor of the transaction and will receive the same number of shares of the new company’s Class A common stock following closing of the transaction LS Power to be issued approximately 340 MM shares of Dynegy Class B common stock, representing all outstanding shares in this class or approximately 40% of pro forma outstanding common stock Closing expected in early 2007 Subject to regulatory approvals and affirmative vote of two-thirds of Dynegy’s public shareholders Receipt of favorable guidance or waiver from SEC regarding proposed historical financial statement presentation (1) Valued at closing price of $5.76 per share as of 9/14/06. Common Stock to LS Power 1,958 $ Common Stock to LS Power 1,958 $ Junior Sub. Note to LS Power 275 Junior Sub. Note to LS Power 275 Cash on Hand 150 Cash to LS Power 100 New LC Facility 185 Credit Support 185 Fees and Expenses 50 Total Sources 2,568 $ Total Uses 2,568 $ Sources Uses |
18 CONFIDENTIAL Growth • Value • Vision CONTRACTED CASH FLOWS CONTRACTED CASH FLOWS LS Power counterparties are highly rated Combined financial profile more stable than stand alone Minimal capex requirements, low operating risk, new assets and proven technology results in significant free cash flow Contracted cash flow facilitates rapid deleveraging, shifting value to all of Dynegy’s shareholders % of Forecasted Margin Contracted 2007 2008 2009 2010 2011 75% 22% 52% 57% 69% LS Power Portfolio Note: Includes Plum Point. |
19 CONFIDENTIAL Growth • Value • Vision DEBT AND OTHER OBLIGATIONS PRO FORMA AS OF 12/31/06 DEBT AND OTHER OBLIGATIONS PRO FORMA AS OF 12/31/06 Dynegy Power Corp. Central Hudson (4) $801 Dynegy Holdings Inc. $470 Million Revolver (1) $0 Synthetic LC Facility (2) $200 Term Loan (3) $0 Second Secured Notes $11 Sr. Unsec. Notes/Deb. $2,397 Subordinated Debentures $200 Secured Secured Non-Recourse Unsecured Note: Represents pro forma debt balances as of 12/31/06, except for Plum Point, which reflects net debt as of 6/30/06. (1) Represents drawn amounts under the revolver as of 9/13/06; assumed to be undrawn as of 12/31/06. (2) Proceeds from this facility have been drawn and fully collateralize the issuance of letters of credit. (3) Assumed to be repaid with the proceeds from the expected closing of the Rockingham asset sale in 4Q 2006. (4) Central Hudson lease payments are unsecured obligations of Dynegy Inc., but are a secured obligation of an unrelated third party (“lessor”) under the lease. DHI has guaranteed the lease payments on a senior unsecured basis. Amount reflects PV (10%) of future lease payments as of 12/31/06. (5) See the Appendix for more details about the LS Power debt portfolio. (6) See the Appendix for more details about the Plum Point debt. LS Holdco ($ in millions) Dynegy Inc.. Synthetic LC Facility $185 Jr. Sub. Note to LSP $275 Sithe Energies Senior Debentures $428 LS Power Portfolio (5) 1st Lien $1,502 2nd Lien $200 Operating Assets $1,702 Plum Point, Net (6) $106 Total $1,808 |
20 CONFIDENTIAL Growth • Value • Vision DEBT OBLIGATIONS AND REPAYMENTS ($ in MM) DEBT OBLIGATIONS AND REPAYMENTS ($ in MM) $161 $127 $196 $150 LS Power Note: Dynegy’s annual maturities reflect par value debt obligations, excluding Central Hudson lease payments. 2006 includes $150 MM term loan, which is expected to be repaid following receipt of proceeds from the sale of Rockingham in 4Q 2006. Actual term loan maturity date is the earlier of (a) five business days after the completion of the Rockingham sale or (b) 1/31/12. Dynegy maturities exclude $275 MM junior sub note to LSP, which is assumed to be executed and repaid in 2007. Actual junior sub note maturity date is up to 12 years from date of closing. LS Power reflects mandatory amortizations and forecasted cash sweeps to reduce debt obligations and excludes Plum Point. Forecasted debt reductions assume LS Power is a cash taxpayer at the project level and reflect preliminary expectations for LS Power portfolio financial performance based on indicative measures and a number of factors beyond our control, including commodity prices in applicable regions. Actual future performance may differ materially from these preliminary forecasts, which may not be updated to reflect future changes. 2007 2008 2009 2010 2011 2012 2013 2014 2015 2016+ $169 $40 $44 $57 $0 $1,597 $73 $568 $0 $775 $82 2006 2007 2008 2009 2010 2011 2012 2013 2014 2015 2016+ Dynegy Extended option horizon + Market position and recovery = Significant upside for common stockholders Contracted assets generating significant cash flows + Track record of deleveraging = Significant value to common stockholders $171 $197 $196 $147 $55 $302 |
21 CONFIDENTIAL Growth • Value • Vision KEY TRANSACTION BENEFITS KEY TRANSACTION BENEFITS CONTINUED FOCUS ON FINANCIAL DISCIPLINE GREATER GROWTH AND VALUE FOR SHAREHOLDERS Transaction immediately and increasingly accretive to Dynegy’s free cash flow LS Power’s existing financings provide a significant amount of capacity to meet liquidity needs Cash flow to be utilized to delever LS Power’s project-level debt, shifting significant value to common shareholders LS Power’s contracted and stable cash flows enhance combined company’s ability to weather downturns in commodity price environment and capture upside in market recovery Financial Stability and Rapid Deleveraging Financial Stability and Rapid Deleveraging |
22 CONFIDENTIAL Growth • Value • Vision Jason Hochberg LS Power President Proven Development Platform |
23 CONFIDENTIAL Growth • Value • Vision FOUR STEPS TO SUCCESSFUL DEVELOPMENT FOUR STEPS TO SUCCESSFUL DEVELOPMENT 1. Dynamic and flexible approach Responsive to customer needs Able to optimize commercial agreements to maximize value of each project 2. Focus on risk management Execute long-term contracts or hedges for significant portion of project’s output prior to capital commitment Arrange appropriate financing package Structure fixed-price construction contracts with respected counterparties 3. Build relationships Work closely with local communities and regulators Leverage strong relationships with contractors and suppliers Design environmentally responsible facilities 4. Selectivity Evaluate many sites and opportunities for each project pursued “Quality over quantity” Tangible first-mover advantage |
24 CONFIDENTIAL Growth • Value • Vision GREENFIELD DEVELOPMENT GREENFIELD DEVELOPMENT More than 7,600 MW in various stages of power generation development, with approximately 30% in advanced stages Sandy Creek Long Leaf White Pine/ Egan Elk Run Plum Point Unit 2 High Plains Five Forks West Deptford West Texas Texas Georgia Nevada Iowa Arkansas Colorado Virginia New Jersey Texas Coal/800 Coal/1,200 Coal/Wind 1,600/200 Coal/750 Coal/665 Coal/600 Coal/800 Coal/500 Natural Gas/500 Application Filed Permit Issued Application Filed Draft Permit Issued Application Filed Permit Issued Water Supply Secured/Available Fuel/MW Site Secured Zoning Approved/Not Required Location Solid Waste Permit Water Discharge Permit Air Permit N/A N/A |
25 CONFIDENTIAL Growth • Value • Vision SIGNIFICANT REPOWERING OPPORTUNITIES SIGNIFICANT REPOWERING OPPORTUNITIES Bridgeport (Connecticut) Addition of up to 320-MW peaking capacity on existing site Ability to capture energy, capacity and ancillary revenues South Bay (California) Pursuing replacement of current plant with 500-MW CCGT on adjacent site Would provide much needed power and grid stability in major load pocket with reduced emissions profile Have requisite emission reduction credits on hand Morro Bay (California) Pursuing 1,200-MW CCGT development on adjacent parcel; design based on recent Moss Landing 1,000 MW development All permitting complete except NPDES permit Eligible for energy, capacity and ancillary revenues Oakland (California) Repowering of existing site to 250-MW combined cycle project on adjacent site Significant interest from regional load-serving entities |
26 CONFIDENTIAL Growth • Value • Vision DEVELOPMENT BUSINESS ECONOMICS DEVELOPMENT BUSINESS ECONOMICS By the time a project reaches financial closing and capital commitments are required, all key risks have been managed Construction risk Operating risk Commodity risk Value range is driven by a combination of Sales of undivided interests (capacity “sell-downs”) Long term power purchase agreements (“PPAs”) Intermediate-term financial hedges Ultimately, aggregate project risk can be inferred from financing costs Typically LIBOR + 150-300 bps at debt-to-capital levels of up to 80% Risk Margin PPAs Hedges Sell-downs Merchant |
27 CONFIDENTIAL Growth • Value • Vision KEY TRANSACTION BENEFITS KEY TRANSACTION BENEFITS CONTINUED FOCUS ON FINANCIAL DISCIPLINE GREATER GROWTH AND VALUE FOR SHAREHOLDERS Established vehicle for Dynegy’s organic growth Proven track record of development, with reputation for successful project completion and value-capture Identified 2,270 MW of repowering opportunities Only IPP to have received approval of all necessary permits for coal-fired facility in ERCOT market Equity stake aligns interest with Dynegy public shareholders Long-Term Investment Outlook and Proven Development Platform Long-Term Investment Outlook and Proven Development Platform |
28 CONFIDENTIAL Growth • Value • Vision Bruce A. Williamson Dynegy Inc. Chairman and CEO Dynegy’s Next Chapter: Multiple Value Options for Investors |
29 CONFIDENTIAL Growth • Value • Vision DYNEGY’S NEW VALUE PLATFORM DYNEGY’S NEW VALUE PLATFORM Development Opportunities • Brownfield • Greenfield • Repowering New Efficient Peaking Fleet Intermediate Cycle Gas-Fired Facilities Baseload Coal Facilities With Strong Cash Flows Proven Management Team With Focus on Shareholder Value Addition of contracted cash flow from LS Power Dynegy’s coal fleet generates strong cash flow Significant operating leverage to market recovery Development JV with identified growth Key value tenet for LS Power Comprehensive platform for creating and capturing value during each stage of the market and demand cycle |
30 CONFIDENTIAL Growth • Value • Vision MULTIPLE VALUE OPTIONS FOR INVESTORS MULTIPLE VALUE OPTIONS FOR INVESTORS Immediate free cash flow per share accretion Predictable cash flow stream Rapid deleveraging of balance sheet Creates value for common shareholders Enhanced fuel, dispatch and geographic diversity Track record of strong operational performance and opportunistic commercial approach Significant presence in key regions as power recovery continues Established vehicle for future growth Ability to increase portfolio without substantial impact to cost structure Better positioned to participate in future sector consolidation Financial Stability and Rapid Deleveraging Financial Stability and Rapid Deleveraging Enhanced Scale, Diversity and Market Position Enhanced Scale, Diversity and Market Position Long-Term Investment Outlook and Proven Development Platform Long-Term Investment Outlook and Proven Development Platform Near-Term Value Near-Term Value Medium-Term Value Medium-Term Value Long-Term Value Long-Term Value Unique platform to deliver shareholder value |
31 CONFIDENTIAL Growth • Value • Vision Appendix |
32 CONFIDENTIAL Growth • Value • Vision DYNEGY GENERATION FACILITIES DYNEGY GENERATION FACILITIES Pro forma for the expected 4Q 2006 sale of Rockingham, a 900-MW dual-fuel facility in North Carolina. (1) DYN entered into a $920 MM sale-leaseback transaction for the Roseton facility and units 3 and 4 of the Danskammer facility in 2001. Cash lease payments extend until 2029 and include $60 MM in 2006, $108 MM in 2007, $144 MM in 2008, $141 MM in 2009, $95 MM in 2010 and $112 MM in 2011. GAAP lease payments are $50.5 MM through 2030 and decrease until last GAAP lease payment in 2035. (2) DYN owns a 50% interest in this facility and the remaining 50% interest is held by Chevron, our significant shareholder. Region Facility State Capacity (Net MW) Fuel Dispatch Midwest Baldwin IL 1,806 Coal Baseload Havana Units 1–5 IL 242 Oil Peaking Unit 6 IL 448 Coal Baseload Hennepin IL 301 Coal Baseload Oglesby IL 63 Gas Peaking Stallings IL 89 Gas Peaking Tilton IL 188 Gas Peaking Vermilion IL 194 Coal/Gas/Oil Baseload/Peaking Wood River Units 1–3 IL 133 Gas Peaking Units 4–5 IL 461 Coal Baseload Rocky Road IL 364 Gas Peaking Riverside/Foothills KY 940 Gas Peaking Rolling Hills OH 970 Gas Peaking Renaissance MI 776 Gas Peaking Bluegrass KY 576 Gas Peaking Northeast Independence NY 1,092 Gas Intermediate Roseton (1) NY 1,210 Gas/Oil Intermediate Danskammer Units 1–2 NY 130 Gas/Oil Peaking Units 3–4 NY 371 Coal/Gas/Oil Baseload South Calcasieu LA 347 Gas Peaking Heard County GA 566 Gas Peaking CoGen Lyondell TX 610 Gas Baseload West Black Mountain (2) NV 43 Gas Baseload Total 11,920 |
33 CONFIDENTIAL Growth • Value • Vision LS POWER OPERATING PORTFOLIO GENERATION FACILITIES LS POWER OPERATING PORTFOLIO GENERATION FACILITIES Capacity Contracted Region Facility State (Net MW) Capacity / Type Fuel Dispatch West Moss Landing 1&2 CA 1,020 Hedge Gas – CCGT Baseload Moss Landing 6&7 CA 1,509 Toll Gas Peaking Morro Bay CA 650 Toll Gas Peaking South Bay CA 700 RMR Condition 2 Gas Intermediate Oakland CA 165 RMR Condition 1 Oil Peaking Arlington Valley AZ 570 Hedge Gas – CCGT Intermediate Griffith AZ 575 Hedge Gas – CCGT Intermediate Northeast Bridgeport CT 490 RMR Gas – CCGT Baseload Casco Bay ME 520 Hedge Gas – CCGT Baseload Ontelaunee PA 560 Hedge Gas – CCGT Intermediate Midwest Kendall IL 1,160 Toll Gas – CCGT Intermediate Plum Point(1) AR 265 Hedge/PPAs Coal Baseload Total 8,184 (1) Represents net 70% ownership. |
34 CONFIDENTIAL Growth • Value • Vision LS POWER PORTFOLIO LS POWER PORTFOLIO Primary Fuel Type Nameplate Capacity (MW) More than 900 MW 500 MW to 900 MW 150 MW to 500 MW Less than 150 MW LS Power - Operating Coal Gas Gas/Oil Wind LS Power - Development Note: Plum Point 1 currently under construction. MW totals exclude development and repowerings. Moss Landing 1&2 1,020 MW Moss Landing 6&7 1,509 MW Bridgeport Casco Bay 520 MW 490 MW Ontelaunee 560 MW Kendall 1,160 MW Arlington Valley 570 MW Griffith 575 MW South Bay 700 MW Oakland 165 MW Morro Bay 650 MW Plum Point 265 MW Transmission |
35 CONFIDENTIAL Growth • Value • Vision LS POWER DEBT AND OTHER OBLIGATIONS: PRO FORMA AS OF 12/31/06 LS POWER DEBT AND OTHER OBLIGATIONS: PRO FORMA AS OF 12/31/06 1st Lien Debt $ 1,502 MM 2nd Lien Debt 200 MM Operating Assets $ 1,702 MM Plum Point, Net 106 MM Total $ 1,808 MM Total LS Power Amounts Outstanding ($ in millions) Secured Non-Recourse Kendall 1st Lien LC Facility $0 1st Lien Term Loan $402 Ontelaunee 1st Lien Term Loan $95 2nd Lien Term Loan $50 LSP Gen Finance Co. 1st Lien Term Loans $935 2nd Lien Term Loan $150 $100 MM 1st Lien Revolver (1) $0 1st Lien LC Facilities (1) $0 Plum Point Energy Assoc. 1st Lien Term Loan (3) $376 2nd Lien Term Loan (3) $155 $50 MM 1st Lien Rev. (1) $0 Synthetic LC Facility (4) $102 Tax Exempt Notes (3) $100 Sub-Total $733 Less: Cash (5) ($627) Total, Net $106 LS Power Portfolio Griffith 1st Lien Facility (2) $70 Note: Represents pro forma debt balances as of 12/31/06, except for Plum Point, which reflects net debt as of 6/30/06. Plum Point is expected to be consolidated in Dynegy’s financial results, but the facility will be only 70% owned by the new company. (1) Facilities assumed to be undrawn as of 12/31/06. LSP Gen Finance Co. First Lien LC Facility excludes $512 MM letters of credit posted as of September 2006. (2) First lien facility to be entered into upon expected closing of transaction. (3) Does not reflect a total of $525 MM restricted cash. (4) $102 MM Synthetic LC Facility is undrawn and collateralizes tax exempt notes. (5) Consists of $525 MM restricted cash plus $102 MM cash collateral in support of the Synthetic LC Facility. |
36 CONFIDENTIAL Growth • Value • Vision LS POWER DEBT SUMMARY PRO FORMA AS OF 12/31/06 LS POWER DEBT SUMMARY PRO FORMA AS OF 12/31/06 Note: Represents pro forma debt balances as of 12/31/06. NR = Not Rated. (1) Reflects net debt as of 6/30/06. (2) Facilities assumed to be undrawn as of 12/31/06. (3) First lien facility to be entered into upon expected closing of transaction. (4) Does not reflect a total of $525 MM restricted cash. (5) LC Facility is undrawn and collateralizes tax exempt notes. (6) Interest based on floating rate that resets weekly. (7) Consists of $525 MM restricted cash plus $102 MM cash collateral in support of the Synthetic LC Facility. Entity Tranche Facility Size ($ MM) Outstanding Amount ($ MM) Interest Rate Commitment Fee (Undrawn) Maturity Ratings Mandatory Amortization Call Protection LSP Gen Finance Co. First Lien Term Loan 990 $ 935 $ L+175 2013 Ba3 / BB- 1% per Year None Second Lien Term Loan 150 150 L+350 2014 B2 / B None 101% in Year 1 First Lien Revolver 100 - L+175 50 2011 Ba3 / BB- None None First Lien Letter of Credit(2) 500 - L+87.5 87.5 2011 Ba3 / BB- None None First Lien Letter of Credit(2) 150 - L+175 50 2011 Ba3 / BB- None None Total LSP Gen Finance Co 1,890 $ 1,085 $ Griffith First Lien Facility(3) 70 $ 70 $ L+375+ 200 (PIK) 5 Years NR 1% per Year 101% in Year 1 Kendall First Lien Term Loan 422 $ 402 $ L+200 2013 B1 / B 1% per Year 103% in Year 1; 101% in Year 2 First Lien Letter of Credit(2) 10 - L+200 50 2011 B1 / B None None Total Kendall 432 $ 402 $ Ontelaunee First Lien Term Loan 100 $ 95 $ L+200 2009 NR None None Second Lien Term Loan 50 50 L+400 2009 NR None None Total Ontelaunee 150 $ 145 $ Plum Point(1) First Lien Term Loan(4) 423 $ 376 $ L+325 2014 B1 / B 1% per Year 103% Before 9/2006; 102% 9/2006 - 3/2007; 101% 3/2007 - 9/2007 Second Lien Term Loan(4) 175 155 L+325+ 200 (PIK) 2014 NR None T+50 Before 3/2007; 103% 3/2007 - 3/2008; 101% 3/2008 - 9/2009 First Lien Revolver 50 - L+325 50 2012 B1 / B None None Synthetic Letter of Credit(5) 102 102 L+325 2014 B1 / B None None Tax Exempt Notes(4)(6) 100 100 3.68% 2036 Aa3 / A+ None None Total Plum Point 850 $ 733 $ Less: Cash(7) (627) Plum Point, Net 106 $ Total LS Power Debt 3,392 $ 1,808 $ |