UNITED STATES
SECURITIES AND EXCHANGE COMMISSION
WASHINGTON, D.C. 20549
FORM 10-K
Annual Report Pursuant to Section 13 or 15(d) of the Securities Exchange Act of 1934
For the fiscal year ended January 31, 2007
Commission file number 0-16438
NATIONAL TECHNICAL SYSTEMS, INC.
(Exact name of registrant as specified in its charter)
California | | 95-4134955 |
(State or other jurisdiction of | | (I.R.S. Employer |
incorporation or organization) | | Identification No.) |
24007 Ventura Boulevard, Suite 200 | | |
Calabasas, CA | | 91302 |
(Address of principal executive offices) | | (Zip Code) |
(818) 591-0776
(Registrant’s telephone number, including area code)
Securities registered pursuant to Section 12(b) of the Act:
| Title of each class | | | | Name of each exchange on
which registered | |
Common stock—no par value | | The NASDAQ stock market LLC |
Securities registered pursuant to Section 12(g) of the Act:
None
Indicate by check mark if the registrant is a well-known seasoned issuer, as defined in Rule 405 of the Securities Act. Yes o Nox
Indicate by check mark if the registrant is not required to file reports pursuant to Section 13 or Section 15(d) of the Act. Yes o Nox
Indicate by check mark whether the registrant (1) has filed all reports required to be filed by Section 13 or 15(d) of the Securities Exchange Act of 1934 during the preceding 12 months (or for such shorter period that the registrant was required to file such reports), and (2) has been subject to such filing requirements for the past 90 days. Yes x Noo
Indicate by check mark if disclosure of delinquent filers pursuant to Item 405 of Regulation S-K is not contained herein, and will not be contained, to the best of registrant’s knowledge, in definitive proxy or information statements incorporated by reference in Part III of this Form 10-K or any amendment to this Form 10-K. x
Indicate by check mark whether the registrant is a large accelerated filer, an accelerated filer, or a non-accelerated filer. See definition of “accelerated filer and large accelerated filer” in Rule 12b-2 of the Exchange Act. (Check one):
Large accelerated filer o | | Accelerated filer o | | Non-accelerated filer x |
Indicate by check mark whether the registrant is a shell company (as defined in Rule 12b-2 of Act). Yes o No x
State the aggregate market value of the voting and non-voting common equity held by non-affiliates computed by reference to the price at which the common equity was last sold, or the average bid and asked price of such common equity, as of the last business day of the registrant’s most recently completed second fiscal quarter—$41,350,000 (as of July 31, 2006).
The number of shares of registrant’s Common Stock outstanding on April 24, 2007 was 8,795,797.
Documents Incorporated by Reference
Portions of the Proxy Statement of the Company for the Annual Meeting of Shareholders to be held on July 12, 2007, are incorporated by reference into Part III of this report.
NATIONAL TECHNICAL SYSTEMS, INC.
FORM 10-K
FISCAL YEAR ENDED JANUARY 31, 2007
This report contains certain statements that may be deemed “forward-looking statements” within the meaning of the Private Securities Litigation Reform Act of 1995. Such statements can be identified by the use of forward-looking words such as “may”, “will”, “expect”, “anticipate”, “intend”, “estimate”, “continue”, “behave” and similar words. Financial information contained herein, to the extent it is predictive of financial condition and results of operations that would have occurred on the basis of certain stated assumptions may also be characterized as forward-looking statements. Although forward-looking statements are based on assumptions made, and information believed by management to be reasonable, no assurance can be given that such statements will prove to be correct. Such statements are subject to certain risks, uncertainties and assumptions. Actual outcomes are dependent upon National Technical Systems, Inc.’s (“NTS” or “the Company”) successful performance of internal plans, ability to effectively integrate acquired companies, customer changes in short range and long range plans, competition in the Company’s services areas and pricing, continued acceptance of new services, performance issues with key customers, and general economic risks and uncertainties.
2
NATIONAL TECHNICAL SYSTEMS, INC.
Annual Report (Form 10-K)
For Year Ended January 31, 2007
PART I
ITEM 1. BUSINESS.
General
National Technical Systems, Inc. (“NTS” or the “Company”) is a diversified services company that supplies technical services and solutions to a variety of industries including aerospace, defense, transportation, electronics, power, computers and telecommunications. NTS, utilizing its various testing facilities, staffing solutions and certification services, helps its customers sell their products in world markets. NTS is accredited by numerous national and international technical organizations which allow the Company to have its test data accepted in most countries.
The Company was founded in 1961, incorporated in 1968 in California and subsequently was reincorporated in Delaware in 1987 to serve as a holding company for its subsidiaries. On January 31, 1997, the Company was merged into a newly formed California corporation named National Technical Systems, Inc.
The Company’s principal executive offices are located at 24007 Ventura Boulevard, Suite 200, Calabasas, California 91302 (telephone: 818-591-0776).
Description of Business
NTS operates in two segments: “Engineering and Evaluation” and “Technical Solutions.” The business of the Company is conducted by a number of operating units, each with its own organization. The management of each operating unit has responsibility for its operations and for achieving sales and profit goals. The executive staff from the Company’s corporate headquarters maintains overall supervision, coordination and financial control.
(i) Engineering & Evaluation (“E&E”)
Overview
The E&E segment of NTS is one of the largest independent conformity assessment and management system registration organizations in the U.S., with facilities throughout the country and at locations in Japan, Germany and Canada. E&E provides highly trained technical personnel for product certification, product safety testing and product evaluation to enable customers to sell their products in world markets. In addition, E&E performs management registration and certification services to ISO related standards. NTS is accredited by numerous national and international technical organizations which allows the Company to have its test data accepted in most countries.
E&E revenues represented 69%, 65% and 59% of NTS total revenues in fiscal years 2007, 2006 and 2005, respectively. E&E serves high technology companies, predominantly in the defense, aerospace, transportation, telecommunications, electronics, power and computers markets. In fiscal 2007, E&E serviced approximately 2,800 customers. The ability of these customers to offer certifications and provide test data that is accepted in world markets is critical for the sale of manufactured products in international markets. Information about our E&E segment’s net revenues, gross profit and assets is described in Note 10 to the consolidated financial statements included in Item 8 of this annual report on Form 10-K.
3
E&E simulates environments that replicate changes in temperature, altitude, moisture, and virtually every other environmental factor that might affect product performance. In addition, E&E has developed expertise and specialized skills over decades of testing in multiple industries and has invested heavily in equipment including a full spectrum of EMI chambers, data acquisition systems, seismic simulators, environmental simulation equipment, environmental chambers, fire chambers, mixed gas flow chambers and munitions and ordnance performance testing equipment.
E&E also provides international registration of companies requiring quality and environmental management system registration. With the increasing globalization of industry and trade, the international community has developed, and continually updates, management systems standards to ensure that manufactured products conform to acceptable standards when sold anywhere in the world. These standards, developed by the International Standards Organization (ISO), and applicable to different industries, such as aerospace, transportation and environmental, are used to provide compliance by manufacturers certified by third party registrants. Third party registrants are accredited by industry regulated accreditation bodies. E&E is certified to provide third party registrations to a variety of industries. To accomplish certification, E&E audits a company’s quality policy, quality system documentation and quality records through on-site assessment. Such assessment determines whether the quality system is defined, documented, deployed and consistently implemented, and that the required documentation and records are current and available. If the customer’s quality system is verified to conform to the requirements of the applicable ISO standard, National Quality Assurance (“NQA”), USA, an affiliate of the Company, issues a certificate describing the scope of the customer’s quality system. The customer is then entitled to display the Registrar’s mark on advertising and stationery as evidence that it has achieved ISO registration. Thereafter, E&E performs periodic follow-up surveillance assessments to ensure that the customer remains in compliance. In the Quality Audit field, the Company is the tenth largest ISO 9000 assessment company in the United States as reported by “Quality Systems Update.” The Company believes that NQA USA has approximately 7% of the total registration market.
E&E Markets
E&E serves customers primarily in the defense, aerospace, transportation, telecommunications, electronics, power and computers markets. Defense and aerospace markets combined account for approximately 58% of E&E testing revenues.
Defense. E&E plays an active role in numerous U.S. defense related programs, performing almost every type of test discipline, including complete functionality and performance, reliability, safety, life prediction, structural/mechanical, fluids related, material science, vibration, shock, climatic exposure, radiation, acoustic noise and electromagnetic interference and compatibility. Examples of items tested include components for small fixed wing aircraft, helicopters, submarines, aircraft carriers and other naval ships, tanks and other tracked vehicles, trucks and road vehicles, command/control communication systems, electronics, weapon systems and complete ordnance and munitions testing. E&E has facilities that are specially constructed to handle munitions and hazardous materials where routine testing includes vibration and cook-off of explosive materials, ballistics tests and hydraulic burst tests. E&E performs a broad variety of ballistics related testing, up to 155 mm rounds. E&E’s data acquisition systems are capable of collecting 1,000,000 data points and 22,000 photos per second. Additional instrumentation includes Doppler radar, 35 mm still cameras, digital recording, data loggers and real-time color and IR video. E&E’s customers in this market include various major defense contractors, as well as the U.S. Department of Defense (DOD) and other government entities.
Aerospace. E&E performs a wide variety of tests required on civil aircraft, space, military and missiles. E&E offers acceleration test facilities, G-tables and centrifuges with diameters ranging from one foot to 102 feet, with weight capacities from a few grams to 20,000 pounds. In climatic testing, E&E utilizes hundreds of test chambers to simulate nearly any environment: temperature, humidity, altitude, rain, salt
4
spray, sand and dust, sunshine, explosive atmosphere or any combination. E&E designs and builds custom facilities and advanced instrumentation and data acquisition systems to support all types of flow testing for gases, liquids and cryogenics. E&E is capable of performing structural testing and analysis, and, in particular, structural loading of large objects such as entire airframes. It also performs fatigue testing of critical hardware items such as engine blades and high-pressure fluid components. The Company also enables its customers to minimize their personnel, testing time and costs by utilizing the Company’s on-site climatic, dynamic, safety and electromagnetic compatibility test capabilities. E&E also has anechoic and reverberant chambers that are used for acoustic emission measurements or high level noise exposure.
Transportation. E&E performs fluids and gas tests that measure the flow of fuels, propellants, chemicals, water, steam and others. It also provides tests that measure temperature, thermal shock, leak detection and efficiencies in objects like filters and other components. Other more specialized tests include cryogenic protocols for elements such as liquid nitrogen, liquid hydrogen and liquid oxygen, as well as liquefied natural gas. E&E also performs dynamometer testing to measure the performance and power output of engines drive trains or any other rotating machinery. It also performs HALT/HASS (Highly Accelerated Stress Screen). These tests combine extremes of temperature, rapid temperature change, and multi-axis vibration to rapidly expose design weaknesses and process flaws. NTS is accredited to ISO 17025 through the American Accreditation of Laboratories Association (A2LA). This accreditation allows NTS automotive test reports to be accepted in the USA and internationally.
Telecommunications. E&E provides certification and evaluation of a broad array of telecommunications equipment and systems for manufacturers of central office equipment and the carriers. E&E’s services are performed in accordance with the Network Equipment Building Systems specifications (NEBS) and fiber optics General Requirements (GRs) as required by the telecommunications industry. E&E is also an independent test laboratory certified and recognized by most carriers, which allows manufacturers to use E&E as a market channel for products tested at Original Equipment Manufacturers’ (“OEM”) facilities that are being developed for use in the regional bell operating companies’ (“RBOCs”) central offices. Currently, E&E is approved by most carriers for certifying passive fiber optics components (PFOC) to sixteen GRs. The Company has been approved as an Independent Test Laboratory (ITL) by the carriers to test and certify central office equipment developed by manufactures to the NEBS specifications. The Company is currently providing this service at laboratories in California, Massachusetts, Texas, Calgary, Canada and Germany. The Company has been approved as an ITL to offer a complete suite of passive fiber components certifications, Digital Subscriber Line (DSL) certification, Video Electronics Standard Association (VESA) certification and Multimedia over Coax (MoCA) certification. The Company is in the process of developing certifications programs for XM Radio and High Definition Audio-Video Networks (HANA).
Electronics. As a Nationally Recognized Test Lab (NRTL), NTS provides electrical safety product certification, in the US and many other countries. NTS has been designated as a Conformity Assessment Body (CAB) for the EMC directive through the US-EU Mutual Recognition Agreement (MRA). NTS conducts EMC testing and provides customers with certification in the US and many other countries, particularly, Japan, Taiwan, Europe and Australia.
Power. E&E conducts a variety of tests relevant to the ongoing operations, safety and maintenance of nuclear facilities. These tests include mechanical aging, normal or accident radiation exposure, reliability simulation, evaluation, thermal aging, analysis, vacuum testing, leak detection, Nuclear Steam Accident, Loss Of Cooling Accident (LOCA), High Expansion Line Break (HELB) to 600F/300psig. E&E also performs seismic simulation tests up to 100,000 force-lbs, single axis, dependent and independent biaxial systems, vibration aging and fatigue studies, up to 45,000 force-lbs. E&E is active in industry task groups that influence the latest dedication guidelines. Through direct participation, E&E is involved in resolution of key Nuclear Regulatory Commission (NRC) questions such as selection and verification of critical characteristics, sampling, traceability, surveys, and like-for-like replacements. E&E engineers and
5
technicians involved in the dedication process meet ANSI N45.2.6 Level II Inspectors guidelines. The Company’s dedication programs utilize the best approach for each specified product. E&E also provides technical evaluations, critical characteristics and safety class determinations and focuses on solving plant needs in areas such as motor rewinds, governor rebuilds, modifications or design of replacement systems and instrumentation panel and component design.
Computer. E&E performs computer product testing, providing compatibility, stress/performance, functionality and compliance testing services for hardware, software, telecommunications and networking companies worldwide. E&E performs software game and game console testing including Microsoft Xbox compliance testing. E&E is the exclusive test center for Microsoft Xbox third party peripheral compatibility testing. E&E also provides testing for Data Over Cable Service Interface Specification (DOCSIS) cable modem, DSL modem, Set Top Box, Residential Gateway and Fiber Optics GR-253 testing, interoperability testing of broadband and network products such as cable modems, DSL modems, Cable Modem Termination System (CMTS), Digital Subscriber Line Access Multiplexer (DSLAM), Routers, Home PNA Gateways, Wireless Wi-Fi devices, Media Servers, Fiber Optics SONET switches, and systems network testing. E&E also performs Universal Serial Bus (USB) certification testing and was able to successfully transfer its USB technology to Japan.
Industry Overview
Manufacturers often fulfill their evaluation testing needs on an outsourcing basis in order to reduce costs, avoid large capital expenditures, save time and remain competitive. Due to regulations requiring third party certification, manufacturers use third party certifiers to position their products for sale in world markets. NTS is currently geographically located to serve customers at locations close to their plants and NTS facilities are capable of providing the conformity assessment activity necessary to reduce product-handling costs and serve as a market gateway for manufacturers to sell products globally. E&E provides a “one stop” resource and single source responsibility for all conformity assessment requirements in the several markets it serves.
Geographic Locations
In the United States, E&E’s facilities are located in Acton and Boxborough, Massachusetts, Tinton Falls, New Jersey, Rustburg, Virginia, Camden, Arkansas, Detroit, Michigan, Plano, Texas, Tempe, Arizona, Los Angeles, Fullerton, Culver City, Santa Clarita, Santa Rosa and Ventura, California, Albuquerque, New Mexico and internationally, in Yokohama, Japan, Calgary, Canada and Munich, Germany. The Company has signed cooperative agreements with SGS in Taiwan and STC in Hong Kong to provide certification and compliance testing for USB, USB on the Go and Cable and Connectors for manufacturers in Taiwan, Korea, Hong Kong and mainland China.
Business Strategy
To meet its customers’ needs, E&E continuously upgrades its facilities, equipment, accreditations, partnerships and personnel in line with market requirements. In addition, E&E’s continuing expansion into new areas of technology will require it to invest in equipment needed to adequately service customers’ needs. Through close consultation with its existing and prospective customers to ascertain their needs for the future, E&E is able to better determine its equipment needs. In fiscal 2007, the Company made additional investments to enhance both its capacity and capability. The Company acquired Dynamic Test Laboratory in Arizona. This acquisition allowed the Company to add EMI/EMC capability at its Tempe, Arizona facility. It also expanded the Company’s capacity to perform additional testing in the vibration and climatic departments in California, Massachusetts and Texas as a result of the additional equipment acquired. The Company also acquired a Quality Management Registration business which expanded the Company’s customer base and capability in California.
6
In line with the Company’s strategy to expand its services in the design and development area, the Company acquired a system integrations company B & B Technologies located in Albuquerque, New Mexico. This organization enhances the Company’s offerings in the area of design and integration of data acquisition and control systems through state-of-the-art automation techniques and hardware platforms.
The Company continues to use the Balanced Scorecard System as a tool to assist management in setting and executing strategy and achieving its mission, “helping our customers to navigate a short course to global markets.” NTS is using this system to maximize efficiency in all aspects of its business.
(ii) Technical Solutions (“TS”)
Overview
The Technical Solutions segment of NTS is a national provider of technical experts for engineering and information technology services. As a result of a strategic initiative developed in 2003, the Company aligned its service offerings to more closely match its TS services with its E&E group and thus capitalize on NTS’s long history of testing and engineering services. This strategy has resulted in TS moving out of certain types of customers in recent years; however, with the strengthening of demand for IT professionals, TS will be looking to expand its IT related business. As a valuable and respected resource, TS has developed long-term relationships with its customers for whom it provides engineering and IT personnel.
TS revenues represented 31%, 35% and 41% of NTS total revenues in fiscal years 2007, 2006 and 2005, respectively. TS’s operational and technical knowledge allows it to effectively identify and screen highly skilled professionals. TS provides the technical resources its customers need to evaluate processes and products to meet the demands of compressing development cycles and critical time-to-market requirements. TS places its professionals on assignment at a customer site to perform specific tasks and projects for a predetermined period. Under negotiated terms, at the completion of an assignment, customers may directly hire an individual. TS also supports its customers in sourcing and identifying candidates for direct hire. Its comprehensive registry of engineering and information technology professionals allows it to provide fully screened and qualified individuals. TS can support its customers’ needs, whether the need is to manage a project or an entire test facility; provide a team to take a product from design to production, or staff a project on a temporary basis. Information about our TS segment’s net revenues, gross profit and assets is described in Note 10 to the consolidated financial statements included in Item 8 of this annual report on Form 10-K.
The majority of TS customers are located in the United States. In August 2004, TS opened a test facility in Ho Chi Minh City, Vietnam. This facility provides a low cost testing alternative. TS’s capabilities in Vietnam consist of a variety of services including system compatibility and integration testing for computer software and hardware testing for business PC platforms for Windows and Linux operating systems.
Industry Overview
The U.S. staffing industry is expected to grow faster and add more new jobs over the next decade than just about any other industry, according to the Bureau of Labor Statistics’ (BLS) estimates. In recent projections, BLS says the employment services industry, which is primarily staffing, will grow at an average annual rate of more than 3.5%, adding nearly 1.6 million new jobs.
The catalyst for the employment services industry’s growth will be increases in the demand for temporary staffing services as flexible work arrangements and schedules continue to proliferate and businesses make their staffing patterns more responsive to market changes. Businesses have become increasingly dependent on the use of contingent and consulting technical staff to manage operations more
7
efficiently and to remain competitive. Important internal functions, ranging from financial reporting to production and inventory management, are automated with applications software.
Companies that can demonstrate that they can lower costs and improve the speed and quality of hiring will see growth over the next three years. Using outside technical resources and consultants allows a company’s management to focus on core business operations, affords greater flexibility and increases a company’s ability to adapt to and keep pace with rapidly changing and increasingly complex technologies. It also provides access to specialized technical skills on a project-by-project basis which better matches staffing levels to current needs, converts fixed labor costs into variable costs, and reduces the cost of recruiting, training and terminating employees as evolving technologies require new programming skills.
Overall, the staffing industry’s projected growth is dependent on the following assumptions: (i) the economy will continue to grow at a strong pace and inflation will be restrained. It also assumes (ii) productivity growth will moderate closer to historical norms; (iii) the rate of unemployment will remain steady at about 4%; and (iv) both the US population and workforce will grow at an annual rate of 1%.
Although Technical Solutions revenues have been declining in recent years, the Company anticipates TS growing again in fiscal 2008. The Company is in contract negotiations with two major financial institutions and anticipates receiving significant business from these customers starting with the first quarter of fiscal 2008.
Technical Solutions Services
In fiscal 2007, information technology services represented 49% of the overall TS revenues and engineering services represented 51% of the overall TS revenues.
TS continues to leverage its technical competencies to provide customers with on-site program management to augment their testing and staffing activities. Managed Services supports both Engineering and IT service areas.
Geographic Locations
In the United States, Technical Solutions offices are located in Culver City, San Mateo, California, Lowell, Massachusetts, Columbia, South Carolina, and Troy, Michigan. Internationally, TS has an office in Ho Chi Minh City, Vietnam. TS’s headquarters are located in Culver City, California. In addition, TS has program managers on customer sites in Woodland Hills and San Diego, California, and Houston, Texas.
Business Strategy
TS continues to strengthen its proprietary database to meet the changes and demands in the business environment. Recognizing that the era of human capital has arrived, starting in 2003, TS transformed how it manages its sourcing, training, qualifying and relationships with its experts and consultants. This allowed the Company to adjust to the dramatic changes created by the demand for highly skilled consultants in both engineering and IT.
With nearly 30 years of experience in technical project outsourcing services, TS continues to focus on supplying: (i) project teams managed by the Company, (ii) project teams managed by the customer, (iii) individual personnel and (iv) managed service programs. TS expects to continue to develop and expand its customer relationships.
TS’s extensive and actively managed proprietary database is quality driven and includes core competency skill-sets that are customer focused. The IT, finance, accounting and computer applications industries are experiencing labor shortages and have a greater need for sourcing and recruiting processes
8
to find and retain highly skilled workers. TS utilizes advanced and long-term strategic processes providing direct fulfillment to its customers, and is not heavily dependent on subcontract relationships.
The continuous development of TS’s proprietary database has enabled the Company to support its customers in recruiting quality personnel. TS also continues to enhance operational efficiencies in its accounting, sales, recruiting and marketing operations. TS continues to differentiate itself from its competitors by using NTS’s testing, engineering and compliance capabilities to maximize its customers’ return on human assets.
TS’s strategy is to improve revenue and profit by rigorously focusing on industries, markets and customers that have the strongest long-term growth opportunities. The strategy is expected to increase productivity by improving internal processes, diversifying the range of services the Company provides to its existing customers, attracting and retaining qualified technical consultants from a variety of sources, both national and international, and pursuing strategic relationships with non-competing organizations. TS’s company-wide sales force is aligned with the Company’s strategy and promotes cross-selling and lead generation between existing customers of one business unit to another. TS strives to provide its customers with technical personnel with the right skills, at the right time, for the right duration and at a cost that is lower than what its customers could otherwise achieve.
(iii) Competition
Engineering & Evaluation
In the aerospace and defense markets, the main competition for independent laboratories is the customers’ own laboratories, including government laboratories. E&E also competes with a small number of large conformity assessment organizations, within each of the markets it serves. It also competes with a large number of small niche oriented test laboratories. It has competitive advantages in several areas which include the following: (i) ability to service customers at facilities close to their locations; (ii) ability to provide complete conformity assessment activities at a single location, which reduces product-handling cost for the customers and enhances timeliness of service; (iii) diverse and technically competent employees; and (iv) accreditations that allow the E&E segment’s test data to be accepted worldwide. Customers can use the Company’s complete services, including quality registration, to position their products for the world markets.
Technical Solutions
Potential customers for services offered by the Technical Solutions segment are from a broad base of high technology and product manufacturing companies. Competition in this segment comes from a large number of public and privately held companies and more recently, from off-shore companies. The Company competes in this segment primarily on its niche position, price and quality of service.
The Company believes its engineering and testing services gives the Company an advantage over most staffing companies, which merely provide personnel as contractors, by understanding the technical challenges facing its customers and providing the expertise to meet those challenges.
Many large companies are increasingly using primary suppliers to fulfill their staffing needs. Technical Solutions competes with and, in certain relationships, teams with other major staffing companies in actively pursuing primary supplier relationships with large customers in its existing markets. These relationships can have a significant impact on Technical Solutions’ revenues and operating profits.
9
(iv) Backlog
The Company’s backlog at January 31, 2007 and 2006 was as follows:
| | 2007 | | 2006 | |
Engineering & Evaluation | | $ | 32,000,000 | | $ | 28,698,000 | |
Technical Solutions | | 8,390,000 | | 9,095,000 | |
Total Backlog | | $ | 40,390,000 | | $ | 37,793,000 | |
The Company estimates that approximately 85% of the backlog at January 31, 2007 will be completed by January 31, 2008.
(v) General
a. Service Marks
The Company has registered its service marks “NTS” and “XXCAL” with the U.S. Patent and Trademark Office.
b. Environmental Effect
We are subject to various federal, state, local and foreign government requirements regulating the discharge of materials into the environment or otherwise relating to the protection of the environment. It is our policy to comply with these requirements, and we believe that, as a general matter, our policies, practices and procedures are properly designed to prevent unreasonable risk of environmental damage, and of resulting financial liability, in connection with our business. Some risk of environmental damage is, however, inherent in some of our operations, as it is with other companies engaged in similar businesses.
The Company’s Santa Clarita, California test facility is located immediately adjacent to property owned by a third party which has been the subject of extensive environmental remediation. The adjacent site has, in the past, been used for manufacture of solid rocket fuel propellants, munitions and flares that contained perchlorate, a hazardous substance. Soil samples taken from the western portion of the Santa Clarita property in 2003 were inconclusive as to the existence of perchlorate. Further testing is planned in cooperation with the government agency having oversight responsibility for the adjacent site. No cleanup activity has been conducted on the Santa Clarita property and it has yet to be determined whether remediation will be required at the site, or, if required, the extent and cost of any remediation. The Company believes that in the event it does incur remediation costs on the western portion of the property, that it will have valid claims for indemnification against the owner of the adjacent site and the municipality that built a road between the adjacent site and the Santa Clarita property that appears to have contributed to the runoff from the adjacent site. Recovery of such remediation costs may, however, be uncertain and may involve significant litigation expense.
In January 2007, a sampling program was conducted on the eastern portion of the site in accordance with a voluntary clean up agreement the Company entered into with the Department of Toxic Substance Control (DTSC). The sampling did not detect any perchlorate in the soil, but one surface sample at a hazardous materials storage area did detect lead, cadmium, chromium, copper and nickel at concentrations in excess of typical background levels. As a result, additional testing will be conducted at that location to determine the extent of the levels of the identified compounds. The extent and cost of remediation, if any is required, is unknown at this time.
c. Seasonal Effect
The Company experiences no material seasonal effects.
10
Employees
The Company employed 874 individuals at January 31, 2007 and 847 at January 31, 2006, as follows:
| | 2007 | | 2006 | |
Engineering & Evaluation | | | 484 | | | | 441 | | |
Technical Solutions * | | | 373 | | | | 389 | | |
Corporate Administration | | | 17 | | | | 17 | | |
Total | | | 874 | | | | 847 | | |
* The Technical Solutions total for 2007 includes 237 contract employees and 97 subcontractors, as compared to 274 contract employees and 72 subcontractors for 2006. None of the employees of the Company are represented by a union. The Company considers its relationship with its employees to be good.
AVAILABLE INFORMATION
Our website address is http://www.ntscorp.com. We make available, free of charge through our website, our Annual Reports on Form 10-K, Quarterly Reports on Form 10-Q, Current Reports on Form 8-K, Proxy Statements, and amendments to those reports filed or furnished pursuant to Section 13(a) or 15(d) of the Exchange Act as soon as reasonably practicable after such material is electronically filed with or furnished to the Securities and Exchange Commission (the “SEC”).
Our filings may also be read and copied at the SEC’s Public Reference Room at 100 F Street NE, Room 1580 Washington, DC 20549. Information on the operation of the Public Reference Room may be obtained by calling the SEC at 1-800-SEC-0330. The SEC also maintains an Internet site that contains reports, proxy and information statements, and other information regarding issuers that file electronically with the SEC. The address of that website is www.sec.gov.
ITEM 1A. RISK FACTORS.
The factors discussed below are cautionary statements that identify important factors that could cause actual results to differ materially from those anticipated in the forward-looking statements in this Form 10-K. Any of the following risks may have a material negative impact on the Company’s financial condition.
The Company is subject to the effects of general economic and market conditions (including economic disruption caused by terrorist acts). If the economic conditions worsen, the Company may experience material adverse effects on its business, operating results, and financial condition.
The Company experienced significant growth in recent years, partly due to domestic and worldwide political and economic developments that have positively affected the markets for defense and advanced technology systems. Homeland security and defeating terrorism have been among the Department of Defense’s main initiatives. A slowing in defense spending due to political or budget shifts will put downward pressure on the Company’s revenues and gross margins.
Results may be adversely affected by:
· Increased competition from the Company’s own customers’ in-house testing laboratories or from government laboratories;
· Increased competition from large conformity assessment organizations and small niche oriented test laboratories;
· The loss of significant customers or significant decreases in their purchasing volume;
11
· Environmental issues arising from the use of hazardous substances;
· Pricing concessions that may be given on volume sales due to competition;
· The rescheduling or cancellation of customer orders;
· Fluctuations and availability of certain raw materials or components that are needed to test customers’ products;
· The loss of key management or technical personnel;
· The financial condition of the Company’s major customers;
· Fraudulent transactions committed against the Company;
· U.S. government defense programs are subject to special risk, including dependence on government appropriations, contract termination without cause, contract renegotiations, and intense competition for the available defense business;
· Inability to find temporary workers with the skills required by customers in the Technical Solutions segment;
· The inability to procure sufficient insurance to cover operational and contractual risks;
· The inability to expand in international markets due to the Company’s limited experience;
· The Company may be required to record a charge to earnings if goodwill becomes impaired;
· Program performance (including the ability to perform fixed-price contracts within estimated costs and the timing of test report deliveries);
· Future changes in zoning could adversely affect the Company’s ability to fully utilize its facilities to service its customers;
· The Company’s California facilities, including its principal executive offices, are located near major earthquake fault lines. A major earthquake or any other natural disaster in a region near any of the Company’s facilities, could materially and adversely affect the Company’s business; and
· To remain competitive, the Company must be able to respond effectively to technological changes and be able to hire, train and retain highly skilled sales, engineering and technical personnel.
ITEM 1B. UNRESOLVED STAFF COMMENTS.
None.
12
ITEM 2. PROPERTIES.
A. Operations. The Company owns/leases and operates the following properties:
State | | Owned Properties
City | | Business
Segment | | Buildings
(Sq.Ft.) | | Land
(Acres) | |
California | | Fullerton | | E&E | | | 36,000 | | | | 3 | | |
| | Santa Clarita (a), (b) | | E&E | | | 60,000 | | | | 145 | | |
Massachusetts | | Acton | | E&E | | | 30,000 | | | | 5 | | |
| | Boxborough | | E&E | | | 25,000 | | | | 4 | | |
Texas | | Plano | | E&E | | | 1,000 | | | | 1 | | |
Virginia | | Fredericksburg | | E&E | | | 66,000 | | | | 87 | | |
Total owned properties | | | 218,000 | | | | 245 | | |
State | | Leased Properties
City | | Business
Segment | | Buildings
(Sq.Ft.) | | Land
(Acres) | |
Arizona | | Tempe | | E&E | | | 17,000 | | | | n/a | | |
Arkansas | | Camden | | E&E | | | 30,000 | | | | 258 | | |
California | | Anaheim Hills | | Corp | | | 2,000 | | | | n/a | | |
| | Calabasas | | Corp | | | 7,000 | | | | n/a | | |
| | Culver City | | TS and E&E | | | 24,000 | | | | n/a | | |
| | Fullerton | | E&E | | | 20,000 | | | | n/a | | |
| | Los Angeles (LAX) | | E&E | | | 16,000 | | | | 2 | | |
| | San Mateo | | TS | | | 2,000 | | | | n/a | | |
| | Santa Rosa | | E&E | | | 18,000 | | | | n/a | | |
| | Ventura | | E&E | | | 870 | | | | n/a | | |
Massachusetts | | Lowell | | TS | | | 1,000 | | | | n/a | | |
| | Boxborough | | E&E | | | 12,000 | | | | n/a | | |
Michigan | | Detroit | | E&E | | | 65,000 | | | | n/a | | |
| | Troy | | TS | | | 1,000 | | | | n/a | | |
New Jersey | | Tinton Falls | | E&E | | | 17,000 | | | | n/a | | |
New Mexico | | Albuquerque | | E&E | | | 6,500 | | | | n/a | | |
South Carolina | | Columbia | | TS | | | 3,000 | | | | n/a | | |
Texas | | Plano | | E&E | | | 24,000 | | | | n/a | | |
Virginia | | Rustburg | | E&E | | | 8,000 | | | | 33 | | |
International | | | | | | | | | |
Calgary | | Canada | | E&E | | | 14,000 | | | | n/a | | |
Germany | | Munich | | E&E | | | 300 | | | | n/a | | |
Japan | | Yokohama | | E&E | | | 500 | | | | n/a | | |
Vietnam | | Ho Chi Minh | | TS | | | 1,000 | | | | n/a | | |
Total leased properties | | | 282,170 | | | | 293 | | |
(a) See “Environmental Matters” in Item 7A.
(b) Approximately 120 acres on this site have been listed for sale by the Company. See “Investment Properies” in Item 2B.
The Company believes that the space occupied by all of its operations is adequate for its current and near-term requirements. Should additional space be required, the Company does not anticipate problems in securing such additional space.
13
B. Investment Properties.
In fiscal year 2005, the Company sold a condominium in Palm Desert, California and purchased a new condominium, which is also located in Palm Desert. The Company recorded a gain of approximately $158,000 from the sale of the old condominium in fiscal 2005. In fiscal year 2006, the Company sold the new condominium in Palm Desert and recorded a gain of approximately $163,000. There were no properties purchased or sold in fiscal year 2007. The Company has listed approximately 120 acres of its Santa Clarita, California land for sale, but because it does not meet all the criteria for accounting classification as an “asset held for sale”, it was not classified as such in the accompanying consolidated financial statements.
ITEM 3. LEGAL PROCEEDINGS.
The Company is, from time to time, the subject of claims and suits arising out of matters occurring during the operation of the Company’s business. In the opinion of management, no pending claims or suits would materially affect the financial position or the results of the operations of the Company.
ITEM 4. SUBMISSION OF MATTERS TO A VOTE OF SECURITY HOLDERS.
None.
PART II
ITEM 5. MARKET FOR REGISTRANT’S COMMON EQUITY, RELATED STOCKHOLDER MATTERS AND ISSUER PURCHASES OF EQUITY SECURITIES.
A. Market Information
The Company’s common stock is traded on the Nasdaq Global Market under the symbol “NTSC”. The range of high and low quotations as reported by the Nasdaq Global Market for each of the quarters of the fiscal years ended January 31, 2007 and 2006 is presented below:
| | 2007 | | 2006 | |
| | High | | Low | | High | | Low | |
First Quarter | | $ | 7.38 | | $ | 4.87 | | $ | 5.14 | | $ | 3.97 | |
Second Quarter | | 8.47 | | 5.73 | | 5.81 | | 4.01 | |
Third Quarter | | 7.47 | | 5.89 | | 5.85 | | 4.02 | |
Fourth Quarter | | 7.00 | | 5.93 | | 5.25 | | 4.05 | |
| | | | | | | | | | | | | |
B. Holders
As of the close of business on April 23, 2007, there were 722 holders of record of the Company’s common stock. The number of holders of record is based on the actual number of holders registered on the books of the Company’s transfer agent and does not reflect holders of shares in “street name” or persons, partnerships, associations, corporations or other entities identified in security position listings maintained by depository trust companies.
C. Dividends
The Company’s Board of Directors announced the discontinuance of the Company’s policy of paying ordinary and special dividends on February 6, 2001. The Company does not anticipate paying dividends in the foreseeable future.
14
D. Securities Authorized for Issuance Under Equity Compensation Plans
Refer to Item 12 below for information regarding the Company’s equity compensation plans.
E. Performance Graph
This performance graph shall not be deemed “filed” for purposes of Section 18 of the Securities Exchange Act of 1934, as amended (the “Exchange Act”) or otherwise subject to the liabilities under that Section and shall not be deemed to be incorporated by reference into any filing of National Technical Systems, Inc. under the Securities Act of 1933, as amended or the Exchange Act.
The following graph compares, for the five year period ended January 31, 2007, the cumulative total stockholder return for the Company’s common stock, the Russell 2000 Index and the Standard & Poor’s Information Technology Index. Measurement points are the last trading day of each of the Company’s fiscal years ended January 31, 2002, January 31, 2003, January 31, 2004, January 31, 2005, January 31, 2006 and January 31, 2007. The graph assumes that $100 was invested on January 31, 2002 in the common stock of the Company, the Russell 2000 Index and the Standard & Poor’s Information Technology Index and assumes reinvestment of any dividends. The stock price performance on the following graph is not necessarily indicative of future stock price performance.
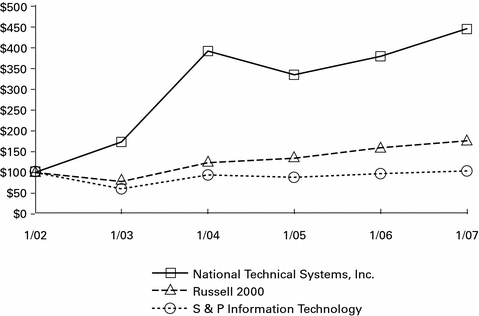
| | 1/02 | | 1/03 | | 1/04 | | 1/05 | | 1/06 | | 1/07 | |
National Technical Systems, Inc. | | 100.00 | | 173.33 | | 391.85 | | 334.81 | | 379.26 | | 445.93 | |
Russell 2000 | | 100.00 | | 78.13 | | 123.46 | | 134.17 | | 159.51 | | 176.17 | |
S & P Information Technology | | 100.00 | | 60.69 | | 94.06 | | 88.33 | | 97.16 | | 103.68 | |
15
ITEM 6. SELECTED FINANCIAL DATA.
The following selected consolidated financial data are derived from and should be read in conjunction with the Company’s consolidated financial statements and related notes set forth in Item 8 below.
| | Year Ended January 31, | |
| | 2007 | | 2006 | | 2005 | | 2004 | | 2003 | |
| | (in thousands except per share amounts) | |
INCOME STATEMENT DATA: | | | | | | | | | | | |
Net revenues | | $ | 115,673 | | $ | 111,524 | | $ | 106,514 | | $ | 104,550 | | $ | 85,772 | |
Gross profit | | 26,643 | | 27,230 | | 23,687 | | 22,612 | | 19,111 | |
Operating income | | 4,668 | | 6,077 | | 3,521 | | 3,215 | | 2,764 | |
Interest expense, net | | 1,801 | | 1,298 | | 1,091 | | 1,097 | | 1,226 | |
Income before income taxes and minority interest | | 2,978 | | 4,955 | | 2,592 | | 2,310 | | 1,549 | |
Income taxes | | 1,309 | | 1,966 | | 910 | | 1,056 | | 676 | |
Income from continuing operations before minority interest | | 1,669 | | 2,989 | | 1,682 | | 1,254 | | 873 | |
Minority interest in earnings | | (88 | ) | (50 | ) | — | | 39 | | (15 | ) |
Net income | | $ | 1,581 | | $ | 2,939 | | $ | 1,682 | | $ | 1,293 | | $ | 858 | |
Net income per common share: | | | | | | | | | | | |
Basic | | $ | 0.18 | | $ | 0.32 | | $ | 0.19 | | $ | 0.15 | | $ | 0.10 | |
Diluted | | $ | 0.17 | | $ | 0.30 | | $ | 0.18 | | $ | 0.14 | | $ | 0.10 | |
Weighted average common shares outstanding | | 8,705 | | 9,125 | | 8,946 | | 8,640 | | 8,656 | |
Dilutive effect of stock options | | 800 | | 537 | | 620 | | 566 | | 39 | |
Weighted average common shares outstanding, assuming dilution | | 9,505 | | 9,662 | | 9,566 | | 9,206 | | 8,695 | |
BALANCE SHEET DATA: | | | | | | | | | | | |
Working capital | | $ | 15,087 | | $ | 16,276 | | $ | 20,481 | | $ | 18,550 | | $ | 19,292 | |
Total assets | | 74,839 | | 69,133 | | 66,669 | | 63,632 | | 61,334 | |
Long-term debt, excluding current installments | | 19,238 | | 15,579 | | 20,557 | | 19,754 | | 19,863 | |
Shareholders’ equity | | 33,779 | | 34,378 | | 30,951 | | 28,832 | | 26,417 | |
* Per share data may not always summate because each figure is independently calculated.
16
ITEM 7. MANAGEMENT’S DISCUSSION AND ANALYSIS OF FINANCIAL CONDITION AND RESULTS OF OPERATIONS.
Except for the historical information contained herein, statements in the following section are forward-looking statements within the meaning of the Private Securities Litigation Reform Act of 1995. Such statements can be identified by the use of forward-looking words such as “may”, “will”, “expect”, “anticipate”, “intend”, “estimate”, “continue”, “behave” and similar words. Financial information contained herein, to the extent it is predictive of financial condition and results of operations that would have occurred on the basis of certain stated assumptions, may also be characterized as forward-looking statements. Although forward-looking statements are based on assumptions made, and information believed by management to be reasonable, no assurance can be given that such statements will prove to be correct. Such statements are subject to certain risks, uncertainties and assumptions. Actual outcomes are dependent upon National Technical Systems, Inc.’s (“NTS” or the “Company”) successful performance of internal plans, ability to effectively integrate acquired companies, customer changes in short range and long range plans, competition in the Company’s services areas and pricing, continued acceptance of new services, performance issues with key customers, and general economic risks and uncertainties.
OVERVIEW
NTS is a diversified services company that supplies testing outsourcing services and conformity assessment and personnel to businesses in a variety of industries including aerospace, defense, transportation, power products, electronics, computers and telecommunications. Through its wide range of testing facilities, staffing solutions and certification services, NTS provides its customers with the ability to sell their products globally and enhance their overall competitiveness. NTS is accredited by numerous national and international technical organizations which allow the Company to have its test data accepted in most countries.
NTS operates in two segments: “Engineering & Evaluation” and “Technical Solutions”. The business of the Company is conducted by a number of operating units, each with its own organization. Each segment is under the direction of its own executive and management team. In making financial and operational decisions, NTS relies on an internal management reporting process that provides revenues and operating cost information for each of its operating units. Revenues and booking activities are also tracked by market type.
In fiscal 2007, total revenues increased 4% to approximately $116 million.
Summary of Revenues for fiscal years 2007 and 2006:
| | FY 2007 | | FY 2006 | | Change | | % Change | |
| | (Dollars in thousands) | | | |
Engineering & Evaluation Revenues | | $ | 80,030 | | $ | 72,411 | | $ | 7,619 | | | 10.5 | % | |
Technical Solutions Revenues | | 35,643 | | 39,113 | | (3,470 | ) | | (8.9 | )% | |
Total Revenues | | $ | 115,673 | | $ | 111,524 | | $ | 4,149 | | | 3.7 | % | |
Revenues in the Engineering & Evaluation segment increased 10.5% primarily due to organic growth combined with revenues from new acquisitions. Revenues in this segment are generated from physical testing services which include simulation of harsh environments such as high/low temperature, shock, vibration, seismic and electromagnetic interference, and functional testing which requires equipment such as switches, routers, servers and high bandwidth access to the Internet to subject telecommunication equipment to a full spectrum of performance type testing. Revenues in this segment also include registration services which perform quality management audits to ISO 9000, quality training and laboratory accreditation. The Engineering & Evaluation segment is one of the largest independent conformity
17
assessment organizations in the U.S., with facilities throughout the United States and in Japan, Canada and Germany, serving a large variety of industries.
Revenues in the Technical Solutions segment decreased 8.9% primarily due to increased price compression due to competition from off-shore companies and delay in hiring at two major customer sites. Revenues in this segment are generated from a variety of staffing and workforce management services and solutions, including contract services, temporary and full time placements to meet its customers’ information technology (“IT”) such as help-desk analysts and managers, relational database administrators and developers, application and systems programmers, configuration and project managers and engineering service needs.
On August 1, 2006, the Company acquired the assets and the existing business of Dynamic Labs, an EMI and environmental testing laboratory with locations in Phoenix, Arizona and Austin, Texas for a total purchase price of $2,254,000, paid in cash. The Phoenix laboratory provided EMI, environmental and dynamics testing for the aerospace and defense industries. The Austin facility also provided aerospace, environmental, and dynamic testing. The majority of the machinery and equipment at the Phoenix facility was relocated to the NTS Tempe, Arizona laboratory with the rest of the equipment distributed to other NTS facilities. All of the machinery and equipment at the Austin facility were relocated to other NTS facilities.
On June 9, 2006, NTS Technical Systems, a wholly owned subsidiary of NTS, acquired the assets and the existing business of B & B Technologies, Inc. (“BBT”), a systems integration firm headquartered in Albuquerque, New Mexico, for a total purchase price of $1,065,000, paid in cash and 83,243 shares of NTS common stock, valued using the ten days average closing price of the Company’s stock prior to the closing date. BBT designs and integrates test, measurement, automation, data acquisition and control systems utilizing diverse hardware platforms, operating systems, and instrumentation standards. The results of operations of the acquired business are included in the accompanying consolidated statement of operations from June 9, 2006 to January 31, 2007.
On April 12, 2006, NQA, USA, a 50% owned consolidated subsidiary of NTS, acquired the existing business of American International Registrars Corporation (“AIR”), located in Ventura, California, for a total purchase price of $386,000, paid in cash. All existing AIR customers and associated certifications and backlog were transferred to NQA, USA. The purchase was recorded $105,000 to customer relationships and $281,000 to goodwill.
Summary of Cash Flows for fiscal years 2007 and 2006:
| | FY 2007 | | FY 2006 | | Change | | % Change | |
| | (Dollars in thousands) | | | |
Net cash provided by operating activities | | $ | 6,253 | | $ | 9,535 | | $ | (3,282 | ) | | (34.4 | )% | |
Net cash used for investing activities | | (9,280 | ) | (7,408 | ) | (1,872 | ) | | (25.3 | )% | |
Net cash provided by (used in) financing activities | | 2,117 | | (4,180 | ) | 6,297 | | | 150.6 | % | |
Effect of exchange rate changes on cash and cash equivalents | | (65 | ) | 48 | | (113 | ) | | 235.4 | % | |
Net increase (decrease) in cash | | $ | (975 | ) | $ | (2,005 | ) | $ | 1,030 | | | (51.4 | )% | |
The decrease in net cash provided by operating activities from FY 2006 to FY 2007 was primarily due to the decrease in net income and the decrease in change in accrued expenses. The Company used the cash generated from its operating activities primarily to pay for capital expenditures. The increase in net cash used for investing activities is primarily due to increased spending for acquisitions. The increase in net cash provided by financing activities was primarily due to borrowings related to the common stock repurchase
18
of $3,893,000 from a former executive officer and director of the Company. Overall, net cash decreased by $975,000 in fiscal 2007, compared to a decrease of $2,005,000 in fiscal 2006.
Critical Accounting Policies
The consolidated financial statements of the Company are prepared in accordance with U.S. generally accepted accounting principles (“GAAP”), which require the Company to make certain estimates and assumptions (see Note 1 to the consolidated financial statements in Item 8). Estimates are based on historical experience and on various other assumptions that are believed to be reasonable under the circumstances, the results of which form the basis for making judgments about the carrying value of assets and liabilities that are not readily apparent from other sources.
Management believes the following critical accounting policies, among others, affect its more significant judgments and estimates used in the preparation of its consolidated financial statements.
Revenue Recognition
Revenues are derived from development, qualification and production testing and engineering services for commercial products, space systems and military equipment of all types. The Company also provides technical staffing, qualification of safety related systems and components, and ISO 9000 certification services.
Revenue from fixed price testing contracts is generally recorded upon completion of the contracts, which are generally short-term, or upon completion of identifiable contractual tasks. At the time the Company enters into a contract that includes multiple tasks, the Company estimates the amount of actual labor and other costs that will be required to complete each task based on historical experience. Revenues are recognized which provide for a profit margin relative to the testing performed. Revenue relative to each task and from contracts which are time and materials based is recorded as effort is expended. Billings in excess of amounts earned are deferred. Any anticipated losses on contracts are charged to income when identified. To the extent management does not accurately forecast the level of effort required to complete a contract, or individual tasks within a contract, and the Company is unable to negotiate additional billings with a customer for cost over-runs, the Company may incur losses on individual contracts. All selling, general and administrative costs are treated as period costs and expensed as incurred.
Reimbursements made to the Company by customers under contract provisions, including those related to travel and other out-of-pocket expenses are recorded as revenues. An equivalent amount of reimbursable expenses is recorded as cost of sales.
Allowance for Uncollectible Receivables
The Company maintains an allowance for doubtful accounts for estimated losses resulting from the inability of customers to make required payments. The Company uses a combination of write-off history, aging analysis and any specific known troubled accounts in determining the allowance. If the financial condition of customers were to deteriorate, resulting in an impairment of their ability to make payments, additional allowances could be required.
Inventories
Inventories consist of accumulated costs including direct labor, material and overhead applicable to uncompleted contracts and are stated at actual cost, which is not in excess of estimated net realizable value. Such inventories for each contract are reviewed on a monthly basis over the life of the contract and additional write-downs of inventories are made if there are insufficient revenues remaining on the contract.
19
Accounting for Income Taxes
We account for income taxes under the liability method. Deferred tax assets and liabilities are recognized for the future tax consequences attributable to temporary differences between the financial statement carrying amounts of existing assets and liabilities and their respective tax bases and operating loss and tax credit carryforwards. Deferred tax assets and liabilities are measured using enacted tax rates expected to apply to taxable income in the years in which those temporary differences are expected to be recovered or settled. The effect on deferred tax assets and liabilities of a change in tax rates is recognized in income in the period that includes the enactment date. We record a valuation allowance, if necessary, to reduce deferred tax assets to an amount management believes is more likely than not to be realized.
To the extent that we have deferred tax assets, we must assess the likelihood that our deferred tax assets will be recovered from taxable temporary differences, tax strategies or future taxable income and to the extent that we believe that recovery is not likely, we must establish a valuation allowance. As of January 31, 2007 and 2006, we have not established a valuation allowance against our deferred tax assets. In the future, we may adjust our estimates of the amount of valuation allowance needed and such adjustment would impact our provision for income taxes in the period of such change.
Recently Issued Accounting Standards
In May 2005, the FASB issued SFAS No. 154, “Accounting Changes and Error Corrections.” SFAS No. 154 replaces APB Opinion No. 20, “Accounting Changes,” and SFAS No. 3, “Reporting Accounting Changes in Interim Financial Statements,” and is effective for fiscal years beginning after December 15, 2005, i.e. fiscal year ending January 31, 2007. SFAS No. 154 requires retrospective application to prior periods’ financial statements of changes in accounting principle, unless it is impracticable to determine either the period-specific effects or the cumulative effect of the change. The adoption of SFAS No. 154 did not have a material impact on the Company’s condensed consolidated financial statements.
In June 2006, the Financial Accounting Standards Board issued Interpretation No. 48, “Accounting for Uncertainty in Income Taxes”, an interpretation of FAS109, Accounting for Income Taxes (FIN 48), to create a single model to address accounting for uncertainty in tax positions. FIN 48 clarifies the accounting for income taxes, by prescribing a minimum recognition threshold a tax position is required to meet before being recognized in the financial statements. FIN 48 also provides guidance on derecognition, measurement, classification, interest and penalties, accounting in interim periods, disclosure and transition. FIN 48 is effective for fiscal years beginning after December 15, 2006. The Company will adopt FIN 48 effective February 1, 2007, as required. The cumulative effect of adopting FIN 48, if any, will be recorded in retained earnings and other accounts as applicable. The Company does not expect that the adoption of FIN 48 will have a significant impact on the Company’s financial position, cash flows, or results of operations.
In September 2006, the FASB issued SFAS No. 157, “Fair Value Measurements” (“SFAS 157”), which clarifies the definition of fair value, establishes guidelines for measuring fair value, and expands disclosures regarding fair value measurements. SFAS 157 does not require any new fair value measurements and eliminates inconsistencies in guidance found in various prior accounting pronouncements. SFAS 157 will be effective for the Company on February 1, 2008. The Company will be evaluating the impact of adopting SFAS 157 on its financial position, cash flows, and results of operations.
In September 2006, the Securities and Exchange Commission (“SEC”) released Staff Accounting Bulletin No. 108, “Considering the Effects of Prior Year Misstatements when Quantifying Misstatements in Current Year Financial Statements” (“SAB 108”). SAB 108 provides interpretive guidance on the SEC’s views on how the effects of the carryover or reversal of prior year misstatements should be considered in quantifying a current year misstatement. The Company adopted the provisions of SAB 108 during the year ended January 31, 2007, and, as a result, corrected one prior period misstatement that related to an
20
understatement of deferred tax liabilities for accumulated depreciation in the amount of $354,000. This correction was accounted for as a cumulative effect adjustment under the transition provisions of SAB 108, whereby the difference is recorded as an adjustment to beginning retained earnings in the year of adoption.
Off-Balance Sheet Arrangements
The Company does not have any special purpose entities or off-balance sheet financing arrangements.
Results of Operations
The following discussion should be read in conjunction with the consolidated financial statements and notes thereto.
REVENUES
| | Twelve months ended January 31, | |
| | 2007 | | % Change | | 2006 | | % Change | | 2005 | |
| | (Dollars in thousands) | |
Engineering & Evaluation | | $ | 80,030 | | | 10.5 | % | | $ | 72,411 | | | 15.4 | % | | $ | 62,753 | |
Technical Solutions | | 35,643 | | | (8.9 | )% | | 39,113 | | | (10.6 | )% | | 43,761 | |
Total revenues | | $ | 115,673 | | | 3.7 | % | | $ | 111,524 | | | 4.7% | | | $ | 106,514 | |
For the year ended January 31, 2007, total revenues increased $4,149,000 or 3.7%, as compared to the prior year. The year over year growth was primarily attributable to strong organic growth in the Engineering and Evaluation segment combined with growth from acquisitions, offset by a decrease in revenues in the Technical Solutions segment.
For the year ended January 31, 2006, total revenues increased $5,010,000 or 4.7%, as compared to fiscal 2005.
Engineering & Evaluation:
For the year ended January 31, 2007, revenues in the Engineering & Evaluation segment increased $7,619,000 or 10.5%, as compared to the prior year, primarily due to additional revenues of $2,844,000 from the acquisition on June 9, 2006 of B&B Technologies, an engineering systems integration company located in Albuquerque, New Mexico, $2.1 million in increased aerospace revenues from the Santa Clarita, California laboratory as a result of the enhanced capability and capacity at that facility and increases in revenues from telecommunications, electronics, power products and registration markets. These increases were partially offset by decreases in the automotive testing business at the Detroit, Michigan facility and defense testing business at the Camden, Arkansas facility.
For the year ended January 31, 2006, revenues in the Engineering & Evaluation segment increased $9,658,000 or 15.4%, as compared to the prior year, primarily due to strong testing revenues in the aerospace and defense markets. Revenues also increased in the telecommunications market, as a result of additional revenues of $1,330,000 from the acquisition of the testing laboratory in Calgary, Canada on August 1, 2004 and revenues of $934,000 from the acquisition of Phase Seven Laboratories in Santa Rosa, California on March 18, 2005. These increases were partially offset by a decrease in passive fiber optic testing, and decrease in the electronic and automotive testing businesses.
Technical Solutions:
For the year ended January 31, 2007, revenues in the Technical Solutions segment decreased by $3,470,000 or 8.9%, as compared to fiscal 2006. This was primarily due to the continuing price compression
21
in this market as a result of customers insisting on fixed mark-up pricing and delay in hiring at two major customer sites, causing a temporary decrease in revenues.
For the year ended January 31, 2006, revenues in the Technical Solutions segment decreased by $4,648,000 or 10.6%, as compared to the prior year, primarily due to the competitive environment in the general IT service business from off-shore companies and the discontinuance of certain services that did not fit the Company’s overall strategy.
GROSS PROFIT
| | Twelve months ended January 31, | |
| | 2007 | | % Change | | 2006 | | % Change | | 2005 | |
| | (Dollars in thousands) | |
Engineering & Evaluation | | $ | 20,678 | | | 1.3 | % | | $ | 20,422 | | | 22.1 | % | | $ | 16,724 | |
% to segment revenue | | 25.8 | % | | | | | 28.2 | % | | | | | 26.7 | % |
Technical Solutions | | 5,965 | | | (12.4 | )% | | 6,808 | | | (2.2 | )% | | 6,963 | |
% to segment revenue | | 16.7 | % | | | | | 17.4 | % | | | | | 15.9 | % |
Total | | $ | 26,643 | | | (2.2 | )% | | $ | 27,230 | | | 15.0 | % | | $ | 23,687 | |
% to total revenue | | 23.0 | % | | | | | 24.4 | % | | | | | 22.2 | % |
For the year ended January 31, 2007, total gross profit decreased $587,000 or 2.2%, as compared to the prior year. The year over year decrease was primarily attributable to the lower revenues in the Technical Solutions segment and various factors as discussed below impacting Engineering & Evaluation’s gross margins.
For the year ended January 31, 2006, total gross profit increased $3,543,000 or 15.0%, as compared to fiscal 2005.
Engineering & Evaluation:
For the year ended January 31, 2007, gross profit in the Engineering & Evaluation segment increased by $256,000 or 1.3%, as compared to the prior year. Gross profit margin as a percentage of revenues decreased to 25.8% in the current year from 28.2%, primarily as a result of the weakness in the automotive industry, program delays by customers at the Camden, Arkansas facility and lower gross margins at the Company’s Tinton Falls, New Jersey and Santa Rosa, California facilities as a result of the investments made for expansion at these facilities and not achieving the desired revenues. Gross profit was also impacted by high energy costs, particularly at the Santa Clarita, California facility and losses from one program at Santa Clarita due to contractual issues. The performance at the Company’s Fullerton, California facility was negatively impacted during the second quarter as a result of a quality system deficiency in the Company’s “NEBS” (Network Equipment Building Specification) testing under the “ITL” (Independent Test Laboratory) program and suspended testing under this program. The testing was reinstated after the Company took the necessary corrective actions. Additionally, share-based compensation expense included in cost of sales for the year ended January 31, 2007 was $135,000, compared with no share-based compensation expense in fiscal 2006.
For the year ended January 31, 2006, gross profit in the Engineering & Evaluation segment increased by $3,698,000 or 22.1%, as compared to the prior year, primarily as a result of the revenue increase discussed above. Gross profit margin as a percentage of revenues increased to 28.2% in the current year from 26.7% in the prior year, primarily due to labor cost containments as a result of improved process efficiencies. This was offset by increases in depreciation expense as a result of capital spending on machinery and equipment and increases in utilities expense.
22
Technical Solutions:
For the year ended January 31, 2007, gross profit in the Technical Solutions segment decreased by $843,000 or 12.4%, as compared to the prior year, primarily as a result of the decrease in revenues. Gross profit margin as a percentage of revenues decreased to 16.7% in the current year from 17.4% in the prior year, due to the continuing price compression.
For the year ended January 31, 2006, gross profit in the Technical Solutions segment decreased by $155,000 or 2.2%, as compared to the prior year, primarily as a result of the revenue decrease discussed above. The Company was successful in minimizing this decrease as a result of the increased focus on specialized compliance and engineering support services, which generally produce higher margins.
SELLING, GENERAL & ADMINISTRATIVE
| | Twelve months ended January 31, | |
| | 2007 | | % Change | | 2006 | | % Change | | 2005 | |
| | (Dollars in thousands) | |
Engineering & Evaluation | | $ | 16,391 | | | 7.5 | % | | $ | 15,246 | | | 6.7 | % | | $ | 14,290 | |
% to segment revenue | | 20.5 | % | | | | | 21.1 | % | | | | | 22.8 | % |
Technical Solutions | | 5,785 | | | (6.2 | )% | | 6,166 | | | (3.0 | )% | | 6,359 | |
% to segment revenue | | 16.2 | % | | | | | 15.8 | % | | | | | 14.5 | % |
Total | | $ | 22,176 | | | 3.6 | % | | $ | 21,412 | | | 3.7 | % | | $ | 20,649 | |
% to total revenue | | 19.2 | % | | | | | 19.2 | % | | | | | 19.4 | % |
For the year ended January 31, 2007, total selling, general and administrative expenses increased $764,000 or 3.6%, as compared to the prior year. The year over year growth was primarily attributable to increased general and administrative costs in the Engineering & Evaluation segment, offset by a reduction in selling and general and administrative costs in the Technical Solutions segment.
For the year ended January 31, 2006, total selling, general and administrative expenses increased $763,000 or 3.7%, as compared to fiscal 2005.
Engineering & Evaluation:
For the year ended January 31, 2007, selling, general and administrative expenses increased by $1,145,000 or 7.5%, as compared to the prior year, primarily due to the effects of share-based compensation expense of $434,000 resulting from the application of SFAS No. 123(R), as described in Notes 1 and 5 of the consolidated financial statements, and increased use of outside services related to the improvement of the Company’s internal IT infrastructure and data automation and increased travel and conference expenses.
For the year ended January 31, 2006, selling, general and administrative expenses increased by $956,000 or 6.7%, as compared to the prior year, primarily due to increased wages and incentive compensation, increased use of outside services related to the improvement of the Company’s internal IT infrastructure and data automation and increased legal expense.
Technical Solutions:
For the year ended January 31, 2007, selling, general and administrative expenses decreased by $381,000 or 6.2% as compared to the prior year, primarily due to the reduction in selling costs associated with the lower revenues and lower depreciation expense.
23
For the year ended January 31, 2006, selling, general and administrative expenses decreased by $193,000 or 3.0% as compared to the prior year, primarily due to decreases in depreciation expense, general and administrative salaries and selling costs associated with the lower revenues.
Equity Income from Non-Consolidated Subsidiary:
Engineering & Evaluation:
For the year ended January 31, 2007, equity income from XXCAL Japan was $201,000, compared to $259,000 in the prior year. The decrease of $58,000 was primarily due to increased operating costs related to training on new testing initiatives. XXCAL Japan is 50% owned by NTS and is accounted for under the equity method since NTS does not have management or board control.
For the year ended January 31, 2006, equity income from XXCAL Japan was $259,000, compared to $483,000 in the prior year. The decrease of $224,000 was primarily due to lower revenues caused by a reduction in test requirements from a major Japanese customer and increased operating costs related to hiring and training additional technical personnel for new testing initiatives.
OPERATING INCOME
| | Twelve months ended January 31, | |
| | 2007 | | % Change | | 2006 | | % Change | | 2005 | |
| | (Dollars in thousands) | |
Engineering & Evaluation | | $ | 4,488 | | | (17.4 | )% | | $ | 5,435 | | | 86.3 | % | | $ | 2,917 | |
% to segment revenue | | 5.6 | % | | | | | 7.5 | % | | | | | 4.6 | % |
Technical Solutions | | 180 | | | (72.0 | )% | | 642 | | | 6.3 | % | | 604 | |
% to segment revenue | | 0.5 | % | | | | | 1.6 | % | | | | | 1.4 | % |
Total | | $ | 4,668 | | | (23.2 | )% | | $ | 6,077 | | | 72.6 | % | | $ | 3,521 | |
% to total revenue | | 4.0 | % | | | | | 5.4 | % | | | | | 3.3 | % |
For the year ended January 31, 2007, operating income decreased $1,409,000 or 23.2%, as compared to the prior year. The year over year decrease was attributable to the lower gross profit and the increase in selling, general and administrative expenses.
For the year ended January 31, 2006, operating income increased $2,556,000 or 72.6%, as compared to fiscal 2005.
Engineering & Evaluation:
For the year ended January 31, 2007, operating income decreased by $947,000 or 17.4%, as compared to the prior year, as a result of the increase in selling, general and administrative expenses, partially offset by a slight increase in gross profit.
For the year ended January 31, 2006, operating income increased by $2,518,000 or 86.3%, as compared to the prior year, as a result of the increase in gross profit discussed above, partially offset by the increase in selling, general and administrative expenses.
Technical Solutions:
For the year ended January 31, 2007, operating income decreased by $462,000 or 72.0%, as compared to the prior year, as a result of the decrease in gross profit, partially offset by the decrease in selling, general and administrative expenses discussed above.
24
For the year ended January 31, 2006, operating income increased by $38,000 or 6.2%, as compared to the prior year, as a result of the decrease in selling and general and administrative expenses discussed above, partially offset by the decrease in gross profit discussed above.
Interest Expense
Interest expense increased $503,000 in fiscal 2007 when compared to fiscal 2006 primarily due to higher interest rate levels in fiscal 2007 and higher average debt balances in fiscal 2007, as compared to the prior year. The higher debt balance in fiscal 2007 was primarily due to $3.9 million in borrowings to repurchase 792,266 shares of its common stock from a former executive officer and director of the Company and borrowings for the Dynamic Labs acquisition.
Interest expense increased $207,000 in fiscal 2006 when compared to fiscal 2005 primarily due to higher interest rate levels in fiscal 2006 offset by lower average debt balances in fiscal 2006, as compared to the prior year.
Other Income
Other income of $111,000 in fiscal 2007 is primarily attributable to gains from investments in life insurance policies. Other income of $176,000 in fiscal 2006 includes approximately $163,000 in gain from the sale of real estate.
Income Taxes
The provisional income tax rate for fiscal year 2007 is 44.0%, compared to 39.7% in the prior year. The increase in the income tax rate in fiscal 2007 was primarily due to non-deductible share-based compensation expense recorded for fiscal year 2007, as compared to none for the prior year. The income tax rate for fiscal year 2005 was 35.1%. See Note 4 to the consolidated financial statements for a reconciliation of the provision for income taxes from continuing operations at the statutory rate to the provision for income taxes from continuing operations.
Management has determined that it is more likely than not that the Company’s deferred tax asset will be realized on the basis of offsetting it against deferred tax liabilities and future income. The Company analyzes the value of the deferred income tax asset quarterly in conjunction with external reporting.
Net Income
In fiscal 2007, net income decreased $1,358,000 to $1,581,000, as compared to the prior year, primarily due to the decrease in operating income, the increase in interest expense, and the increase in the income tax rate and minority interest.
In fiscal 2006, net income increased $1,257,000 to $2,939,000, as compared to the prior year, primarily due to the increase in operating income, partially offset by the increase in interest expense, increase in the income tax rate and minority interest expense.
Business Environment
The defense and aerospace markets generate 58% of the overall Engineering and Evaluation testing revenues. With the federal fiscal 2007 budget enacted, the United States Department of Defense (“DOD”) will receive a record research and development test and engineering budget of $76.8 billion, an increase of 4.8% from $73.2 billion in fiscal 2006. The two big defense winners are the Air Force and the Missile Defense Agency. The aerospace industry continues to experience steady growth. Aerospace sales are projected to increase from $184 billion in fiscal 2006 to $195 billion in fiscal 2007. The largest increase is expected in the civil aircraft sector with industry sales expected to increase from $47.5 billion in fiscal 2006
25
to $54.6 billion in fiscal 2007. In addition, there is a slight expected growth in industry sales for the space, military, aircraft and missile sectors. The Company has also noted an increase recently in funding for the evaluation of military equipment and weapons systems. The Company expects the increased funding will positively affect business at its laboratories. Management believes the Camden, Arkansas facility will benefit the most from the increase in defense spending because of its unique capability to service the missile sector. The Company expects the facilities in Boxborough, Massachusetts and in Fullerton, Santa Clarita and Los Angeles, California to benefit most from the increase in aerospace spending as the Company anticipates the level of customer demand from expected increases in DOD and aerospace research and development spending will increase for the foreseeable future.
The telecommunications worldwide market is showing a much higher growth rate of wireless service in comparison to wireline service. Wireless service revenue is forecasted to grow at 9.9 percent over the next several years, while wireline service is forecasted to grow more modestly at 2.0 percent. Broadband service providers continue to create viable business models in order to deliver high-speed broadband, leveraging internet protocol (IP) packet delivery to create and deliver new services. Many incumbent US carriers are choosing to initially implement IP-based services on an overlay network. Taking this approach, carriers do not have to replace circuit-switched networks elements, which represent sunk costs and have minimal ongoing operational expenses. The next-generation communications networks will require carriers to update systems and equipment at all levels of the telecommunications network architecture. These updates will require compliance, interoperability and testing support. The Company is well positioned to provide this support. It has been approved as an Independent Test laboratory (ITL) by most of the US carriers to test and certify central office equipment developed by manufacturers to the Network Equipment Building Specifications (NEBS). The Company is currently providing this service at Laboratories in California, Massachusetts, Texas, Alberta, Canada and Germany. The Company has been approved as an (ITL) to provide Digital Subscriber Line (DSL) certification and recently been approved for multimedia over coax testing (MoCA) .
The transportation market in the US continues to face stiff competition from global automotive manufacturers. This trend is expected to continue for the foreseeable future. However, NTS continues to gain market share and has experienced a slight increase in transportation related revenues for FY 2007 compared FY 2006, particularly at its California and Arizona facilities.
The power industry experienced an increase in demand for safety related products and test and certifications activity. As a result, NTS has experienced an incremental year-over-year growth of approximately 19% in this market sector. Currently, the United States is engaged in discussions with India to develop an agreement titled “123 agreement” which will allow India to receive technology and reactors from the United States. Passage of this agreement could create an increase in demand for NTS services.
The computer and electronics markets have been stable, with the Company experiencing an increase in revenues in this industry. The Company anticipates growth in these markets as it captures additional market share due to expansion in international markets. NTS signed an agreement in fiscal 2007 with TTA in South Korea to perform Zigbee certification testing and has been selected to manage the testing for Video Electronics Standards Association’s (VESA) new DisplayPort(TM) interface standard. The Company believes that the demand for these certification activities will increase in Asia.
In the Technical Solutions segment, the Company provides a variety of staffing and workforce management services and solutions, including contract, contract-to-hire and full time placements to meet its customers’ needs with a focus on IT and engineering. As the IT general services business moved off-shore and came to be treated as a commodity by larger organizations, the Company deployed a transformation strategy in 2003 which focused on meeting the anticipated increase in demand for specialized IT, compliance, engineering support services at Company locations as well as taking advantage of offshore opportunities. As part of this transformation, the Company developed a proprietary database
26
and put in place a customer service team which maintains relationships and manages the availability of the technical experts which support these specialized services. The Company has also set up a test and compliance laboratory in Vietnam to support the needs of a major US Fortune 500 computer company and to take advantage of the low cost highly skilled labor in Vietnam. The Company is now expanding this offshore offering to additional customers. TS continues to differentiate itself from its competitors by using NTS testing, engineering and compliance capabilities to maximize its customers’ return on human assets.
Notwithstanding the foregoing and because of factors affecting the Company’s operating results, past financial performance should not be considered to be a reliable indicator of future performance.
Liquidity and Capital Resources
Summary of cash flows:
| | FY 2007 | | FY 2006 | | FY 2005 | |
| | (Dollars in thousands) | |
Net cash provided by operating activities | | $ | 6,253 | | $ | 9,535 | | $ | 6,590 | |
Net cash used for investing activities | | (9,280 | ) | (7,408 | ) | (6,089 | ) |
Net cash provided by (used in) financing activities | | 2,117 | | (4,180 | ) | 1,026 | |
Effect of exchange rate changes on cash and cash equivalents | | (65 | ) | 48 | | 13 | |
Net increase (decrease) in cash | | $ | (975 | ) | $ | (2,005 | ) | $ | 1,540 | |
Net cash provided by operating activities of $6,253,000 in fiscal 2007 consisted of net income of $1,581,000, adjusted for non-cash items of $5,822,000 in depreciation and amortization, share-based compensation of $569,000, partially offset by $1,658,000 of changes in working capital and $61,000 in other non-cash items. The decrease in cash provided by operating activities from fiscal 2006 to fiscal 2007 was primarily the result of the lower net income in fiscal 2007 and the change in accrued expenses. Net cash provided by operating activities of $9,535,000 in fiscal 2006 consisted of net income of $2,939,000 adjusted for non-cash items of $5,283,000 in depreciation and amortization and $1,760,000 of changes in working capital and other activities, partially offset by $447,000 in other non-cash items. The increase in cash provided by operating activities from fiscal 2005 to fiscal 2006 was primarily the result of higher net income in fiscal 2006, the changes in accounts payable, accrued expenses and income taxes, partially offset by the changes in accounts receivable and inventories. Net cash provided by operating activities of $6,590,000 in fiscal 2005 consisted of net income of $1,682,000 adjusted for non-cash items of $4,798,000 in depreciation and amortization and $302,000 in other non-cash items, partially offset by $192,000 of changes in working capital and other activities. The decrease in cash provided by operating activities from fiscal 2004 to fiscal 2005 was primarily the result of the change in accounts receivable, the increase in accounts payable payments, partially offset by the higher net income in fiscal 2005.
Net cash used for investing activities in fiscal 2007 of $9,280,000 was primarily attributable to capital spending of $6,028,000, cash used to acquire American International Registrars Corporation (“AIR”) of $386,000, cash used to acquire B&B Technologies of $414,000 and cash used to acquire Dynamic Labs of $2,254,000. Capital spending is generally comprised of purchases of machinery and equipment, building, leasehold improvements, computer hardware, software and furniture and fixtures. Cash used in investing activities increased from fiscal 2006 to fiscal 2007 by $1,872,000 primarily as a result of the increase in cash used for acquisitions. Net cash used for investing activities in fiscal 2006 of $7,408,000 was primarily attributable to capital spending of $7,287,000 and cash used in the acquisition of Phase Seven Laboratories in the amount of $483,000, partially offset by proceeds from the sale of real estate of $543,000. Cash used in investing activities increased from fiscal 2005 to fiscal 2006 by $1,319,000 primarily as a result of an increase in capital spending of $2,098,000, in fiscal 2006, partially offset by a decrease of $550,000 in cash spent on acquisitions. Net cash used for investing activities in fiscal 2005 of $6,089,000 was primarily
27
attributable to capital spending of $5,189,000 and cash used in the acquisition of the Canadian test laboratory for $1,033,000, partially offset by proceeds from the sale of real estate of $311,000. Cash used in investing activities decreased from fiscal 2004 to fiscal 2005 by $1,381,000 primarily as a result of the acquisition of DTI in fiscal 2004.
Net cash provided by financing activities in fiscal 2007 of $2,117,000, consisted of proceeds from borrowings of $15,326,000, proceeds from stock options exercised of $633,000, partially offset by repayment of debt of $9,949,000, and common stock repurchase of $3,893,000 from a former executive officer and director of the Company. Net cash used for financing activities in fiscal 2006 of $4,180,000 consisted of repayments of debt of $7,075,000, partially offset by proceeds from borrowings of $2,651,000 and proceeds from stock options exercised of $244,000. Net cash provided by financing activities in fiscal 2005 of $1,026,000 consisted of proceeds from borrowings of $2,228,000, proceeds from stock options exercised of $300,000, partially offset by repayments of debt of $1,502,000.
On November 25, 2002, the Company increased the revolving line of credit under its credit agreement with Comerica Bank California and First Bank to $20,000,000. Comerica Bank California, as the agent, retained 60% of the line with First Bank, as the participant, holding 40% of the line. The revolving line of credit was reduced by $1,750,000 on August 1, 2003 and was reduced again on August 1, 2004 by $1,750,000, bringing the line of credit balance down to $16,500,000. The interest rate is at the agent’s prime rate, with an option for the Company to convert to loans at the Libor rate plus 250 basis points for 30, 60, 90, 180 or 365 days, with minimum advances of $1,000,000. The Company paid a 0.5% commitment fee of the total line amount and is paying an additional 0.25% of the commitment amount annually and a 0.25% fee for any unused line of credit.
On July 1, 2005, the agreement was amended to include a $2,500,000 term loan to be repaid in 60 equal monthly payments. The proceeds were used to pay down the line of credit. In addition, the requirement of the $1,750,000 reduction of the line was removed from the agreement. The amendment also included an additional equipment line of credit for $2,000,000. On March 29, 2006, the Company increased the term loan by an additional $3,900,000 to fund the repurchase of 792,266 shares of common stock from a former executive officer and director, as discussed above. On September 21, 2006, the agreement was amended again to include an additional equipment line of credit of $2,000,000 and an additional $2,000,000 in term loan, to be repaid in 48 equal monthly payments, to fund the purchase of Dynamic Labs. The outstanding balance on the revolving line of credit at January 31, 2007 was $8,843,000. This balance is reflected in the accompanying condensed consolidated balance sheets as long-term. The amount available on the line of credit was $7,657,000 as of January 31, 2007. The aggregate outstanding balance on the term loans at January 31, 2007 was $6,587,000. The aggregate outstanding balance on the equipment line of credit at January 31, 2007 was $3,441,000. This agreement is subject to certain covenants, which require the maintenance of certain working capital, debt-to-equity, earnings-to-expense and cash flow ratios. The Company requested and received waivers for two covenants from its banks to remain compliant with the bank covenants as of January 31, 2007.
The Company has additional equipment line of credit agreements (at interest rates of 5.56% to 7.47%) to finance various test equipment with terms of 60 months for each equipment schedule. The outstanding balance at January 31, 2007 was $1,237,000. The balance of other notes payable collateralized by land and building was $2,415,000.
28
Contractual Obligations:
| | Payments due by period | |
| | Total | | Due in
2008 | | Due in
2009-2010 | | Due in
2011-2012 | | Thereafter | |
| | (Dollars in thousands) | |
Long-term debt | | $ | 22,523 | | $ | 3,285 | | | $ | 15,889 | | | | $ | 1,957 | | | | $ | 1,392 | | |
Operating lease obligations | | 6,660 | | 2,456 | | | 3,228 | | | | 976 | | | | — | | |
Total | | $ | 29,183 | | $ | 5,741 | | | $ | 19,117 | | | | $ | 2,933 | | | | $ | 1,392 | | |
Management is not aware of any significant demands for capital funds that may materially affect short or long-term liquidity in the form of large fixed asset acquisitions, unusual working capital commitments or contingent liabilities. In addition, the Company has made no material commitments for capital expenditures. The Company’s long-term debt may be accelerated if the Company fails to meet its covenants with its banks. The Company believes that the cash flow from operations and the revolving line of credit will be sufficient to fund its operations for the next twelve months.
ITEM 7A. QUANTITATIVE AND QUALITATIVE DISCLOSURES ABOUT MARKET RISK.
Interest Rate Risk
The Company is exposed to changes in interest rates primarily from its long-term revolving line of credit arrangement. Under its current policies, the Company does not use interest rate derivative instruments to manage exposure to interest rate changes. A hypothetical one percentage point adverse move in interest rates along the entire interest rate yield curve would adversely affect interest expense by $88,000 at January 31, 2007 as compared to $85,000 at January 31, 2006.
Environmental Matters
An internal environmental compliance group formed in 1991 continues to review environmental matters for the Company.
Although the Company’s business does not involve the manufacture or extensive use of hazardous substances, the Company does have a program to ensure compliance with applicable environmental laws at its various testing facilities, which includes conducting regular internal audits to identify and categorize potential environmental exposure.
The Company’s Santa Clarita, California test facility is located immediately adjacent to property owned by a third party which has been the subject of extensive environmental remediation. The adjacent site has, in the past, been used for manufacture of solid rocket fuel propellants, munitions and flares that contained perchlorate, a hazardous substance. Soil samples taken from the western portion of the Santa Clarita property in 2003 were inconclusive as to the existence of perchlorate. Further testing is planned in cooperation with the government agency having oversight responsibility for the adjacent site. No cleanup activity has been conducted on the Santa Clarita property and it has yet to be determined whether remediation will be required at the site, or, if required, the extent and cost of any remediation. The Company believes that in the event it does incur remediation costs on the western portion of the property, that it will have valid claims for indemnification against the owner of the adjacent site and the municipality that built a road between the adjacent site and the Santa Clarita property that appears to have contributed to the runoff from the adjacent site. Recovery of such remediation costs may, however, be uncertain and may involve significant litigation expense.
In January 2007, a sampling program was conducted on the eastern portion of the site in accordance with a voluntary clean up agreement the Company entered into with the Department of Toxic Substance Control (DTSC). The sampling did not detect any perchlorate in the soil, but one surface sample at a
29
hazardous materials storage area did detect lead, cadmium, chromium, copper and nickel at concentrations in excess of typical background levels. As a result, additional testing will be conducted at that location to determine the extent of the levels of the identified compounds. The extent and cost of remediation, if any is required, is unknown at this time.
Impact of Inflation
The Company continues to incur increased costs in the areas of wages, insurance, workers compensation, and utilities which it cannot pass along to customers in the current economic environment. To date, these increases have been partially offset by reductions in other operating areas through improved efficiencies. The Company can give no assurances, however, that in the future it can offset such increased costs.
30
ITEM 8. FINANCIAL STATEMENTS AND SUPPLEMENTARY DATA.
Index to Consolidated Financial Statements and Schedule
All other schedules are omitted as inapplicable or because the required information is contained in the financial statements or the notes thereto.
31
REPORT OF INDEPENDENT REGISTERED PUBLIC ACCOUNTING FIRM
The Board of Directors and Shareholders
National Technical Systems, Inc.
We have audited the accompanying consolidated balance sheets of National Technical Systems, Inc. and Subsidiaries as of January 31, 2007 and 2006, and the related consolidated statements of income, shareholders’ equity and cash flows for each of the three years in the period ended January 31, 2007. Our audits also included the financial statement schedule listed in the Index at Item 15(A). These financial statements and schedule are the responsibility of the Company’s management. Our responsibility is to express an opinion on these financial statements and schedule based on our audits. We did not audit the financial statements of NQA, Inc., a 50% owned consolidated subsidiary, which statements reflect total assets constituting $2,597,000 in 2007 and $2,214,000 in 2006 and total revenues constituting $7,463,000 in 2007, $6,714,000 in 2006 and $6,896,000 in 2005 of the related consolidated totals. Those statements were audited by other auditors whose report has been furnished to us, and our opinion, insofar as it relates to the amounts included for NQA, Inc., is based solely on the report of the other auditors. The financial statements of XXCAL Japan, a corporation in which the Company has a 50% interest and accounted for by the Company under the equity method, have been audited by other auditors whose report has been furnished to us, and our opinion on the consolidated financial statements, insofar as it relates to the amounts included for XXCAL Japan, is based solely on the report of the other auditors. In the consolidated financial statements, the Company’s investment in XXCAL Japan is stated at $1,220,000 and $1,019,000, respectively, at January 31, 2007 and 2006, and the Company’s equity in the net income of XXCAL Japan is stated at $201,000, $259,000 and $483,000, for the years ended January 31, 2007, 2006 and 2005, respectively.
We conducted our audits in accordance with the standards of the Public Company Accounting Oversight Board (United States). Those standards require that we plan and perform the audit to obtain reasonable assurance about whether the financial statements are free of material misstatement. We were not engaged to perform an audit of the Company’s internal control over financial reporting. Our audits included consideration of internal control over financial reporting as a basis for designing audit procedures that are appropriate in the circumstances, but not for the purpose of expressing an opinion on the effectiveness of the Company’s internal control over financial reporting. Accordingly, we express no such opinion. An audit also includes examining, on a test basis, evidence supporting the amounts and disclosures in the financial statements, assessing the accounting principles used and significant estimates made by management, and evaluating the overall financial statement presentation. We believe that our audits and the reports of other auditors provide a reasonable basis for our opinion.
In our opinion, based on our audits and the reports of other auditors, the financial statements referred to above present fairly, in all material respects, the consolidated financial position of National Technical Systems, Inc. and Subsidiaries at January 31, 2007 and 2006 and the consolidated results of their operations and their cash flows for each of the three years in the period ended January 31, 2007, in conformity with U.S. generally accepted accounting principles. Also, in our opinion, the related financial statement schedule, when considered in relation to the basic financial statements taken as a whole, presents fairly, in all material respects, the information set forth therein.
As discussed in Notes 1 and 5 to the consolidated financial statements, on February 1, 2006, the Company changed its method of accounting for share-based payments in accordance with Statement of Financial Accounting Standards No. 123(R).
Additionally, as discussed in Note 1 to the consolidated financial statements, the Company adopted Staff Accounting Bulletin No. 108, (“SAB 108”). The Company used the one time special transition provisions of SAB 108 and recorded an adjustment to retained earnings effective February 1, 2006, in order to correct a prior period error.
/s/ Ernst & Young LLP
Los Angeles, California
April 24, 2007
32
NATIONAL TECHNICAL SYSTEMS, INC. AND SUBSIDIARIES
Consolidated Balance Sheets
January 31,
| | 2007 | | 2006 | |
ASSETS | | | | | |
CURRENT ASSETS: | | | | | |
Cash | | $ | 3,221,000 | | $ | 4,196,000 | |
Accounts receivable, net of allowance for doubtful accounts of $691,000 at January 31, 2007 and $816,000 at January 31, 2006 | | 21,900,000 | | 20,425,000 | |
Income taxes receivable | | — | | 10,000 | |
Inventories | | 2,892,000 | | 2,184,000 | |
Deferred income taxes | | 1,690,000 | | 1,747,000 | |
Prepaid expenses | | 958,000 | | 769,000 | |
Total current assets | | 30,661,000 | | 29,331,000 | |
Property, plant and equipment, at cost | | | | | |
Land | | 1,415,000 | | 1,415,000 | |
Buildings | | 10,238,000 | | 10,172,000 | |
Machinery and equipment | | 78,513,000 | | 73,115,000 | |
Leasehold improvements | | 11,323,000 | | 9,185,000 | |
Total property, plant and equipment | | 101,489,000 | | 93,887,000 | |
Less: accumulated depreciation | | (66,055,000 | ) | (60,787,000 | ) |
Net property, plant and equipment | | 35,434,000 | | 33,100,000 | |
Goodwill | | 4,126,000 | | 2,740,000 | |
Other assets | | 4,618,000 | | 3,962,000 | |
TOTAL ASSETS | | $ | 74,839,000 | | $ | 69,133,000 | |
LIABILITIES AND SHAREHOLDERS’ EQUITY | | | | | |
CURRENT LIABILITIES: | | | | | |
Accounts payable | | $ | 5,843,000 | | $ | 4,715,000 | |
Accrued expenses | | 5,213,000 | | 5,400,000 | |
Income taxes payable | | 401,000 | | 594,000 | |
Deferred revenue | | 832,000 | | 817,000 | |
Current installments of long-term debt | | 3,285,000 | | 1,529,000 | |
Total current liabilities | | 15,574,000 | | 13,055,000 | |
Long-term debt, excluding current installments | | 19,238,000 | | 15,579,000 | |
Deferred income taxes | | 5,052,000 | | 5,084,000 | |
Deferred compensation | | 946,000 | | 874,000 | |
Minority interest liability | | 250,000 | | 163,000 | |
SHAREHOLDERS’ EQUITY: | | | | | |
Preferred stock, no par value, 2,000,000 shares authorized; none issued | | — | | — | |
Common stock, no par value. Authorized, 20,000,000 shares; issued and outstanding, 8,717,000 as of January 31, 2007 and 9,176,000 as of January 31, 2006 | | 12,863,000 | | 14,624,000 | |
Retained earnings | | 20,971,000 | | 19,744,000 | |
Accumulated other comprehensive (loss) income | | (55,000 | ) | 10,000 | |
Total shareholders’ equity | | 33,779,000 | | 34,378,000 | |
TOTAL LIABILITIES AND SHAREHOLDERS’ EQUITY | | $ | 74,839,000 | | $ | 69,133,000 | |
See accompanying notes.
33
NATIONAL TECHNICAL SYSTEMS, INC. AND SUBSIDIARIES
Consolidated Statements of Income
Years Ended January 31,
| | 2007 | | 2006 | | 2005 | |
Net revenues | | $ | 115,673,000 | | $ | 111,524,000 | | $ | 106,514,000 | |
Cost of sales | | 89,030,000 | | 84,294,000 | | 82,827,000 | |
Gross profit | | 26,643,000 | | 27,230,000 | | 23,687,000 | |
Selling, general and administrative expense | | 22,176,000 | | 21,412,000 | | 20,649,000 | |
Equity income from non-consolidated subsidiary | | (201,000 | ) | (259,000 | ) | (483,000 | ) |
Operating income | | 4,668,000 | | 6,077,000 | | 3,521,000 | |
Other income (expense): | | | | | | | |
Interest expense, net | | (1,801,000 | ) | (1,298,000 | ) | (1,091,000 | ) |
Other income, net | | 111,000 | | 176,000 | | 162,000 | |
Total other expense, net | | (1,690,000 | ) | (1,122,000 | ) | (929,000 | ) |
Income before income taxes and minority interest | | 2,978,000 | | 4,955,000 | | 2,592,000 | |
Income taxes | | 1,309,000 | | 1,966,000 | | 910,000 | |
Income before minority interest | | 1,669,000 | | 2,989,000 | | 1,682,000 | |
Minority interest in earnings | | (88,000 | ) | (50,000 | ) | — | |
Net income | | $ | 1,581,000 | | $ | 2,939,000 | | $ | 1,682,000 | |
Net income per common share: | | | | | | | |
Basic | | $ | 0.18 | | $ | 0.32 | | $ | 0.19 | |
Diluted | | $ | 0.17 | | $ | 0.30 | | $ | 0.18 | |
Weighted average common shares outstanding | | 8,705,000 | | 9,125,000 | | 8,946,000 | |
Dilutive effect of stock options | | 800,000 | | 537,000 | | 620,000 | |
Weighted average common shares outstanding, assuming dilution | | 9,505,000 | | 9,662,000 | | 9,566,000 | |
See accompanying notes.
34
NATIONAL TECHNICAL SYSTEMS, INC. AND SUBSIDIARIES
Consolidated Statements of Shareholders’ Equity
| | | | | | | | Accumulated | | | |
| | | | Common | | | | Other | | Total | |
| | Number of | | Stock | | Retained | | Comprehensive | | Shareholders’ | |
| | Shares | | Amount | | Earnings | | Income (Loss) | | Equity | |
Balance at January 31, 2004 | | 8,863,000 | | $ | 13,760,000 | | $ | 15,123,000 | | | $ | (51,000 | ) | | $ | 28,832,000 | |
Net income | | — | | — | | 1,682,000 | | | — | | | 1,682,000 | |
Foreign currency translation | | — | | — | | — | | | 13,000 | | | 13,000 | |
Comprehensive income | | | | | | | | | | | | 1,695,000 | |
Stock options exercised | | 173,000 | | 423,000 | | — | | | — | | | 423,000 | |
Stock retired for option exercise | | (25,000 | ) | (123,000 | ) | — | | | — | | | (123,000 | ) |
Issuance of restricted common stock for services | | 14,000 | | 50,000 | | — | | | — | | | 50,000 | |
Tax benefit from stock options exercise | | — | | 74,000 | | — | | | — | | | 74,000 | |
Balance at January 31, 2005 | | 9,025,000 | | $ | 14,184,000 | | $ | 16,805,000 | | | $ | (38,000 | ) | | $ | 30,951,000 | |
Net income | | — | | — | | 2,939,000 | | | — | | | 2,939,000 | |
Foreign currency translation | | — | | — | | — | | | 48,000 | | | 48,000 | |
Comprehensive income | | | | | | | | | | | | 2,987,000 | |
Stock options exercised | | 148,000 | | 414,000 | | — | | | — | | | 414,000 | |
Stock retired for option exercise | | (30,000 | ) | (170,000 | ) | — | | | — | | | (170,000 | ) |
Tax benefit from stock options exercise | | — | | 56,000 | | — | | | — | | | 56,000 | |
Stock issued for acquisition of Phase Seven Laboratories | | 33,000 | | 140,000 | | — | | | — | | | 140,000 | |
Balance at January 31, 2006 | | 9,176,000 | | $ | 14,624,000 | | $ | 19,744,000 | | | $ | 10,000 | | | $ | 34,378,000 | |
Correction of deferred tax error from prior years | | — | | — | | (354,000 | ) | | — | | | (354,000 | ) |
Net income | | — | | — | | 1,581,000 | | | — | | | 1,581,000 | |
Foreign currency translation | | — | | — | | — | | | (65,000 | ) | | (65,000 | ) |
Comprehensive income | | | | | | | | | | | | 1,516,000 | |
Stock options exercised | | 281,000 | | 839,000 | | — | | | — | | | 839,000 | |
Stock retired for option exercise | | (31,000 | ) | (206,000 | ) | — | | | — | | | (206,000 | ) |
Issuance of restricted stock | | — | | 32,000 | | — | | | — | | | 32,000 | |
Share-based compensation | | — | | 537,000 | | — | | | — | | | 537,000 | |
Tax benefit from stock options exercise | | — | | 282,000 | | — | | | — | | | 282,000 | |
Stock repurchase | | (792,000 | ) | (3,893,000 | ) | — | | | — | | | (3,893,000 | ) |
Stock issued for acquisition of B&B Technologies | | 83,000 | | 648,000 | | — | | | — | | | 648,000 | |
Balance at January 31, 2007 | | 8,717,000 | | $ | 12,863,000 | | $ | 20,971,000 | | | $ | (55,000 | ) | | $ | 33,779,000 | |
See accompanying notes.
35
NATIONAL TECHNICAL SYSTEMS, INC. AND SUBSIDIARIES
Consolidated Statements of Cash Flows
Years Ended January 31,
| | 2007 | | 2006 | | 2005 | |
CASH FLOWS FROM OPERATING ACTIVITIES: | | | | | | | |
Net income | | $ | 1,581,000 | | $ | 2,939,000 | | $ | 1,682,000 | |
Adjustments to reconcile net income to net cash provided by operating activities: | | | | | | | |
Depreciation and amortization | | 5,822,000 | | 5,283,000 | | 4,798,000 | |
Recoveries on receivables | | (125,000 | ) | (90,000 | ) | (32,000 | ) |
Gain on sale of assets | | — | | (163,000 | ) | (158,000 | ) |
Loss on retirement of assets | | 24,000 | | — | | 16,000 | |
Undistributed earnings of affiliate | | 87,000 | | 50,000 | | — | |
Deferred income taxes (net of acquisition) | | (329,000 | ) | (300,000 | ) | 352,000 | |
Tax benefit from stock options exercises | | 282,000 | | 56,000 | | 74,000 | |
Share-based compensation | | 569,000 | | — | | 50,000 | |
Changes in operating assets and liabilities (net of acquisitions): | | | | | | | |
Accounts receivable | | (1,102,000 | ) | (1,677,000 | ) | 235,000 | |
Inventories | | (673,000 | ) | (572,000 | ) | 383,000 | |
Prepaid expenses | | (157,000 | ) | (103,000 | ) | 161,000 | |
Other assets | | (244,000 | ) | (166,000 | ) | (265,000 | ) |
Accounts payable | | 896,000 | | 1,104,000 | | (973,000 | ) |
Accrued expenses | | (229,000 | ) | 1,612,000 | | 241,000 | |
Income taxes payable | | (193,000 | ) | 594,000 | | (23,000 | ) |
Deferred revenue | | (38,000 | ) | 393,000 | | 239,000 | |
Deferred compensation | | 72,000 | | 64,000 | | 11,000 | |
Income taxes receivable | | 10,000 | | 511,000 | | (201,000 | ) |
Net cash provided by operating activities | | 6,253,000 | | 9,535,000 | | 6,590,000 | |
CASH FLOWS FROM INVESTING ACTIVITIES: | | | | | | | |
Purchase of property, plant and equipment | | (6,028,000 | ) | (7,287,000 | ) | (5,189,000 | ) |
Sale of property, plant and equipment | | — | | 543,000 | | 311,000 | |
Investment in life insurance | | (197,000 | ) | (181,000 | ) | (178,000 | ) |
Acquisitions of businesses, net of cash | | (3,055,000 | ) | (483,000 | ) | (1,033,000 | ) |
Net cash used for investing activities | | (9,280,000 | ) | (7,408,000 | ) | (6,089,000 | ) |
CASH FLOWS FROM FINANCING ACTIVITIES: | | | | | | | |
Proceeds from current and long-term debt | | 15,326,000 | | 2,651,000 | | 2,228,000 | |
Repayments of current and long-term debt | | (9,949,000 | ) | (7,075,000 | ) | (1,502,000 | ) |
Proceeds from stock options exercised | | 633,000 | | 244,000 | | 300,000 | |
Common stock repurchase | | (3,893,000 | ) | — | | — | |
Net cash provided by (used for) financing activities | | 2,117,000 | | (4,180,000 | ) | 1,026,000 | |
Effect of exchange rate changes on cash and cash equivalents | | (65,000 | ) | 48,000 | | 13,000 | |
Net (decrease) increase in cash | | (975,000 | ) | (2,005,000 | ) | 1,540,000 | |
Beginning cash balance | | 4,196,000 | | 6,201,000 | | 4,661,000 | |
ENDING CASH BALANCE | | $ | 3,221,000 | | $ | 4,196,000 | | $ | 6,201,000 | |
SUPPLEMENTAL DISCLOSURE OF CASH FLOW INFORMATION | | | | | | | |
Cash payments during the year for: | | | | | | | |
Interest | | $ | 1,837,000 | | $ | 1,333,000 | | $ | 1,078,000 | |
Income taxes | | 1,487,000 | | 1,089,000 | | 667,000 | |
See accompanying notes
36
NATIONAL TECHNICAL SYSTEMS, INC. AND SUBSIDIARIES
Notes to Consolidated Financial Statements
January 31, 2007, 2006 and 2005
(1) Summary of Significant Accounting Policies
Principles of Consolidation
The consolidated financial statements include the accounts of National Technical Systems, Inc. (“NTS” or the “Company”) and its subsidiaries. All significant intercompany balances and transactions have been eliminated in consolidation.
The Company has consolidated NQA, Inc., a 50% owned subsidiary for which the distribution of profits and losses is 50.1% to the Company, and 49.9% to the other shareholder. NTS controls the management decisions and elects the president of NQA, Inc. and therefore has operating control of the subsidiary.
XXCAL Japan is a 50% owned subsidiary which started in fiscal 1999 and is accounted for under the equity method since NTS does not have operating control. XXCAL Japan’s financial statements are prepared in accordance with generally accepted accounting principles in Japan. There are no material adjustments that need to be made to XXCAL Japan’s financial statements for them to be in conformity with U.S. generally accepted accounting principles. The equity investment recorded in the accompanying balance sheets is $1,220,000 and $1,019,000 at January 31, 2007 and 2006, respectively. The Company’s equity earnings recorded in the accompanying income statements totaled $201,000, $259,000 and $483,000 for the years ended January 31, 2007, 2006 and 2005 respectively.
Risks and Uncertainties
The preparation of financial statements in conformity with U.S. generally accepted accounting principles requires management to make estimates and assumptions that affect the amounts reported in the financial statements and accompanying notes. Estimates made by the Company relate primarily to the recognition of revenue under long-term contracts and valuation of contract claims. Actual results could differ from those estimates.
The Company performs ongoing credit evaluations of its customers’ financial condition and generally requires no collateral.
Revenue Recognition
Revenues are derived from development, qualification and production testing and engineering services for commercial products, space systems and military equipment of all types. The Company also provides technical staffing, qualification of safety related systems and components, and ISO 9000 certification services.
Revenue from fixed price testing contracts is generally recorded upon completion of the contracts, which are generally short-term, or upon completion of identifiable contractual tasks. At the time the Company enters into a contract that includes multiple tasks, the Company estimates the amount of actual labor and other costs that will be required to complete each task based on historical experience. Revenues are recognized which provide for a profit margin relative to the testing performed. Revenue relative to each task and from contracts which are time and materials based is recorded as effort is expended. Billings in excess of amounts earned are deferred. Any anticipated losses on contracts are charged to income when identified. To the extent management does not accurately forecast the level of effort required to complete
37
NATIONAL TECHNICAL SYSTEMS, INC. AND SUBSIDIARIES
Notes to Consolidated Financial Statements (Continued)
January 31, 2007, 2006 and 2005
(1) Summary of Significant Accounting Policies (Continued)
a contract, or individual tasks within a contract, and the Company is unable to negotiate additional billings with a customer for cost over-runs, the Company may incur losses on individual contracts. All selling, general and administrative costs are treated as period costs and expensed as incurred.
Reimbursements made to the Company by customers under contract provisions, including those related to travel and other out-of-pocket expenses are recorded as revenues. An equivalent amount of reimbursable expenses is recorded as cost of sales.
Inventories
Inventories consist of accumulated costs including direct labor, material and overhead applicable to uncompleted contracts and are stated at actual cost, which is not in excess of estimated net realizable value.
Property Held for Sale
In fiscal year 2005, the Company sold the old Palm Desert, California condominium and purchased a new condominium, which is also located in Palm Desert. The Company recorded a gain of approximately $158,000 from the sale of the old condominium. In fiscal year 2006, the Company sold the new Palm Desert, California condominium and recorded a gain of approximately $163,000. The Company has listed approximately 120 acres of its Santa Clarita, California land for sale, but because it does not meet all the criteria for accounting classification as an “asset held for sale”, it was not classified as such in the accompanying consolidated financial statements.
Property, Plant and Equipment
Property, plant, and equipment is stated at actual cost and is depreciated and amortized using the straight-line method over the following estimated useful lives:
Buildings | | 30 to 35 years |
Machinery and equipment | | 3 to 20 years |
Leasehold improvements | | Terms of lease, or estimated useful life (whichever is less) |
38
NATIONAL TECHNICAL SYSTEMS, INC. AND SUBSIDIARIES
Notes to Consolidated Financial Statements (Continued)
January 31, 2007, 2006 and 2005
(1) Summary of Significant Accounting Policies (Continued)
Intangible Assets
The Company accounts for goodwill and other intangible assets in accordance with Statement of Financial Accounting Standards (“SFAS”) No. 141 “Business Combinations” and SFAS No. 142 “Goodwill and Other Intangible Assets.”
| | January 31, 2007 | | January 31, 2006 | |
| | Gross
Carrying
Amount | | Accum.
Amort. | | Net
Carrying
Amount | | Estimated
Useful
Life | | Gross
Carrying
Amount | | Accum.
Amort. | | Net
Carrying
Amount | | Estimated
Useful
Life | |
Intangible assets subject to amortization: | | | | | | | | | | | | | | | | | | | | | | | | | |
Covenants not to compete | | | $ | 299,000 | | | $ | 135,000 | | $ | 164,000 | | | 3-5 years | | | | $ | 148,000 | | | $ | 110,000 | | $ | 38,000 | | | 3-5 years | | |
Customer relationships | | | 105,000 | | | 15,000 | | 90,000 | | | 3 years | | | | — | | | — | | — | | | | | |
Total | | | $ | 404,000 | | | $ | 150,000 | | $ | 254,000 | | | | | | | $ | 148,000 | | | $ | 110,000 | | $ | 38,000 | | | | | |
Intangible assets not subject to amortization: | | | | | | | | | | | | | | | | | | | | | | | | | |
Goodwill | | | | | | | | $ | 4,126,000 | | | | | | | | | | | | $ | 2,740,000 | | | | | |
Amortization expense for intangible assets subject to amortization was $40,000 and $32,000 for the twelve months ended January 31, 2007 and 2006, respectively.
Under SFAS No. 142, goodwill and intangible assets that have indefinite useful lives are not amortized but are tested at least annually for impairment. The goodwill test for impairment consists of a two-step process that begins with an estimation of the fair value of the reporting unit. The first step of the test is a screen for potential impairment and the second step measures the amount of impairment, if any. The first step of the goodwill impairment test includes a comparison of the fair value of each reporting unit that has associated goodwill with the carrying value of the reporting unit. The Company has identified five reporting units in the Engineering and Evaluation segment and one reporting unit in the Technical Solutions segment, which constitute components of its business that include goodwill. The Company completed its annual goodwill impairment test and has determined that the fair value of each of the reporting units exceeded the reporting unit’s carrying amount, and no impairment was indicated.
Long-lived Assets
In accordance with SFAS No. 144, “Accounting for the Impairment or Disposal of Long-Lived Assets”, the Company periodically evaluates the recoverability of the carrying amount of long-lived assets (including property, plant and equipment, and intangible assets with determinable lives) whenever events or changes in circumstances indicate that the carrying amount of an asset may not be fully recoverable. The Company evaluates events or changes in circumstances based on a number of factors including operating results, business plans and forecasts, general and industry trends and economic projections and anticipated cash flows. An impairment loss is recorded when the undiscounted expected future cash flows derived from an asset are less than its carrying amount. Impairment losses are measured as the amount by which the carrying value of an asset exceeds its fair value and are recognized in earnings.
39
NATIONAL TECHNICAL SYSTEMS, INC. AND SUBSIDIARIES
Notes to Consolidated Financial Statements (Continued)
January 31, 2007, 2006 and 2005
(1) Summary of Significant Accounting Policies (Continued)
Share-Based Compensation
Effective February 1, 2006, the Company adopted the provisions of SFAS No. 123(R). SFAS No. 123(R) requires employee stock options and rights to purchase shares under stock participation plans to be accounted for under the fair value method and requires the use of an option pricing model for estimating fair value. Accordingly, share-based compensation is measured at grant date, based on the fair value of the award. The Company previously accounted for awards granted under its equity incentive plans under the intrinsic value method prescribed by Accounting Principles Board (APB) Opinion No. 25, “Accounting for Stock Issued to Employees,” and related interpretations, and provided the required pro forma disclosures prescribed by SFAS No. 123, “Accounting for Stock-Based Compensation,” as amended. The exercise price of options is equal to the market price of National Technical Systems, Inc. common stock (defined as the closing price reported by the NASDAQ stock market) on the date of grant. Accordingly, no share-based compensation, other than acquisition-related compensation, was recognized in the financial statements prior to January 31, 2006.
The Company used the modified prospective method of adoption for SFAS No. 123(R), under which the compensation cost recognized by the Company beginning in fiscal 2007 includes (a) compensation cost for all equity incentive awards granted prior to, but not yet vested as of February 1, 2006, based on the grant date fair value estimated in accordance with the original provisions of SFAS No. 123, and (b) compensation cost for all equity incentive awards granted subsequent to February 1, 2006, based on the grant-date fair value estimated in accordance with the provisions of SFAS No. 123(R). The Company uses the straight-line attribution method to recognize share-based compensation costs over the service period of the award. Upon exercise, cancellation, or expiration of non qualified stock options, deferred tax assets for options with multiple vesting dates are eliminated for each vesting period on a first-in, first-out basis as if each vesting period was a separate award. To calculate the excess tax benefits available for use in offsetting future tax shortfalls as of the date of implementation, the Company followed the alternative transition method discussed in FASB Staff Position No. 123(R)-3.
No options have been granted by the Company during fiscal year 2007. Options to be granted to existing and newly hired employees or directors will generally vest over a four-year period from the date of grant. The Company may also assume the equity incentive plans and the outstanding equity awards of certain acquired companies. Once assumed, the Company does not grant additional stock under these plans. The Company may use other types of equity incentive awards, such as restricted stock. The Company’s equity incentive plan also allows for performance-based vesting for equity incentive awards.
Share-based compensation recognized in fiscal year 2007 as a result of the adoption of SFAS No. 123(R) as well as pro forma disclosures according to the original provisions of SFAS No. 123 for periods prior to the adoption of SFAS No. 123(R) is based on the Black-Scholes-Merton option pricing model for estimating fair value of options granted under the Company’s equity incentive plans and rights to acquire stock granted under the Company’s stock participation plan.
40
NATIONAL TECHNICAL SYSTEMS, INC. AND SUBSIDIARIES
Notes to Consolidated Financial Statements (Continued)
January 31, 2007, 2006 and 2005
(1) Summary of Significant Accounting Policies (Continued)
The following table summarizes the effects of share-based compensation resulting from the application of SFAS No. 123(R) for the year ended January 31, 2007:
| | Twelve Months Ended | |
| | January 31, 2007 | |
Cost of sales | | | $ | 135,000 | | |
Selling, general and administrative expense | | | 434,000 | | |
Share-based compensation effect on income before taxes | | | 569,000 | | |
Income taxes | | | (20,000 | ) | |
Net share-based compensation effects in net income | | | $ | 549,000 | | |
Share-based compensation effects on basic earnings per common share | | | $ | 0.06 | | |
Share-based compensation effects on diluted earnings per common share | | | $ | 0.06 | | |
Share-based compensation effects on cash flow from operations | | | $ | — | | |
Share-based compensation effects on cash flow from financing activities | | | $ | — | | |
Weighted average common shares outstanding | | | 8,705,000 | | |
Dilutive effect of stock options | | | 800,000 | | |
Weighted average common shares outstanding assuming dilution | | | 9,505,000 | | |
Stock-based compensation expense by type of award: | | | | | |
Stock options | | | 537,000 | | |
Non-vested shares | | | 32,000 | | |
| | | 569,000 | | |
In accordance with SFAS No. 123(R), the Company adjusts share-based compensation on a quarterly basis for changes to the estimate of expected equity award forfeitures based on actual forfeiture experience. The effect of adjusting the forfeiture rate for all expense amortization after February 1, 2006 is recognized in the period the forfeiture estimate is changed. The effect of forfeiture adjustments for fiscal year 2007 was immaterial.
Under the provisions of SFAS No. 123(R), $851,000 has been recorded as a credit to common stock. During fiscal year 2007, the tax benefit realized for the tax deduction from option exercises totaled $282,000. As of February 1, 2007, there was $359,000 of total unrecognized compensation costs related to stock options granted under the Company’s equity incentive plans. The unrecognized compensation cost is expected to be recognized over a weighted average period of three years.
41
NATIONAL TECHNICAL SYSTEMS, INC. AND SUBSIDIARIES
Notes to Consolidated Financial Statements (Continued)
January 31, 2007, 2006 and 2005
(1) Summary of Significant Accounting Policies (Continued)
The fair value of each option grant is estimated on the date of grant using the Black-Scholes-Merton option pricing model with the following assumptions:
| | 2007 | | 2006 | | 2005 | |
Expected life (in years) | | N/A | | 7.48 | | 7.68 | |
Risk-free interest rate | | N/A | | 4.47 | % | 3.71 | % |
Expected volatility | | N/A | | 70 | % | 76 | % |
Expected dividend yield | | N/A | | 0 | | 0 | |
There were no stock option grants in fiscal year 2007.
If the fair value based method under SFAS 123 had been applied in measuring stock-based compensation expense, the pro forma effect on net income and net income per share for the years ended January 31, 2006 and 2005 would have been as follows:
| | January 31, 2006 | | January 31, 2005 | |
Net income | | | | | | | | | |
As reported | | | $ | 2,939,000 | | | | $ | 1,682,000 | | |
Stock compensation expense, under SFAS 123, net of tax | | | (377,000 | ) | | | (527,000 | ) | |
Pro forma | | | $ | 2,562,000 | | | | $ | 1,155,000 | | |
Basic earnings per common share | | | | | | | | | |
As reported | | | $ | 0.32 | | | | $ | 0.19 | | |
Pro forma | | | $ | 0.28 | | | | $ | 0.13 | | |
Diluted earnings per common share | | | | | | | | | |
As reported | | | $ | 0.30 | | | | $ | 0.18 | | |
Pro forma | | | $ | 0.27 | | | | $ | 0.12 | | |
Accounting for Income Taxes
Income taxes are accounted for under the liability method. Deferred income taxes are recognized for the future tax consequences attributable to temporary differences between the financial statement carrying amounts of existing assets and liabilities and their respective tax bases and operating loss and tax credit carry forwards. Deferred tax assets and liabilities are measured using enacted tax rates expected to apply to taxable income in the years in which those temporary differences are expected to be recovered or settled. The effect on deferred tax assets and liabilities of a change in tax rates is recognized in income in the period that includes the enactment date. A valuation allowance is recorded, if necessary, to reduce deferred tax assets to an amount management believes is more likely than not to be realized.
Comprehensive Income
In accordance with SFAS No. 130, “Reporting Comprehensive Income”, the Company is required to report and display the components of comprehensive income including unrealized gains or losses on
42
NATIONAL TECHNICAL SYSTEMS, INC. AND SUBSIDIARIES
Notes to Consolidated Financial Statements (Continued)
January 31, 2007, 2006 and 2005
(1) Summary of Significant Accounting Policies (Continued)
foreign currency translation adjustments. The effect of the foreign currency translation was $65,000 loss, $48,000 gain, and $13,000 gain for fiscal years 2007, 2006 and 2005, respectively. Accumulated other comprehensive loss was $55,000 and accumulated other comprehensive income was $10,000 as of January 31, 2007 and 2006, respectively, due to foreign currency translation adjustments.
Earnings Per Share
Basic and diluted net income per common share is presented in conformity with SFAS No. 128, “Earnings Per Share” for all periods presented. In accordance with SFAS No. 128, basic earnings per share has been computed using the weighted average number of shares of common stock outstanding during the year. Basic earnings per share excludes any dilutive effects of options, warrants and convertible securities and non-vested restricted shares. Diluted earnings per share excludes any non-vested restricted shares with an anti-dilutive effect.
Foreign Currency Translation
The accounts of the foreign divisions are translated into United States dollars in accordance with SFAS No. 52, “Foreign Currency Translation”. All balance sheet accounts, except for certain fixed assets accounts, have been translated using the current rate of exchange at the balance sheet date. Results of operations have been translated using the average rates prevailing throughout the year. Translation gains or losses resulting from the changes in the exchange rates from year-to-year are accumulated in a separate component of shareholders’ equity. The translation of the balance sheet accounts resulted in $65,000 in unrealized loss, $48,000 in unrealized gain and $13,000 in unrealized gain in fiscal years 2007, 2006 and 2005, respectively.
Related Party Transactions
NTS provides management and consulting services to NQA, Inc. for an agreed upon management fee. Such services include, but are not limited to, advice and assistance concerning any and all aspects of the operations of the Company. Management fees earned by the Company for fiscal 2007, 2006 and 2005 were $475,000, $376,000 and $214,000, respectively.
NQA, Ltd., the minority shareholder of NQA, Inc., provides certification oversight and advice and processes and issues ISO registration certificates. NQA, Ltd. charges NQA, Inc. an agreed upon fee for each certificate in place at the beginning of the year and issued during the year together with the appropriate United Kingdom Accreditation Service (“UKAS”) and Raad voor Accreditatie (“RVA”) levy. Certification fees for fiscal 2007, 2006 and 2005 were $475,000, $376,000 and $214,000, respectively.
NQA, Inc. leases space from NTS and was assessed $71,000 for rent and utilities in fiscal years 2007, 2006 and 2005.
Reclassifications
Certain amounts in the prior year financial statements have been reclassified to conform to the current year financial statement presentation.
43
NATIONAL TECHNICAL SYSTEMS, INC. AND SUBSIDIARIES
Notes to Consolidated Financial Statements (Continued)
January 31, 2007, 2006 and 2005
(1) Summary of Significant Accounting Policies (Continued)
Recently Issued Accounting Standards
In May 2005, the FASB issued SFAS No. 154, “Accounting Changes and Error Corrections.” SFAS No. 154 replaces APB Opinion No. 20, “Accounting Changes,” and SFAS No. 3, “Reporting Accounting Changes in Interim Financial Statements,” and is effective for fiscal years beginning after December 15, 2005, i.e. fiscal year ending January 31, 2007. SFAS No. 154 requires retrospective application to prior periods’ financial statements of changes in accounting principle, unless it is impracticable to determine either the period-specific effects or the cumulative effect of the change. The adoption of SFAS No. 154 did not have a material impact on the Company’s condensed consolidated financial statements.
In June 2006, the Financial Accounting Standards Board issued Interpretation No. 48, “Accounting for Uncertainty in Income Taxes”, an interpretation of FAS109, Accounting for Income Taxes (FIN 48), to create a single model to address accounting for uncertainty in tax positions. FIN 48 clarifies the accounting for income taxes, by prescribing a minimum recognition threshold a tax position is required to meet before being recognized in the financial statements. FIN 48 also provides guidance on derecognition, measurement, classification, interest and penalties, accounting in interim periods, disclosure and transition. FIN 48 is effective for fiscal years beginning after December 15, 2006. The Company will adopt FIN 48 effective February 1, 2007, as required. The cumulative effect of adopting FIN 48, if any, will be recorded in retained earnings and other accounts as applicable. The Company does not expect that the adoption of FIN 48 will have a material impact on the Company’s financial position, cash flows, or results of operations.
In September 2006, the FASB issued SFAS No. 157, “Fair Value Measurements” (“SFAS 157”), which clarifies the definition of fair value, establishes guidelines for measuring fair value, and expands disclosures regarding fair value measurements. SFAS 157 does not require any new fair value measurements and eliminates inconsistencies in guidance found in various prior accounting pronouncements. SFAS 157 will be effective for the Company on February 1, 2008. The Company is evaluating the impact of adopting SFAS 157 on its financial position, cash flows, and results of operations.
In September 2006, the Securities and Exchange Commission (“SEC”) released Staff Accounting Bulletin No. 108, “Considering the Effects of Prior Year Misstatements when Quantifying Misstatements in Current Year Financial Statements” (“SAB 108”). SAB 108 provides interpretive guidance on the SEC’s views on how the effects of the carryover or reversal of prior year misstatements should be considered in quantifying a current year misstatement. The Company adopted the provisions of SAB 108 during the year ended January 31, 2007, and, as a result, corrected one prior period misstatement that related to an understatement of deferred tax liabilities for accumulated depreciation in the amount of $354,000. The misstatement was detected upon the implementation of a new property accounting system, and accumulated during years ended January 31, 1990 and prior. This correction was accounted for as a cumulative effect adjustment under the transition provisions of SAB 108, whereby the offsetting entry is recorded against beginning retained earnings in the year of adoption.
44
NATIONAL TECHNICAL SYSTEMS, INC. AND SUBSIDIARIES
Notes to Consolidated Financial Statements (Continued)
January 31, 2007, 2006 and 2005
(2) Business Acquisitions
Acquisition of Dynamic Labs
On August 1, 2006, the Company acquired the assets and the existing business of Dynamic Labs, an Electromagnetic Interference (EMI) and environmental testing laboratory with locations in Phoenix, Arizona and Austin, Texas for a total purchase price of $2,254,000, paid in cash. The Phoenix laboratory provided EMI, environmental and dynamics testing for the aerospace and defense industries. The Austin facility also provided aerospace, environmental, and dynamic testing. The majority of the machinery and equipment at the Phoenix facility was relocated to the NTS Tempe, Arizona laboratory with the rest of the equipment distributed to other NTS facilities. All of the machinery and equipment at the Austin facility were relocated to other NTS facilities. The results of operations for Dynamic Labs are included in the Company’s consolidated statement of income from August 1, 2006 to January 31, 2007.
The preliminary allocation of the purchase price of Dynamic Labs is as follows:
Purchase price: | | | | | |
Property, plant and equipment | | $ | 2,004,000 | |
Goodwill | | 100,000 | |
Covenant not to compete | | 150,000 | |
Purchase price | | $ | 2,254,000 | |
Acquisition of B&B Technologies, Inc.
On June 9, 2006, NTS Technical Systems, a wholly owned subsidiary of NTS, acquired the assets and the existing business of B & B Technologies, Inc. (“BBT”), a systems integration firm headquartered in Albuquerque, New Mexico, for a total purchase price of $1,065,000, payable in cash and 83,243 shares of NTS common stock, valued using the closing price of the Company’s stock. BBT designs and integrates test, measurement, automation, data acquisition and control systems utilizing diverse hardware platforms, operating systems, and instrumentation standards. The results of operations of the acquired business are included in the accompanying consolidated statement of income from June 9, 2006 to January 31, 2007.
The preliminary allocation of the purchase price of BBT is as follows:
Purchase price: | | | | | |
Cash | | $ | 3,000 | |
Accounts receivable | | 248,000 | |
Inventory | | 35,000 | |
Property, plant and equipment | | 108,000 | |
Prepaid expenses | | 33,000 | |
Goodwill | | 1,004,000 | |
Accounts payable | | (232,000 | ) |
Other assumed liabilities | | (134,000 | ) |
Purchase price | | $ | 1,065,000 | |
45
NATIONAL TECHNICAL SYSTEMS, INC. AND SUBSIDIARIES
Notes to Consolidated Financial Statements (Continued)
January 31, 2007, 2006 and 2005
(2) Business Acquisitions (Continued)
Other purchase price information: | | | | | |
Purchase price | | $ | 1,065,000 | |
Common stock issued | | (648,000 | ) |
Cash acquired | | (3,000 | ) |
Cash paid | | (414,000 | ) |
| | | | | | |
Acquisition of American International Registrars
On April 12, 2006, NQA, USA, a 50% owned consolidated subsidiary of NTS, acquired the existing business of American International Registrars Corporation (“AIR”), located in Ventura, California, for a total purchase price of $386,000, payable in cash. All existing AIR customers and associated certifications and backlog were transferred to NQA, USA. The purchase was recorded as $105,000 to customer relationships and $281,000 to goodwill. The results of operations for American International Registrars are included in the Company’s consolidated statement of income from April 12, 2006 to January 31, 2007.
(3) Debt
Long-term debt consists of the following:
| | 2007 | | 2006 | |
Revolving lines of credit (a) | | $ | 8,843,000 | | $ | 8,500,000 | |
Notes payable secured by land and buildings (b) | | 2,415,000 | | 2,602,000 | |
Secured notes payable (c) | | 11,265,000 | | 6,006,000 | |
Subtotal | | 22,523,000 | | 17,108,000 | |
Less current installments | | 3,285,000 | | 1,529,000 | |
Total | | $ | 19,238,000 | | $ | 15,579,000 | |
(a) The Company has a $16,500,000 revolving line of credit under its credit agreement with Comerica Bank California and First Bank. Comerica Bank California, as the agent, holds 60% of the line with First Bank, as the participant, holding 40% of the line. The interest rate is at the agent’s prime rate, with an option for the Company to convert to loans at the Libor rate plus 250 basis points for 30, 60, 90, 180 or 365 days, with minimum advances of $1,000,000. The outstanding balance on the revolvingline of credit at January 31, 2007 was $8,843,000. This balance is reflected in the accompanying condensed consolidated balance sheets as long-term. The amount available on the line of credit was $7,657,000 as of January 31, 2007. This agreement is subject to certain covenants, which require the maintenance of certain working capital, debt-to-equity, earnings-to-expense and cash flow ratios. The Company requested and received waivers for two covenants from its banks to remain compliant with the bank covenants as of January 31, 2007.
(b) The amount of $2,415,000 represents mortgage notes on land and buildings owned by the Company in California and Massachusetts. The notes carry fixed interest rates ranging from 5.5% to 9.0% and they are collateralized by those properties.
(c) On July 1, 2005, the Company amended its credit agreement to include a $2,500,000 term loan to be repaid in 60 equal monthly payments. The proceeds were used to pay down the line of credit. The
46
NATIONAL TECHNICAL SYSTEMS, INC. AND SUBSIDIARIES
Notes to Consolidated Financial Statements (Continued)
January 31, 2007, 2006 and 2005
(3) Debt (Continued)
amendment also included an additional equipment line of credit for $2,000,000. On March 29, 2006, the Company increased the term loan by an additional $3,900,000 to fund the repurchase of 792,266 shares of common stock from a former executive officer and director. On September 21, 2006, the agreement was amended again to include an additional equipment line of credit of $2,000,000 and an additional $2,000,000 in term loan, to be repaid in 48 equal monthly payments, to fund the purchase of Dynamic Labs. The aggregate outstanding balance on the term loans at January 31, 2007 was $6,587,000. The aggregate outstanding balance on the equipment line of credit at January 31, 2007 was $3,441,000. The Company has additional equipment line of credit agreements (at interest rates of 5.56% to 7.47%) to finance various test equipment with terms of 60 months for each equipment schedule. The outstanding balance at January 31, 2007 was $1,237,000.
Maturities of long-term debt for five years subsequent to January 31, 2007 are as follows:
2008 | | $ | 3,285,000 | |
2009 | | 12,446,000 | |
2010 | | 3,443,000 | |
2011 | | 1,512,000 | |
2012 | | 445,000 | |
Thereafter | | 1,392,000 | |
| | $ | 22,523,000 | |
In accordance with the requirements of SFAS No. 107, “Disclosure about Fair Value of Financial Instruments”, a reasonable estimate of fair value for the Company’s fixed rate debt was based on a discounted cash flow analysis. The carrying amount of variable rate debt, including borrowings under the Company’s revolving lines of credit, approximate their fair values.
The carrying amounts and estimated fair values of the Company’s financial instruments are:
| | 2007
Carrying
amount | | 2007
Estimated
fair value | | 2006
Carrying
amount | | 2006
Estimated
fair value | |
Notes payable | | $ | 2,415,000 | | $ | 2,451,000 | | $ | 2,602,000 | | $ | 2,730,000 | |
Secured notes payable | | 11,265,000 | | 8,359,000 | | 6,006,000 | | 5,300,000 | |
Revolving lines of credit | | 8,843,000 | | 8,843,000 | | 8,500,000 | | 8,500,000 | |
| | | | | | | | | | | | | |
47
NATIONAL TECHNICAL SYSTEMS, INC. AND SUBSIDIARIES
Notes to Consolidated Financial Statements (Continued)
January 31, 2007, 2006 and 2005
(4) Income Taxes
Pre-tax profit generated from foreign operations was $658,000, $259,000 and $522,000 in fiscal 2007, 2006 and 2005, respectively. The earnings associated with the Company’s foreign subsidiary in Japan are considered to be permanently re-invested and are reported net of tax and are included in operating income. Accumulated foreign earnings were $1,220,000 as of January 31, 2007.
The provision (benefit) for income taxes from continuing operations consists of:
| | 2007 | | 2006 | | 2005 | |
Current: | | | | | | | |
Federal | | $ | 1,244,000 | | $ | 1,911,000 | | $ | 358,000 | |
State | | 264,000 | | 379,000 | | 137,000 | |
Foreign | | 120,000 | | (2,000 | ) | 14,000 | |
| | 1,628,000 | | 2,288,000 | | 509,000 | |
Deferred: | | | | | | | |
Federal | | (292,000 | ) | (323,000 | ) | 187,000 | |
State | | (27,000 | ) | 1,000 | | 214,000 | |
| | (319,000 | ) | (322,000 | ) | 401,000 | |
Income tax expense | | $ | 1,309,000 | | $ | 1,966,000 | | $ | 910,000 | |
The following is a reconciliation of the difference between the actual provision for income taxes and the provision computed by applying the federal statutory tax rate on income from continuing operations before income taxes:
| | 2007 | | 2006 | | 2005 | |
Income before income taxes and minority interest | | $ | 2,978,000 | | $ | 4,955,000 | | $ | 2,592,000 | |
Federal income tax computed at statutory rate | | $ | 1,010,000 | | $ | 1,685,000 | | $ | 881,000 | |
State income taxes, net of federal benefits | | 153,000 | | 252,000 | | 89,000 | |
Equity income net of tax in a non consolidated subsidiary | | (224,000 | ) | (104,000 | ) | (164,000 | ) |
Foreign tax | | 120,000 | | (2,000 | ) | 14,000 | |
Other, principally non-deductible expenses | | 250,000 | | 135,000 | | 90,000 | |
Income tax expense | | $ | 1,309,000 | | $ | 1,966,000 | | $ | 910,000 | |
48
NATIONAL TECHNICAL SYSTEMS, INC. AND SUBSIDIARIES
Notes to Consolidated Financial Statements (Continued)
January 31, 2007, 2006 and 2005
(4) Income Taxes (Continued)
Deferred income taxes on the consolidated balance sheets reflect the net tax effects of temporary differences between the carrying amounts of assets and liabilities for financial reporting purposes and the amounts used for income tax purposes. Net operating loss of $524,000 and $262,000 for federal and state, respectively, relate to the purchase of Phase Seven Laboratories, Inc. in March 2005. Of this amount $262,000 relating to the state net operating losses will expire in 2015 and $524,000 will expire in 2025. The primary components of the Company’s deferred tax assets and liabilities at January 31 were as follows:
| | 2007 | | 2006 | |
| | Current | | Non-current | | Current | | Non-current | |
Deferred tax assets: | | | | | | | | | |
Allowance for doubtful accounts | | $ | 240,000 | | $ | — | | $ | 340,000 | | $ | — | |
Vacation accrual | | 567,000 | | — | | 476,000 | | — | |
State taxes | | 264,000 | | — | | 314,000 | | — | |
Deferred compensation | | 407,000 | | — | | 402,000 | | — | |
Net operating loss | | 199,000 | | — | | 215,000 | | — | |
Other | | 13,000 | | — | | — | | — | |
Total deferred tax assets | | 1,690,000 | | — | | 1,747,000 | | — | |
Deferred tax liabilities: | | | | | | | | | |
Goodwill | | — | | (280,000 | ) | — | | (195,000 | ) |
Installment gain deferral | | — | | (13,000 | ) | — | | (24,000 | ) |
Tax over book depreciation | | — | | (4,759,000 | ) | — | | (4,865,000 | ) |
Total deferred tax liabilties | | — | | (5,052,000 | ) | — | | (5,084,000 | ) |
Net deferred tax asset (liability) | | $ | 1,690,000 | | $ | (5,052,000 | ) | $ | 1,747,000 | | $ | (5,084,000 | ) |
(5) Stock Options, Equity Incentive and Pension Plans
The Company has two employee incentive stock option plans; the “2002 stock option plan” and the “1994 stock option plan.”
Under both stock option plans, officers, key employees, non-employee directors and consultants may be granted options to purchase shares of the Company’s authorized but unissued common stock. At the annual meeting held on June 28, 2002, the 2002 stock option plan was approved. The number of shares approved for issuance under the 2002 stock option plan was 1,000,000 shares. During fiscal 2007 there were no shares granted under the 2002 stock option plan. At January 31, 2007 there were 1,070,517 shares authorized and granted under the 1994 stock option plan and there were no shares reserved for future grants.
49
NATIONAL TECHNICAL SYSTEMS, INC. AND SUBSIDIARIES
Notes to Consolidated Financial Statements (Continued)
January 31, 2007, 2006 and 2005
(5) Stock Options, Equity Incentive and Pension Plans (Continued)
Outstanding options under all plans are exercisable at 100% or more of fair market (as determined by the compensation committee of the Board of Directors) at the date of grant. The options are contingent upon continued employment and are exercisable, unless otherwise specified, on a cumulative basis of one-fourth of the total shares each year, commencing one year from the date of grant. Options currently expire five to ten years from the date of grant. Proceeds received by the Company from the exercises are credited to common stock. A summary of option activity under the Plan as of January 31, 2007, and changes during the year then ended is presented below:
| | Shares | | Weighted Avg.
Exercise Price | | Weighted Avg.
Remaining Contract
Life in years | | Aggregate
Intrinsic Value | |
Outstanding at February 1, 2006 | | 2,167,445 | | | $ | 3.78 | | | | | | | | | | |
Granted | | — | | | — | | | | | | | | | | |
Exercised | | (280,028 | ) | | 3.00 | | | | | | | | | | |
Canceled or expired | | (25,575 | ) | | 3.68 | | | | | | | | | | |
Outstanding at January 31, 2007 | | 1,861,842 | | | $ | 3.90 | | | | 4.74 | | | | $ | 3,960,000 | | |
Exercisable at January 31, 2007 | | 1,556,479 | | | $ | 3.75 | | | | 4.14 | | | | $ | 3,571,000 | | |
The aggregate intrinsic value in the table above represents the total pre-tax intrinsic value (the aggregate difference between the closing stock price of the Company’s common stock on January 31, 2007 and the exercise price for in-the-money options) that would have been received by the option holders if all in-the-money options had been exercised on January 31, 2007.
The total intrinsic value of options exercised during the years ended January 31, 2007, 2006 and 2005, was $1,051,000, $346,000 and $421,000, respectively.
The range of exercise prices for options outstanding at January 31, 2007 was $1.35 to $7.00. The range of exercise prices for options is wide due primarily to the fluctuating price of the Company’s stock over the period of the grants.
50
NATIONAL TECHNICAL SYSTEMS, INC. AND SUBSIDIARIES
Notes to Consolidated Financial Statements (Continued)
January 31, 2007, 2006 and 2005
(5) Stock Options, Equity Incentive and Pension Plans (Continued)
The following tables summarize information about options outstanding at January 31, 2007.
Range of
exercise prices | | Outstanding at
January 31,
2007 | | Weighted Avg.
Remaining
contract life
in yrs. | | Weighted Avg.
Exercise
Price | | Number
Exercisable | | Weighted Avg.
Exercisable
Price | |
$1.00 to $2.00 | | | 123,250 | | | | 4.8 | | | | $ | 1.61 | | | 123,250 | | | $ | 1.61 | | |
$2.01 to $3.00 | | | 507,338 | | | | 4.3 | | | | $ | 2.58 | | | 507,338 | | | $ | 2.58 | | |
$3.01 to $4.00 | | | 199,706 | | | | 3.0 | | | | $ | 3.31 | | | 199,206 | | | $ | 3.31 | | |
$4.01 to $5.00 | | | 652,825 | | | | 6.8 | | | | $ | 4.61 | | | 377,462 | | | $ | 4.61 | | |
$5.01 to $6.00 | | | 344,306 | | | | 2.6 | | | | $ | 5.42 | | | 314,806 | | | $ | 5.44 | | |
$6.01 to $7.00 | | | 34,417 | | | | 1.6 | | | | $ | 6.36 | | | 34,417 | | | $ | 6.36 | | |
| | | 1,861,842 | | | | | | | | | | | 1,556,479 | | | | | |
These options will expire if not exercised at specific dates ranging from September 2007 to December 2015. During the year ended January 31, 2007, 280,028 options were exercised at prices from $1.35 to $5.50 per share.
The Company presented a new equity incentive plan for shareholder vote at its June 29, 2006 annual shareholders’ meeting and it was approved by the shareholders. This new 2006 equity incentive plan replaced the 2002 stock option plan, which was terminated early and no further options will be granted under it. Additionally, 143,050 shares that were reserved for future grants, were cancelled. Initially, a total of 300,000 new shares of common stock were reserved for issuance under the new 2006 equity incentive plan. As of January 31, 2007, 43,270 shares of the Company’s common stock had been issued under the 2006 Equity Incentive Plan (“EIP”) and 256,730 shares were reserved for future issuance under the plan. Shares are issued under the EIP as compensation to certain employee and non-employee directors of the Company.
The Company’s non-vested shares have a vesting period of four years. Compensation expense, representing the fair market value of the shares at the date of grant, net of assumptions regarding estimated future forfeitures, is charged to earnings over the vesting period. Compensation expense included in general and administrative expenses in the Company’s consolidated statement of income, relating to these grants was $32,000 for fiscal year 2007.
51
NATIONAL TECHNICAL SYSTEMS, INC. AND SUBSIDIARIES
Notes to Consolidated Financial Statements (Continued)
January 31, 2007, 2006 and 2005
(5) Stock Options, Equity Incentive and Pension Plans (Continued)
The following table summarizes the non-vested shares transactions for fiscal year 2007:
| | Number of
Shares | | Weighted-Average
Grant Date
FairValue | |
Non-vested shares: | | | | | | | | | |
Outstanding at February 1, 2006 | | | — | | | | — | | |
Granted | | | 43,270 | | | | $ | 7.08 | | |
Vested | | | — | | | | — | | |
Forfeited | | | — | | | | — | | |
Non-vested at January 31, 2007 | | | 43,270 | | | | $ | 7.08 | | |
As of January 31, 2007, there was $274,000 of total unrecognized compensation cost related to the non-vested share-based compensation arrangements granted under the plan. That cost is expected to be recognized over a weighted-average period of 43 months.
The Company offers three 401(k) profit sharing plans: National Technical Systems 401(k) Profit Sharing Plan, XXCAL 401(k) Profit Sharing Plan and NQA 401(k) Pension Plan. The purpose of these plans is to provide retirement benefits to all employees of the Company. The Company’s employees can contribute a portion of their salary into the 401(k) plan and the Company’s Board of Directors, at its discretion, will determine each year the amount of matching contribution the Company will make. Employer contributions are allocated based on participants’ own contribution percentage amount to the total amount contributed by all employees in each plan. In fiscal 2007, the Company contributed $261,000 to the 401(k) profit sharing plan as compared to $233,000 in 2006 and $239,000 in 2005.
The former president of XXCAL has elected to receive the cash surrender value of life insurance owned by the Company on his life, in lieu of lifetime periodic deferred compensation payments. The cash surrender value is included in other assets and the deferred compensation liability is included in deferred compensation.
The deferred compensation benefits are accrued and recognized over each employee’s expected term of employment. The Company’s total deferred compensation expenses were $81,000, $89,000 and $93,000 for the years ended January 31, 2007, 2006 and 2005, respectively. Included in other assets is $2,425,000 and $2,228,000 for the cash surrender values as of January 31, 2007 and 2006, respectively.
(6) Capital Stock
As of January 31, 2007 and 2006, the Company had 20,000,000 authorized common shares with no par value. At January 31, 2007 and January 31, 2006, 8,717,000 shares and 9,176,000 shares were issued and outstanding, respectively.
On March 28, 2006, the Company exercised an option to repurchase 792,266 shares of its common stock from a former executive officer and director of the Company. The total cash purchase price of $3,893,000, or $4.914 per share, represented the average closing price of the Company’s common stock for the five trading days prior to the option exercise date minus 10%, in accordance with an agreement between the Company and the executive officer and director entered into in September 2001. The shares
52
NATIONAL TECHNICAL SYSTEMS, INC. AND SUBSIDIARIES
Notes to Consolidated Financial Statements (Continued)
January 31, 2007, 2006 and 2005
(6) Capital Stock (Continued)
repurchased in this private transaction represented approximately 8.6% of the Company’s outstanding common stock on the date of exercise.
Holders of common stock vote on matters submitted to shareholders, including the election of directors. Except as required by law, the powers, preferences and rights of all common stock and the qualifications, limitations or restrictions thereof, shall in all respects be identical. The common stock shareholders will be entitled to receive, to the extent permitted by law, and to share equally and ratably, share for share, any such dividends as may be declared from time to time by the board of directors.
(7) Commitments
The Company leases certain of its operating facilities and equipment under operating leases which principally expire at various dates through fiscal year 2012. The leases are generally on a net-rent basis, whereby the Company pays taxes, maintenance, insurance and other operating expenses. Management expects that, in the normal course of business, leases that expire will be renewed or replaced by other leases. Total rental expense was $3,383,000, $3,038,000 and $2,346,000 for the years ended January 31, 2007, 2006 and 2005, respectively.
2008 | | $ | 2,456,000 | |
2009 | | 1,778,000 | |
2010 | | 1,450,000 | |
2011 | | 832,000 | |
2012 | | 144,000 | |
Thereafter | | — | |
| | $ | 6,660,000 | |
At January 31, 2007, minimum rental payment obligations under operating leases were as follows:
(8) Accrued Expenses
A summary of accrued expenses at January 31 is as follows:
| | 2007 | | 2006 | |
Compensation and employee benefits | | $ | 3,845,000 | | $ | 4,208,000 | |
Other | | 1,368,000 | | 1,192,000 | |
Total accrued expenses | | $ | 5,213,000 | | $ | 5,400,000 | |
(9) Contingencies
The Company is, from time to time, the subject of claims and suits arising out of matters occurring during the operation of the Company’s business. In the opinion of management, no claims or suits would materially affect the financial position or the results of the operations or cash flows of the Company.
53
NATIONAL TECHNICAL SYSTEMS, INC. AND SUBSIDIARIES
Notes to Consolidated Financial Statements (Continued)
January 31, 2007, 2006 and 2005
(10) Segment of Business Information
The Company maintains two core operating segments: Engineering & Evaluation and Technical Solutions.
The Engineering & Evaluation segment operates test laboratories in various states in the U.S., Canada and Germany and provides technical support and technical support personnel to assist customers in a broad range of industries (aerospace, defense, telecommunications, power products, transportation and computer, among others) in the solving of technical problems via analysis and testing of materials, components, subsystems and systems, electro-magnetic interference testing and product safety testing under its newly granted NRTL status by the United States’ Department of Labor, Occupational Safety and Health Administration. This segment also provides registration, certification and conformance evaluation services to its customers, particularly with regard to EU standards. In addition, it performs compatibility testing of hardware and software components. This segment also performs quality registration services by evaluating a supplier’s systems for conformity to ISO 9000, the international quality standard. The evaluations include an examination of the companies’ quality policy, quality system documentation and quality records.
The Technical Solutions segment locates, recruits, and hires a wide variety of technical personnel, engineers, drafters, designers, computer programmer technicians and others and assigns them to customers either on a temporary or permanent basis.
The Company’s reportable segments each represent strategic business units that offer different, yet related services. They are managed differently because each requires differing technical skills and sales strategies. Each segment is led by a chief operating decision maker, who, in coordination with the Company’s Chief Executive Officer uses the information reported below in evaluating results and allocating resources pertaining to segment operations.
The Company did not have any revenues from a single customer in the Engineering & Evaluation Group, which represented in excess of 10% of total segment revenues. Three major customers represented $8,765,000, $7,311,000 and $4,951,000 of fiscal 2007 Technical Solutions net revenues as compared to three major customers representing $8,041,000, $5,812,000 and $4,793,000 of fiscal 2006 Technical Solutions net revenues. Total revenues from customers in foreign operations were $6,564,000 in fiscal 2007, $2,624,000 in fiscal 2006 and $840,000 in fiscal 2005.
54
NATIONAL TECHNICAL SYSTEMS, INC. AND SUBSIDIARIES
Notes to Consolidated Financial Statements (Continued)
January 31, 2007, 2006 and 2005
(10) Segment of Business Information (Continued)
The following table illustrates each segment’s operating income for 2007, 2006 and 2005. Assets by segment are those assets that are used in the Company’s operations in each segment. Corporate assets consist of cash, accounts receivable, income taxes receivable, investments in securities, real estate and fixed assets not allocated to segments. Corporate general and administrative expenses were allocated on the basis of revenues, gross profit, net property, plant and equipment and payroll expenses of the respective segments. Interest expense is allocated to the segments based on average borrowing rates and segment advances.
| | Year Ended January 31, 2007 | |
| | Engineering &
Evaluation | | Technical
Solutions | | Corporate | | Total | |
Net revenues | | | $ | 80,030,000 | | | $ | 35,643,000 | | $ | — | | $ | 115,673,000 | |
Gross profit | | | 20,678,000 | | | 5,965,000 | | — | | 26,643,000 | |
Selling, general and administrative expense | | | 16,391,000 | | | 5,785,000 | | — | | 22,176,000 | |
Equity income from non-consolidated subsidiary | | | 201,000 | | | — | | — | | 201,000 | |
Operating income | | | 4,488,000 | | | 180,000 | | — | | 4,668,000 | |
Other income (expense): | | | | | | | | | | | |
Interest expense, net | | | (1,677,000 | ) | | (125,000 | ) | — | | (1,802,000 | ) |
Other income, net | | | 18,000 | | | 94,000 | | — | | 112,000 | |
Income before income taxes and minority interest | | | $ | 2,829,000 | | | $ | 149,000 | | $ | — | | $ | 2,978,000 | |
Assets | | | $ | 61,398,000 | | | $ | 8,279,000 | | $ | 5,162,000 | | $ | 74,839,000 | |
Equity investments | | | 1,220,000 | | | — | | — | | 1,220,000 | |
Expenditures for long-lived assets | | | 5,960,000 | | | 57,000 | | 11,000 | | 6,028,000 | |
Depreciation and amortization | | | 5,072,000 | | | 548,000 | | 202,000 | | 5,822,000 | |
Goodwill | | | 3,930,000 | | | 196,000 | | — | | 4,126,000 | |
55
NATIONAL TECHNICAL SYSTEMS, INC. AND SUBSIDIARIES
Notes to Consolidated Financial Statements (Continued)
January 31, 2007, 2006 and 2005
(10) Segment of Business Information (Continued)
| | Year Ended January 31, 2006 | |
| | Engineering &
Evaluation | | Technical
Solutions | | Corporate | | Total | |
Net revenues | | | $ | 72,411,000 | | | $ | 39,113,000 | | $ | — | | $ | 111,524,000 | |
Gross profit | | | 20,422,000 | | | 6,808,000 | | — | | 27,230,000 | |
Selling, general and administrative expense | | | 15,246,000 | | | 6,166,000 | | — | | 21,412,000 | |
Equity income from non-consolidated subsidiary | | | 259,000 | | | — | | — | | 259,000 | |
Operating income | | | 5,435,000 | | | 642,000 | | — | | 6,077,000 | |
Other income (expense): | | | | | | | | | | | |
Interest expense, net | | | (1,186,000 | ) | | (112,000 | ) | — | | (1,298,000 | ) |
Other income, net | | | 175,000 | | | 1,000 | | — | | 176,000 | |
Income before income taxes and minority interest | | | $ | 4,424,000 | | | $ | 531,000 | | $ | — | | $ | 4,955,000 | |
Assets | | | $ | 55,610,000 | | | $ | 9,116,000 | | $ | 4,407,000 | | $ | 69,133,000 | |
Equity investments | | | 1,019,000 | | | — | | — | | 1,019,000 | |
Expenditures for long-lived assets | | | 7,326,000 | | | 53,000 | | 112,000 | | 7,491,000 | |
Depreciation and amortization | | | 4,010,000 | | | 548,000 | | 725,000 | | 5,283,000 | |
Goodwill | | | 2,544,000 | | | 196,000 | | — | | 2,740,000 | |
| | Year Ended January 31, 2005 | |
| | Engineering &
Evaluation | | Technical
Solutions | | Corporate | | Total | |
Net revenues | | | $ | 62,753,000 | | | $ | 43,761,000 | | $ | — | | $ | 106,514,000 | |
Gross profit | | | 16,724,000 | | | 6,963,000 | | — | | 23,687,000 | |
Selling, general and administrative expense | | | 14,290,000 | | | 6,359,000 | | — | | 20,649,000 | |
Equity income from non-consolidated subsidiary | | | 483,000 | | | — | | — | | 483,000 | |
Operating income | | | 2,917,000 | | | 604,000 | | — | | 3,521,000 | |
Other income (expense): | | | | | | | | | | | |
Interest expense, net | | | (983,000 | ) | | (108,000 | ) | — | | (1,091,000 | ) |
Other income, net | | | 148,000 | | | 14,000 | | — | | 162,000 | |
Income before income taxes and minority interest | | | $ | 2,082,000 | | | $ | 510,000 | | $ | — | | $ | 2,592,000 | |
Assets | | | $ | 50,092,000 | | | $ | 10,356,000 | | $ | 6,221,000 | | $ | 66,669,000 | |
Equity investments | | | 760,000 | | | — | | — | | 760,000 | |
Expenditures for long-lived assets | | | 5,470,000 | | | 150,000 | | 534,000 | | 6,154,000 | |
Depreciation and amortization | | | 3,953,000 | | | 640,000 | | 205,000 | | 4,798,000 | |
Goodwill | | | 2,544,000 | | | 196,000 | | — | | 2,740,000 | |
56
NATIONAL TECHNICAL SYSTEMS, INC. AND SUBSIDIARIES
Notes to Consolidated Financial Statements (Continued)
January 31, 2007, 2006 and 2005
(11) Quarterly Financial Data (Unaudited)
| | Three months ended, | |
2007 | | | | Apr 30 | | Jul 31 | | Oct 31 | | Jan 31 | |
Net revenues | | $ | 28,151,000 | | $ | 28,438,000 | | $ | 29,809,000 | | $ | 29,275,000 | |
Gross profit | | 6,238,000 | | 6,579,000 | | 6,855,000 | | 6,971,000 | |
Net income | | 352,000 | | 247,000 | | 409,000 | | 573,000 | |
Earnings per common share | | | | | | | | | |
Basic* | | 0.04 | | 0.03 | | 0.05 | | 0.07 | |
Diluted | | 0.04 | | 0.03 | | 0.04 | | 0.06 | |
Weighted average common shares outstanding | | 8,892,000 | | 8,544,000 | | 8,676,000 | | 8,707,000 | |
Dilutive effect of stock options | | 683,000 | | 899,000 | | 819,000 | | 759,000 | |
Weighted average common shares outstanding, assuming dilution | | 9,575,000 | | 9,443,000 | | 9,495,000 | | 9,466,000 | |
| | | | | | | | | | | | | | | |
| | Three months ended, | |
2006 | | | | Apr 30 | | Jul 31 | | Oct 31 | | Jan 31 | |
Net revenues | | $ | 27,444,000 | | $ | 26,755,000 | | $ | 28,508,000 | | $ | 28,817,000 | |
Gross profit | | 6,598,000 | | 6,239,000 | | 6,824,000 | | 7,569,000 | |
Net income | | 734,000 | | 468,000 | | 590,000 | | 1,147,000 | |
Earnings per common share | | | | | | | | | |
Basic | | 0.08 | | 0.05 | | 0.06 | | 0.13 | |
Diluted* | | 0.08 | | 0.05 | | 0.06 | | 0.12 | |
Weighted average common shares outstanding | | 9,052,000 | | 9,106,000 | | 9,166,000 | | 9,175,000 | |
Dilutive effect of stock options | | 494,000 | | 541,000 | | 589,000 | | 524,000 | |
Weighted average common shares outstanding,assuming dilution | | 9,546,000 | | 9,647,000 | | 9,755,000 | | 9,699,000 | |
| | | | | | | | | | | | | | | |
* Per share data may not always add to the total for the year because each figure is independently calculated.
57
ITEM 9. CHANGES IN AND DISAGREEMENTS WITH ACCOUNTANTS ON ACCOUNTING AND FINANCIAL DISCLOSURES.
None.
ITEM 9A. CONTROLS AND PROCEDURES.
Evaluation of Disclosure Controls and Procedures
The Company’s Chief Executive Officer and Chief Financial Officer carried out an evaluation with the participation of the Company’s management, of the effectiveness of the design and operation of the Company’s disclosure controls and procedures (as defined in Rules 13a-15(e) and 15d-15(e) under the Securities Exchange Act of 1934, as amended (the “Exchange Act”)). Based upon that evaluation, the Chief Executive Officer and Chief Financial Officer concluded that, as of the end of the period covered by this report, the Company’s disclosure controls and procedures were effective.
Changes in Internal Controls Over Financial Reporting
As required by Rule 13a-15(d), the Company’s Chief Executive Officer and Chief Financial Officer, with the participation of the Company’s management, also conducted an evaluation of the Company’s internal controls over financial reporting to determine whether any changes occurred during the Company’s fourth fiscal quarter that have materially affected, or are reasonably likely to affect, the Company’s internal controls over financial reporting. Based on that evaluation, there has been no such change during the Company’s fourth fiscal quarter.
Limitations of the Effectiveness
A control system, no matter how well conceived and operated, can provide only reasonable, not absolute, assurance that the objectives of the internal control system are met. Because of the inherent limitations of any internal control system, no evaluation of controls can provide absolute assurance that all control issues, if any, within a company have been detected. Notwithstanding these limitations, the Company’s disclosure controls and procedures are designed to provide reasonable assurance of achieving their objectives. The Company’s Chief Executive Officer and Chief Financial Officer have concluded that the Company’s disclosure controls and procedures are, in fact, effective at the “reasonable assurance” level.
ITEM 9B. OTHER INFORMATION.
None.
58
PART III
ITEM 10. DIRECTORS, EXECUTIVE OFFICERS AND CORPORATE GOVERNANCE.
The sections entitled “Nomination and Election of Directors” and “Remuneration of Directors and Officers” in the Company’s definitive Proxy Statement to be furnished to shareholders in connection with the Annual Meeting of Shareholders to be held on July 12, 2007 are incorporated herein by reference.
Executive Officers of the Company
Name | | | | Age | | Position |
Lloyd Blonder | | 67 | | Senior Vice President and Chief Financial Officer, Treasurer. He has
been associated with the Company since 1983. |
Doug Briskie | | 43 | | Vice President, Corporate Development. He has been associated withthe Company since 1987. |
Aaron Cohen | | 70 | | Senior Vice President. He has been associated with the Company since 1961. |
Jack Lin | | 74 | | Chairman of the Company. He has been associated with the Company since 1961. |
Raffy Lorentzian | | 51 | | Vice President, Chief Accounting Officer. He has been associated with the Company since 1997. |
Cynthia Maher | | 48 | | Corporate Secretary, Corporate Counsel, Human Resources Director. She has been associated with the Company since 2005. |
William McGinnis | | 48 | | President and Chief Executive Officer of the Company. He has been associated with the Company since 1980. |
Dwight Moore | | 44 | | Vice President, Chief Operating Officer. He has been associated with the Company since 1997. |
The Company’s Board of Directors has adopted a code of ethics that applies to our principal executive officers, principal financial officer, and corporate controller, as well as other employees. A copy of this code of ethics has been posted on the Company’s website. Any amendments to, or waivers from, a provision of our code of ethics that applies to our principal executive officer, principal financial officer, controller, or persons performing similar functions and that relates to any element of the code of ethics enumerated in paragraph (b) of Item 406 of Regulations S-K shall be disclosed by posting such information on our website.
ITEM 11. EXECUTIVE COMPENSATION.
The section entitled “Remuneration of Directors and Officers” in the Company’s definitive Proxy Statement to be furnished to shareholders in connection with the Annual Meeting of Shareholders to be held on July 12, 2007 is incorporated herein by reference.
ITEM 12. SECURITY OWNERSHIP OF CERTAIN BENEFICIAL OWNERS, MANAGEMENT AND RELATED STOCKHOLDER MATTERS.
The sections entitled “Voting Securities and Principal Holders Thereof” and “Nomination and Election of Directors” in the Company’s definitive Proxy Statement to be furnished to shareholders in connection with the Annual Meeting of Shareholders to be held on July 12, 2007 are incorporated herein by reference.
59
ITEM 13. CERTAIN RELATIONSHIPS AND RELATED TRANSACTIONS AND DIRECTOR INDEPENDENCE.
The section entitled “Transactions with Management and Other” and “Nomination and Election of Directors” in the Company’s definitive Proxy Statement to be furnished to shareholders in connection with the Annual Meeting of Shareholders to be held on July 12, 2007 is incorporated herein by reference.
ITEM 14. PRINCIPAL ACCOUNTANT FEES AND SERVICES.
The information under the heading “Audit Fees and All Other Fees” in the Company’s definitive Proxy Statement to be furnished to shareholders in connection with the Annual Meeting of Shareholders to be held on July 12, 2007 is incorporated herein by reference.
PART IV
ITEM 15. EXHIBITS AND FINANCIAL STATEMENT SCHEDULES.
A. Consolidated Financial Statements and Schedules.
Financial statements required by Item 15 are included in Item 8 above.
Financial Statements:
Consolidated Balance Sheets—January 31, 2007 and 2006
Consolidated Statements of Income—Years ended January 31, 2007, 2006 and 2005
Consolidated Statements of Shareholders’ Equity—Years ended January 31, 2007, 2006 and 2005
Consolidated Statements of Cash Flows—Years ended January 31, 2007, 2006 and 2005
Notes to Consolidated Financial Statements
| | Schedule |
Schedule Supporting Financial Statements: | | |
Valuation and Qualifying Accounts and Reserves | | II |
B. Exhibits.
2.1 | | Asset Purchase Agreement, dated as of January 23, 2004, by and among National Technical Systems, Inc., NTS Technical Systems, Robert Wakefield, Randolph Fairfield, Calvin Milam, E&C Holdings, Inc., Peterson Builders, Inc., and DTI Holdings LLC. (filed January 30, 2004 and is incorporated herein by reference thereto). |
2.2 | | Pro forma financial information related to the acquisition of DTI Holdings LLC. (filed with the Company’s 8-K/A on March 22, 2004 and is incorporated herein by reference thereto). |
3.1 | | Articles of Incorporation of National Technical Systems, Inc., a California corporation, as amended to date. (filed with the Company’s Annual Report on Form 10-K on April 28, 2004 and is incorporated herein by reference thereto). |
3.2 | | Bylaws of National Technical Systems, Inc., a California corporation, as adopted on May 29, 1996 and as amended by amendment number one thereto, adopted on June 25, 1999. (filed with the Company’s Annual Report on Form 10-K on April 28, 2004 and is incorporated herein by reference thereto). |
3.3 | | Bylaws of National Technical Systems, Inc., a California corporation, as adopted on December 14, 2004. (filed on September 13,2006 and is incorporated herein by reference thereto). |
60
10.1 | | Form of the Company’s 1994 Stock Option Plan (filed as Appendix B to the Company’s Proxy Statement for Annual Meeting of June 30, 1994, and is incorporated herein by reference thereto). |
10.2 | | Amendment to the Company’s 1994 Stock Option Plan (filed as Proposal No. 3 to the Company’s Proxy Statement for Annual Meeting of June 26, 1998, and is incorporated herein by reference thereto). |
10.3 | | Form of the Company’s 2002 Stock Option Plan (filed as Proposal 2 to the Company’s Proxy Statement for Annual Meeting of June 28, 2002, and is incorporated herein by reference thereto). |
10.4 | | Amendment number one to revolving credit agreement between NTS and Comerica Bank effective July 17, 2002 (filed on September 12, 2002 and is incorporated herein by reference thereto). |
10.5 | | Amendment number two to revolving credit agreement between the Company and Comerica Bank effective November 25, 2002 (filed on December 13, 2002 and is incorporated herein by reference thereto). |
10.6 | | Amendment number three to revolving credit agreement between the Company and Comerica Bank effective July 21, 2003 (filed on September 11, 2003 and is incorporated herein by reference thereto). |
10.7 | | Amendment number four to revolving credit agreement between the Company and Comerica Bank effective July 30, 2004 (filed on December 15, 2004 and is incorporated herein by reference thereto). |
10.8 | | Employment agreement between the Company and Dr. Jack Lin dated April 28, 2005 (filed on May 3, 2005 and is incorporated herein by reference thereto). |
10.9 | | Amendment number five to revolving credit agreement between the Company and Comerica Bank effective July 1, 2005 (filed on September 14, 2005 and is incorporated herein by reference thereto). |
10.10 | | Amendment number six to revolving credit agreement between the Company and Comerica Bank effective March 29, 2006 (filed on March 30, 2006 and is incorporated herein by reference thereto). |
10.11 | | Amendment number seven to revolving credit agreement between the Company and Comerica Bank effective September 21, 2006 (filed on December 14, 2006 and is incorporated herein by reference thereto). |
10.12 | | National Technical Systems, Inc. 2006 Long-Term Incentive Plan. (filed on December 14, 2006 and is incorporated herein by reference thereto). |
10.13 | | National Technical Systems, Inc. 2006 Supplemental Executive Retirement Plan. (filed on December 14, 2006 and is incorporated herein by reference thereto). |
14.1 | | Code of Business Ethics (filed with the Company’s Annual Report on Form 10-K on April 28, 2006 and is incorporated herein by reference thereto). |
21.1 | | Subsidiaries of the Company. |
23.1 | | Consent of Independent Registered Public Accounting Firm. |
23.2 | | Consent of XXCAL Japan, Inc. Independent Auditors and .Independent Auditor’s Report. |
23.3 | | Consent of NQA, Inc. Independent Auditors and Report of Independent Registered Public Accounting Firm. |
31.1 | | Certification of the Principal Executive Officer pursuant to rule 13a-14(a) and 15d-14(a) of the Securities Exchange Act of 1934, as adopted pursuant to Section 302 of the Sarbanes-Oxley Act of 2002. |
31.2 | | Certification of the Principal Financial Officer pursuant to rule 13a-14(a) and 15d-14(a) of the Securities Exchange Act of 1934, as adopted pursuant to Section 302 of the Sarbanes-Oxley Act of 2002. |
61
32.1 | | Certification of the Principal Executive Officer pursuant to 18 U.S.C. Section 1350, as adopted pursuant to Section 906 of the Sarbanes-Oxley Act of 2002. |
32.2 | | Certification of the Principal Financial Officer pursuant to 18 U.S.C. Section 1350, as adopted pursuant to Section 906 of the Sarbanes-Oxley Act of 2002. |
62
SIGNATURES
Pursuant to the requirements of Section 13 or 15(d) of the Securities and Exchange Act of 1934, the registrant has duly caused this report to be signed on its behalf by the undersigned, thereunto duly authorized.
| NATIONAL TECHNICAL SYSTEMS, INC. |
April 30, 2007 | By | /s/ WILLIAM MCGINNIS |
| | William McGinnis, |
| | Chief Executive Officer |
| | and Director |
| | (Principal Executive Officer) |
Pursuant to the requirements of Section of the Securities Exchange Act of 1934, this report has been signed below by the following persons on behalf of the registrant and in the capacities indicated on
/s/ JACK LIN | | /s/ AARON COHEN |
Jack Lin, | | Aaron Cohen, |
Chairman of the Board | | Senior Vice President and
Vice Chairman of the Board |
/s/ WILLIAM MCGINNIS | | /s/ LLOYD BLONDER |
William McGinnis, | | Lloyd Blonder, |
Chief Executive Officer
and Director
(Principal Executive Officer) | | Senior Vice President
and Treasurer
(Principal Financial Officer) |
/s/ RAFFY LORENTZIAN | | /s/ JOHN GIBBONS |
Raffy Lorentzian, | | John Gibbons, |
Vice President and
Chief Accounting Officer | | Director |
/s/ DAN YATES | | /s/ RALPH F. CLEMENTS |
Dan Yates, | | Ralph F. Clements, |
Director | | Director |
/s/ NORMAN S. WOLFE | | /s/ DONALD J. TRINGALI |
Norman S. Wolfe, | | Donald J. Tringali, |
Director | | Director |
/s/ ROBERT I. LIN | | |
Robert I. Lin, | | |
Director | | |
63
Schedule II
NATIONAL TECHNICAL SYSTEMS, INC. AND SUBSIDIARIES
Valuation and Qualifying Accounts and Reserves
Years ended January 31, 2007, 2006 and 2005
Column A | | Column B | | Column C | | Column D | | Column E | |
| | Balance at | | Additions— | | | | Balance | |
| | beginning of | | charged to costs | | | | at end | |
Description | | | | period | | and expenses | | Deductions | | of period | |
Allowance for doubtful accounts receivable: | | | | | | | | | | | | | |
Year ended January 31, | | | | | | | | | | | | | |
2007 | | | $ | 816,000 | | | | $ | 314,000 | | | $ | (439,000 | ) | $ | 691,000 | |
2006 | | | $ | 906,000 | | | | $ | 140,000 | | | $ | (229,000 | ) | $ | 816,000 | |
2005 | | | $ | 938,000 | | | | $ | 252,000 | | | $ | (284,000 | ) | $ | 906,000 | |
| | | | | | | | | | | | | | | | | | | |
64