| Update to Presentation April 16, 2003 Confidential |
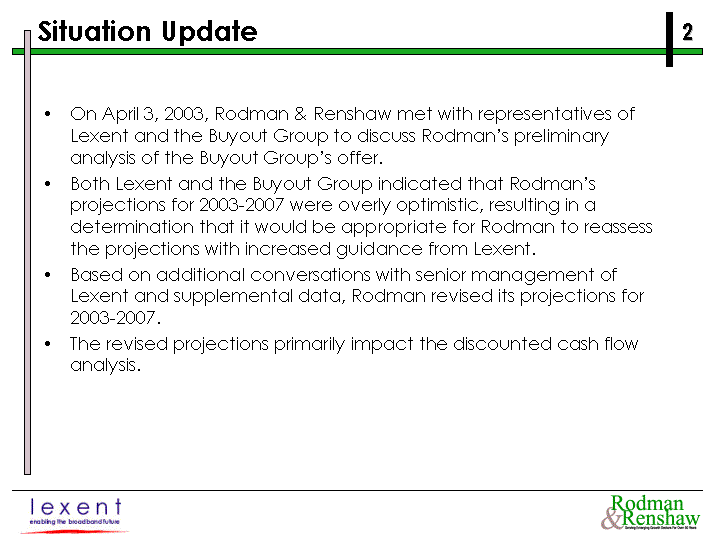
| Situation Update On April 3, 2003, Rodman & Renshaw met with representatives of Lexent and the Buyout Group to discuss Rodman's preliminary analysis of the Buyout Group's offer. Both Lexent and the Buyout Group indicated that Rodman's projections for 2003-2007 were overly optimistic, resulting in a determination that it would be appropriate for Rodman to reassess the projections with increased guidance from Lexent. Based on additional conversations with senior management of Lexent and supplemental data, Rodman revised its projections for 2003-2007. The revised projections primarily impact the discounted cash flow analysis. |
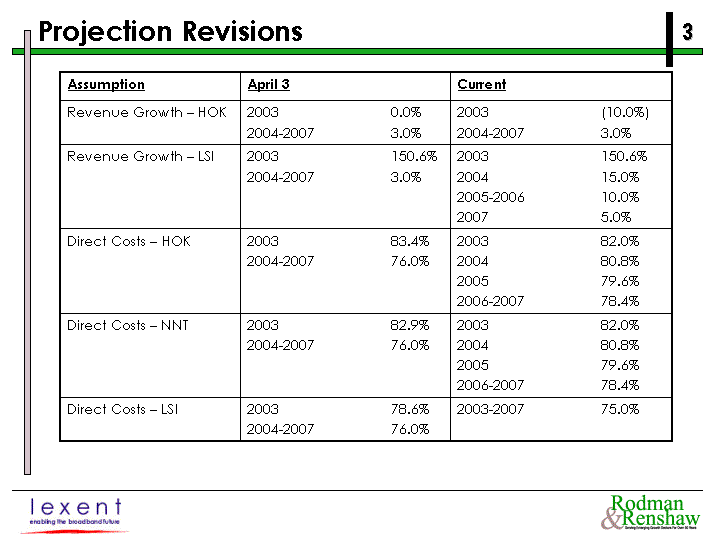
| Projection Revisions Assumption April 3 Current Revenue Growth - HOK 2003 0.0% 2004-2007 3.0% 2003 (10.0%) 2004-2007 3.0% Revenue Growth - LSI 2003 150.6% 2004-2007 3.0% 2003 150.6% 2004 15.0% 2005-2006 10.0% 2007 5.0% Direct Costs - HOK 2003 83.4% 2004-2007 76.0% 2003 82.0% 2004 80.8% 2005 79.6% 2006-2007 78.4% Direct Costs - NNT 2003 82.9% 2004-2007 76.0% 2003 82.0% 2004 80.8% 2005 79.6% 2006-2007 78.4% Direct Costs - LSI 2003 78.6% 2004-2007 76.0% 2003-2007 75.0% |
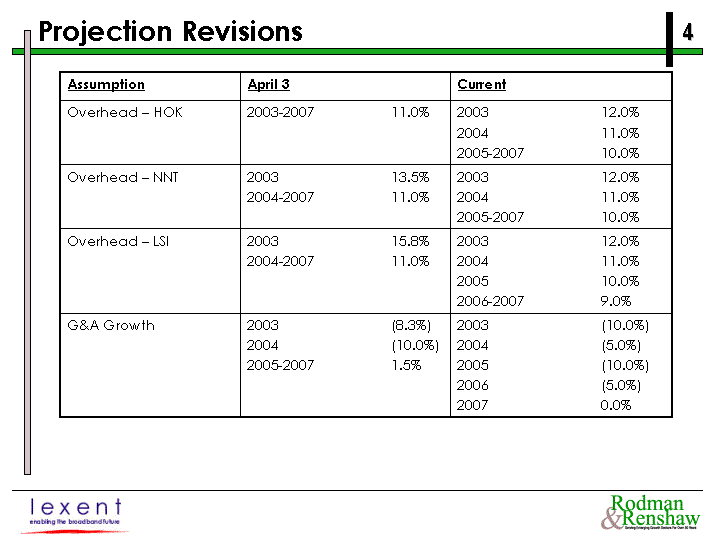
| Projection Revisions Assumption April 3 Current Overhead - HOK 2003-2007 11.0% 12.0% 11.0% - -2007 10.0% Overhead - NNT 2003 13.5% 2004-2007 11.0% 12.0% 11.0% - -2007 10.0% Overhead - LSI 2003 15.8% 2004-2007 11.0% 12.0% 11.0% 10.0% - -2007 9.0% G&A Growth (8.3%) (10.0%) - -2007 1.5% (10.0%) (5.0%) (10.0%) (5.0%) 0.0% |
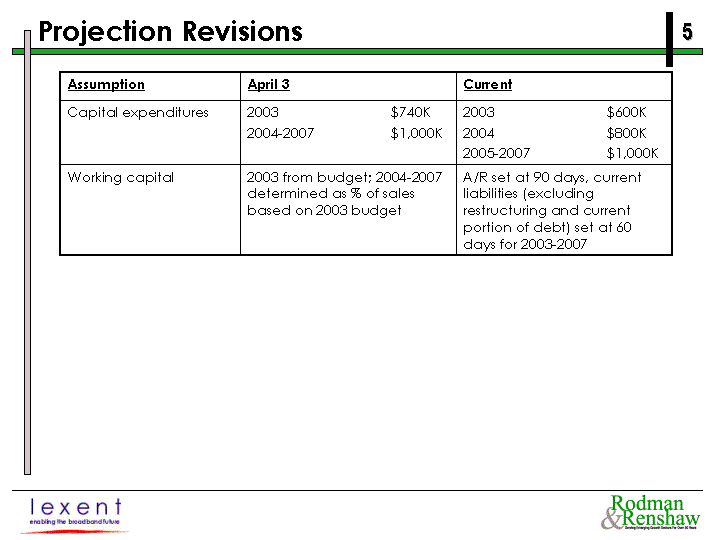
| Projection Revisions Assumption April 3 Current Capital expenditures $740K - -2007 $1,000K $600K $800K - -2007 $1,000K Working capital 2003 from budget; 2004-2007 determined as % of sales based on 2003 budget A/R set at 90 days, current liabilities (excluding restructuring and current portion of debt) set at 60 days for 2003-2007 |
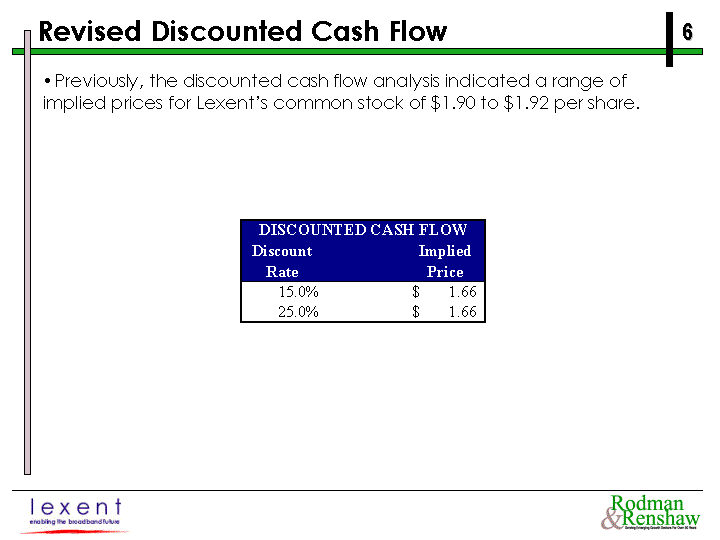
| Revised Discounted Cash Flow Previously, the discounted cash flow analysis indicated a range of implied prices for Lexent's common stock of $1.90 to $1.92 per share. |
Lexent Inc.
Summary of Analysis
TRANSACTION VALUATION
| Proposed transaction price | $ | 1.25 | |||
| Shares outstanding (incl. options) | 42,601 | ||||
| Equity value | $ | 53,251 | |||
| Plus net debt assumed | $ | (69,365 | ) | ||
| Total consideration | $ | (16,114 | ) | ||
| Premium to stock price | 37.4 | % | |||
Multiples | |||||
| Total consideration/: | |||||
| Revenue | NM | ||||
| EBIT | NM | ||||
| EBITDA | NM | ||||
| Equity value/: | |||||
| Book value | 0.6x | ||||
| Tangible net worth | 0.6x | ||||
COMPARABLE COMPANY ANALYSIS
| Average | Implied | |||||||
| Multiple | Price | |||||||
| Revenue | 0.4x | $ | 2.69 | |||||
| EBIT | 8.0x | NM | ||||||
| EBITDA | 5.4x | NM | ||||||
| Book value | 0.9x | $ | 1.80 | |||||
COMPARABLE TRANSACTION ANALYSIS
| Average | Implied | |||||||
| Multiple | Price | |||||||
| Revenue | 0.6x | $ | 3.47 | |||||
| EBIT | 11.5x | NM | ||||||
| EBITDA | 5.8x | NM | ||||||
| Average | Implied | |||||||
| Premium | Price | |||||||
| 1 day before | 15.0 | % | $ | 1.05 | ||||
| 1 week before | 25.1 | % | $ | 1.14 | ||||
| 4 weeks before | 32.0 | % | $ | 1.20 | ||||
PREMIUMS PAID
| Implied | Implied | |||||||||||||||
| Average | Price | Median | Price | |||||||||||||
Small Cap. | ||||||||||||||||
| 1 day before | 43.2 | % | $ | 1.30 | 32.3 | % | $ | 1.20 | ||||||||
| 1 week before | 51.6 | % | $ | 1.38 | 36.5 | % | $ | 1.24 | ||||||||
| 4 weeks before | 57.7 | % | $ | 1.44 | 46.6 | % | $ | 1.33 | ||||||||
Comparable Industry | ||||||||||||||||
| 1 day before | 27.4 | % | $ | 1.16 | 26.8 | % | $ | 1.15 | ||||||||
| 1 week before | 32.9 | % | $ | 1.21 | 33.6 | % | $ | 1.22 | ||||||||
| 4 weeks before | 40.1 | % | $ | 1.27 | 37.5 | % | $ | 1.25 | ||||||||
Majority Shareholder Acquiror | ||||||||||||||||
| 1 day before | 35.7 | % | $ | 1.23 | 27.0 | % | $ | 1.16 | ||||||||
| 1 week before | 38.8 | % | $ | 1.26 | 34.0 | % | $ | 1.22 | ||||||||
| 4 weeks before | 45.5 | % | $ | 1.32 | 41.2 | % | $ | 1.28 | ||||||||
DISCOUNTED CASH FLOW
| Discount | Implied | |||||
| Rate | Price | |||||
| 15.0 | % | $ | 1.66 | |||
| 25.0 | % | $ | 1.66 | |||
LIQUIDATION ANALYSIS
| Implied | ||||
| Price | ||||
| Low | $ | 1.21 | ||
| High | $ | 1.46 | ||
| Rodman & Renshaw, Inc. | 1 of 18 |
Lexent Inc.
Valuation
| Prior to Announcement | Implied Transaction Valuation | ||||||||||||
| (in thousands, except per share amounts) | |||||||||||||
| Current price per share (as of 2/14/03) | $ | 0.91 | Proposed transaction price | $ | 1.25 | ||||||||
| Fully diluted shares outstanding: | Fully diluted shares outstanding: | ||||||||||||
| Shares outstanding | 42,205 | Shares outstanding | 42,205 | ||||||||||
| Dilutive securities (a) | 292 | Dilutive securities (a) | 396 | ||||||||||
| Total | 42,497 | Total | 42,601 | ||||||||||
| Equity value | $ | 38,673 | Equity value | $ | 53,251 | ||||||||
| Plus net debt assumed | $ | (69,365 | ) | Plus net debt assumed | $ | (69,365 | ) | ||||||
| Total consideration | $ | (30,692 | ) | Total consideration | $ | (16,114 | ) | ||||||
| (a) | Calculated using the treasury method. |
| Rodman & Renshaw, Inc. | 2 of 18 |
| Comparable Company Analysis | Page 1 |
Operating Statistics
(data in thousands)
| Latest Twelve Months | ||||||||||||||||||||||||||||||||
| Fiscal | Financial | Net | Gross | Gross | ||||||||||||||||||||||||||||
| Company | Ticker | Year End | Data As Of | Revenues (a) | Profit | Margin | EBIT (b) | |||||||||||||||||||||||||
Lexent,Inc. - At Announement | LXNT | 12/31 | 12/31/02 | $ | 123,842 | $ | (6,682 | ) | -5.4 | % | $ | (27,375 | ) | (d | ) | |||||||||||||||||
Lexent Inc. - Transaction | LXNT | 12/31 | 12/31/02 | 123,842 | (6,682 | ) | -5.4 | % | (27,375 | ) | (d | ) | ||||||||||||||||||||
| Dycom Industries, Inc. | DY | 07/27 | 01/25/03 | 613,559 | 136,594 | 22.3 | % | 22,355 | (e | ) | ||||||||||||||||||||||
| EMCOR Group, Inc. | EME | 12/31 | 12/31/02 | 3,968,051 | 482,634 | 12.2 | % | 114,425 | ||||||||||||||||||||||||
| Integrated Electrical Services, Inc. | IES | 09/30 | 12/31/02 | 1,448,828 | 215,713 | 14.9 | % | 52,683 | (f | ) | ||||||||||||||||||||||
| MasTec, Inc. | MTZ | 12/31 | 12/31/02 | 838,055 | N/A | NM | 33,136 | (g | ) | |||||||||||||||||||||||
| Quanta Services, Inc. | PWR | 12/31 | 12/31/02 | 1,750,713 | 236,773 | 13.5 | % | 76,848 | (i | ) | ||||||||||||||||||||||
| Averages (j): | 15.7 | % | ||||||||||||||||||||||||||||||
[Additional columns below]
[Continued from above table, first column(s) repeated]
| Latest Twelve Months | ||||||||||||||||||||||||||||||||||
| EBIT | EBITDA | Net | Net | |||||||||||||||||||||||||||||||
| Company | Ticker | Margin | EBITDA (c) | Margin | Income | Margin | ||||||||||||||||||||||||||||
Lexent,Inc. - At Announement | LXNT | NM | $ | (22,588 | ) | (d | ) | NM | $ | (36,224 | ) | (e | ) | NM | ||||||||||||||||||||
Lexent Inc. - Transaction | LXNT | NM | (22,588 | ) | (d | ) | NM | (36,224 | ) | (e | ) | NM | ||||||||||||||||||||||
| Dycom Industries, Inc. | DY | 3.6 | % | 64,767 | (e | ) | 10.6 | % | 9,969 | (e | ) | 1.6 | % | |||||||||||||||||||||
| EMCOR Group, Inc. | EME | 2.9 | % | 129,796 | 3.3 | % | 62,902 | 1.6 | % | |||||||||||||||||||||||||
| Integrated Electrical Services, Inc. | IES | 3.6 | % | 70,739 | (f | ) | 4.9 | % | 16,513 | (f | ) | 1.1 | % | |||||||||||||||||||||
| MasTec, Inc. | MTZ | 4.0 | % | 69,082 | (g | ) | 8.2 | % | 2,873 | (h | ) | 0.3 | % | |||||||||||||||||||||
| Quanta Services, Inc. | PWR | 4.4 | % | 133,900 | (i | ) | 7.6 | % | 23,122 | (i | ) | 1.3 | % | |||||||||||||||||||||
| Averages (j): | 3.7 | % | 6.6 | % | 1.4 | % | ||||||||||||||||||||||||||||
| (a) | Revenues exclude interest and investment income. | |
| (b) | Earnings before interest and taxes. | |
| (c) | EBIT plus depreciation and amortization. | |
| (d) | Excludes provision for doubtful accounts of $0.1 million, impairment of goodwill of $1.5 million, restructuring charges of $9.1 million and non-cash stock compensation of $3.3 million. | |
| (e) | Excludes impairment write-off of $47.9 million and bad debt expense of $21.6 million. | |
| (f) | Excludes $1.6 million of restructuring charges. | |
| (g) | Excludes non-recurring expenses of $93.6 million and impairment of goodwill of $79.7 million. | |
| (h) | Excludes non-recurring expenses of $93.6 million, impairment of goodwill of $79.7 million and cumulative effect of accounting change of $25.7 million, net of taxes. | |
| (i) | Excludes extraordinary expenses totaling $232.4 million. | |
| (j) | Averages exclude Lexent Inc. |
| Rodman & Renshaw, Inc. | 3 of 18 |
| Comparable Company Analysis | Page 2 |
Market and Book Value Statistics
(data in thousands, except per share amounts)
| Market Value Data | Market Capitalization Data | Book Value Statistics | ||||||||||||||||||||||||||||||||||||||||||||||||||
| 52-Week | Common | Total Cap. | ||||||||||||||||||||||||||||||||||||||||||||||||||
| Price @ | Tot. Shares | Market | Total | Cash and | Enterprise | Equity at | at Book | Total Debt/ | ||||||||||||||||||||||||||||||||||||||||||||
| Company | High | Low | 04/14/03 | Out. (a) | Cap. (b) | Debt (c) | Equiv. (d) | Value (e) | Book Value | Value (f) | Total Cap. | |||||||||||||||||||||||||||||||||||||||||
Lexent, Inc. - At Announement | $ | 3.48 | $ | 0.75 | $ | 0.91 | 42,205 | $ | 38,406 | $ | 2,499 | $ | 74,423 | $ | (33,518 | ) | $ | 91,725 | $ | 94,224 | 2.7 | % | ||||||||||||||||||||||||||||||
Lexent Inc. - Transaction | 3.48 | 0.75 | 1.25 | 42,205 | 52,756 | 2,499 | 74,423 | (19,168 | ) | 91,725 | 94,224 | 2.7 | % | |||||||||||||||||||||||||||||||||||||||
| Dycom Industries, Inc .. | 16.15 | 8.00 | 10.59 | 47,872 | 506,959 | 65 | 131,375 | 375,649 | 434,521 | 434,586 | 0.0 | % | ||||||||||||||||||||||||||||||||||||||||
| EMCOR Group, Inc. | 64.35 | 43.40 | 47.81 | 16,057 | 767,679 | 135,181 | 93,103 | 809,757 | 489,870 | 625,051 | 21.6 | % | ||||||||||||||||||||||||||||||||||||||||
| Integrated Electrical Services, Inc. | 6.49 | 3.10 | 5.40 | 41,832 | 225,894 | 248,780 | 19,062 | 455,612 | 257,211 | 505,991 | 49.2 | % | ||||||||||||||||||||||||||||||||||||||||
| MasTec, Inc. | 9.13 | 1.31 | 2.02 | 47,990 | 96,940 | 197,435 | 30,730 | (g) | 263,645 | 273,748 | 471,183 | 41.9 | % | |||||||||||||||||||||||||||||||||||||||
| Quanta Services, Inc. | 18.90 | 1.75 | 3.46 | 69,550 | 240,644 | 465,241 | 53,901 | (h) | 651,984 | 637,671 | (h) | 1,102,912 | 42.2 | % | ||||||||||||||||||||||||||||||||||||||
| Averages (i): | 31.0 | % | ||||||||||||||||||||||||||||||||||||||||||||||||||
| (a) | Total shares outstanding as of latest SEC filing. | |
| (b) | Market value equals current stock price times total shares outstanding. | |
| (c) | Total debt equals long-term debt (including capitalized leases), current maturities and other short-term borrowings. | |
| (d) | Includes cash, restricted cash and short-term, marketable securities. | |
| (e) | Enterprise value equals market value plus total debt plus preferred stock and minority interest less cash. | |
| (f) | Total debt plus total common equity at book value. | |
| (g) | Includes $22 million tax refund received in the first quarter of 2003. | |
| (h) | Adjusted for $26 million sale of new common stock to First Reserve in October 2002. | |
| (i) | Averages exclude Lexent Inc. |
| Rodman & Renshaw, Inc. | 4 of 18 |
| Comparable Company Analysis | Page 3 |
Market Multiples
| Latest Twelve Months | Enterprise Value/LTM | |||||||||||||||||||||||||||||||||||||||
| Mkt. Cap./ | ||||||||||||||||||||||||||||||||||||||||
| Company | EPS | P/E | Revenues | EBIT | EBITDA | Book Value | ||||||||||||||||||||||||||||||||||
Lexent,Inc. - At Announement | $ | (0.86 | ) | NM | NM | NM | NM | 0.4x | ||||||||||||||||||||||||||||||||
Lexent Inc. - Transaction | (0.86 | ) | NM | NM | NM | NM | 0.6x | |||||||||||||||||||||||||||||||||
| Dycom Industries, Inc. | 0.20 | 51.9x | (b) | 0.6x | 16.8x | (b) | 5.8x | 1.2x | ||||||||||||||||||||||||||||||||
| EMCOR Group, Inc. | 4.07 | 11.7x | 0.2x | 7.1x | 6.2x | 1.6x | ||||||||||||||||||||||||||||||||||
| Integrated Electrical Services, Inc. | 0.41 | 13.0x | 0.3x | 8.6x | 6.4x | 0.9x | ||||||||||||||||||||||||||||||||||
| MasTec, Inc. | 0.06 | 33.7x | (b) | 0.3x | 8.0x | 3.8x | 0.4x | |||||||||||||||||||||||||||||||||
| Quanta Services, Inc. | 0.29 | 12.1x | 0.4x | 8.5x | 4.9x | 0.4x | ||||||||||||||||||||||||||||||||||
| Averages (a): | 12.3x | 0.4x | 8.0x | 5.4x | 0.9x | |||||||||||||||||||||||||||||||||||
| (a) | Averages exclude Lexent Inc. | |
| (b) | Excluded from averages. |
| Rodman & Renshaw, Inc. | 5 of 18 |
18
Lexent Inc.
Comparable M&A Transactions
(data in thousands)
| Purchase | ||||||||||||||||||||||||||||
| Announced | Effective | Price | Equity | Net Debt | Total | |||||||||||||||||||||||
| Date | Date | Acquiror | Target | Per Share | Value | Assumed (a) | Consideration | |||||||||||||||||||||
| 03/20/02 | 04/15/02 | 180 Connect Inc. | Viasource Communications, Inc. | N/A | N/A | N/A | $ | 44,000 | ||||||||||||||||||||
| 02/26/02 | 04/01/02 | Investor group | International FiberCom, Inc. | N/A | N/A | N/A | 43,900 | |||||||||||||||||||||
| 01/07/02 | 02/27/02 | Dycom Industries, Inc. | Arguss Communications, Inc. | $ | 5.76 | $ | 83,779 | $ | 70,127 | 153,906 | ||||||||||||||||||
| 11/13/00 | 11/13/00 | MagneTek, Inc. | J-Tec, Inc. | N/A | 24,000 | (2,346 | ) | 21,654 | ||||||||||||||||||||
| 08/23/00 | 12/22/00 | Bracknell Corporation | Able Telecom Holding Corp. | 2.52 | 41,342 | 84,589 | (e) | 125,932 | ||||||||||||||||||||
| 06/29/00 | 09/18/00 | InfrastruX Group, Inc. | UTILX Corporation | 6.13 | 45,809 | 5,517 | 51,326 | |||||||||||||||||||||
| 05/26/00 | 05/26/00 | Arguss Communications, Inc. | U.S. Communications | N/A | 20,386 | 3,293 | 23,679 | |||||||||||||||||||||
| 05/01/00 | 05/01/00 | Orius Corp. | Hattech, Inc. | N/A | 27,838 | 1,670 | 29,508 | |||||||||||||||||||||
| 03/09/00 | 03/09/00 | Bracknell Corporation | Sunbelt Integrated Trade Services, Inc. | N/A | N/A | N/A | 127,000 | |||||||||||||||||||||
[Additional columns below]
[Continued from above table, first column(s) repeated]
| Latest Twelve Month Financial Data of Target | ||||||||||||||||||||||||||||||||
| Announced | Effective | |||||||||||||||||||||||||||||||
| Date | Date | Acquiror | Target | Revenues | EBIT | EBITDA | Net Income | CFFO (b) | ||||||||||||||||||||||||
| 03/20/02 | 04/15/02 | 180 Connect Inc. | Viasource Communications, Inc. | $ | 215,147 | $ | (20,430 | ) (c) | $ | 2,145 | (c) | $ | (28,689 | ) (c) | $ | (6,115 | ) (c) | |||||||||||||||
| 02/26/02 | 04/01/02 | Investor group | International FiberCom, Inc. | 341,942 | (5,161 | ) (d) | 9,155 | (d) | N/A | N/A | ||||||||||||||||||||||
| 01/07/02 | 02/27/02 | Dycom Industries, Inc. | Arguss Communications, Inc. | 216,175 | 2,555 | 22,348 | (4,976 | ) | 14,817 | |||||||||||||||||||||||
| 11/13/00 | 11/13/00 | MagneTek, Inc. | J-Tec, Inc. | 24,419 | 4,105 | 4,432 | 2,398 | 2,725 | ||||||||||||||||||||||||
| 08/23/00 | 12/22/00 | Bracknell Corporation | Able Telecom Holding Corp. | 458,118 | (48,253 | ) | (36,158 | ) | (52,569 | ) (f) | (40,474 | ) (f) | ||||||||||||||||||||
| 06/29/00 | 09/18/00 | InfrastruX Group, Inc. | UTILX Corporation | 108,731 | 2,365 | 6,498 | 1,605 | 5,738 | ||||||||||||||||||||||||
| 05/26/00 | 05/26/00 | Arguss Communications, Inc. | U.S. Communications | 14,722 | 3,175 | 4,003 | 1,764 | 2,592 | ||||||||||||||||||||||||
| 05/01/00 | 05/01/00 | Orius Corp. | Hattech, Inc. | 31,972 | 47 | 396 | (208 | ) | 141 | |||||||||||||||||||||||
| 03/09/00 | 03/09/00 | Bracknell Corporation | Sunbelt Integrated Trade Services, Inc. | 265,800 | (g) | N/A | 27,800 | (g) | N/A | N/A | ||||||||||||||||||||||
[Continued from above table, first column(s) repeated]
| Total Consideration to | ||||||||||||||||
| Acquiror | Target | Revenues | EBIT | EBITDA | ||||||||||||
| 180 Connect Inc. | Viasource Communications, Inc. | 0.2x | N/A | 20.5x | (h) | |||||||||||
| Investor group | International FiberCom, Inc. | 0.1x | N/A | 4.8x | ||||||||||||
| Dycom Industries, Inc. | Arguss Communications, Inc. | 0.7x | 60.2x | (h) | 6.9x | |||||||||||
| MagneTek, Inc. | J-Tec, Inc. | 0.9x | 5.3x | 4.9x | ||||||||||||
| Bracknell Corporation | Able Telecom Holding Corp. | 0.3x | N/A | N/A | ||||||||||||
| InfrastruX Group, Inc. | UTILX Corporation | 0.5x | 21.7x | 7.9x | ||||||||||||
| Arguss Communications, Inc. | U.S. Communications | 1.6x | 7.5x | 5.9x | ||||||||||||
| Orius Corp. | Hattech, Inc. | 0.9x | 626.4x | (h) | 74.6x | (h) | ||||||||||
| Bracknell Corporation | Sunbelt Integrated Trade Services, Inc. | 0.5x | N/A | 4.6x | ||||||||||||
| Averages: | 0.6x | 11.5x | 5.8x | |||||||||||||
[Additional columns below]
[Continued from above table, first column(s) repeated]
| Equity Value to | ||||||||||||
| Acquiror | Target | Net Income | CFFO | |||||||||
| 180 Connect Inc. | Viasource Communications, Inc. | N/A | N/A | |||||||||
| Investor group | International FiberCom, Inc. | N/A | N/A | |||||||||
| Dycom Industries, Inc. | Arguss Communications, Inc. | N/A | 5.7x | |||||||||
| MagneTek, Inc. | J-Tec, Inc. | 10.0x | 8.8x | |||||||||
| Bracknell Corporation | Able Telecom Holding Corp. | N/A | N/A | |||||||||
| InfrastruX Group, Inc. | UTILX Corporation | 28.5x | (h) | 8.0x | ||||||||
| Arguss Communications, Inc. | U.S. Communications | 11.6x | 7.9x | |||||||||
| Orius Corp. | Hattech, Inc. | N/A | 197.8x | (h) | ||||||||
| Bracknell Corporation | Sunbelt Integrated Trade Services, Inc. | N/A | N/A | |||||||||
| Averages: | 10.8x | 7.6x | ||||||||||
[Additional columns below]
[Continued from above table, first column(s) repeated]
| Premium to Target Stock Price | ||||||||||||||||
| Acquiror | Target | 1 Day | 1 Week | 4 Weeks | ||||||||||||
| 180 Connect Inc. | Viasource Communications, Inc. | N/A | N/A | N/A | ||||||||||||
| Investor group | International FiberCom, Inc. | N/A | N/A | N/A | ||||||||||||
| Dycom Industries, Inc. | Arguss Communications, Inc. | 30.3 | % | 41.9 | % | 53.2 | % | |||||||||
| MagneTek, Inc. | J-Tec, Inc. | N/A | N/A | N/A | ||||||||||||
| Bracknell Corporation | Able Telecom Holding Corp. | -25.2 | % | 1.0 | % | -8.2 | % | |||||||||
| InfrastruX Group, Inc. | UTILX Corporation | 39.8 | % | 32.3 | % | 50.9 | % | |||||||||
| Arguss Communications, Inc. | U.S. Communications | N/A | N/A | N/A | ||||||||||||
| Orius Corp. | Hattech, Inc. | N/A | N/A | N/A | ||||||||||||
| Bracknell Corporation | Sunbelt Integrated Trade Services, Inc. | N/A | N/A | N/A | ||||||||||||
| Averages: | 15.0 | % | 25.1 | % | 32.0 | % | ||||||||||
| (a) | Represents total debt less cash and cash equivalents. | |
| (b) | CFFO is equal to net income plus depreciation and amortization. | |
| (c) | Excludes impairment of intangible assets of $65.5 million and restructuring charge of $6.7 million. | |
| (d) | Excludes non-recurring impairment charges of $87.8 million. | |
| (e) | Includes value of Bracknell shares issued for litigation settlement, redeemable securities and Worldcom debt. | |
| (f) | Excludes $25.0 million litigation settlement and $12.2 million impairment of investment. | |
| (g) | As disclosed in F-4 filed by Bracknell Corporation. | |
| (h) | Excluded from averages. |
| Rodman & Renshaw, Inc. | 6 of 18 |
Lexent Inc.
Premiums Paid Analysis — Small Cap.
| Transaction Date | Stock Price Before Announcement | Premium Paid | ||||||||||||||||||||||||||||||||
| Transaction | ||||||||||||||||||||||||||||||||||
| Announced | Effective | Acquiror | Target | Price | 1 Day | Week | 4 Weeks | 1 Day | Week | 4 Weeks | ||||||||||||||||||||||||
| 01/05/02 | 04/24/02 | TIBCO Software Inc | Talarian Corp | $ | 5.30 | $ | 3.14 | $ | 2.99 | $ | 2.50 | 68.8 | % | 77.3 | % | 112.0 | % | |||||||||||||||||
| 01/07/02 | 02/27/02 | Dycom Industries Inc | Arguss Communications Inc | 5.76 | 4.42 | 4.06 | 3.76 | 30.3 | % | 41.9 | % | 53.2 | % | |||||||||||||||||||||
| 01/07/02 | 03/20/02 | Chiron Corp | Matrix Pharmaceutical Inc | 2.21 | 2.59 | 1.57 | 1.25 | -14.7 | % | 40.8 | % | 76.8 | % | |||||||||||||||||||||
| 01/25/02 | 04/10/02 | Lone Star Fund | Shoney's Inc | 0.36 | 0.39 | 0.31 | 0.28 | -7.7 | % | 16.1 | % | 28.6 | % | |||||||||||||||||||||
| 01/28/02 | 05/14/02 | Investor Group | Jenny Craig Inc | 5.30 | 3.15 | 2.85 | 3.08 | 68.3 | % | 86.0 | % | 72.1 | % | |||||||||||||||||||||
| 01/29/02 | 05/01/02 | InTown Suites Management | Suburban Lodges of America Inc | 9.04 | 8.00 | 7.73 | 6.85 | 13.0 | % | 16.9 | % | 32.0 | % | |||||||||||||||||||||
| 02/07/02 | 08/22/02 | BioMarin Pharmaceutical Inc | Glyko Biomedical Ltd | 4.14 | 6.35 | 5.50 | 7.00 | -34.8 | % | -24.7 | % | -40.9 | % | |||||||||||||||||||||
| 02/08/02 | 04/20/02 | SHL Telemedicine Ltd | Raytel Medical Corp | 10.25 | 8.00 | 8.00 | 7.65 | 28.1 | % | 28.1 | % | 34.0 | % | |||||||||||||||||||||
| 02/10/02 | 10/28/02 | JAKKS Pacific Inc | Toymax International Inc | 4.50 | 3.05 | 1.90 | 1.87 | 47.5 | % | 136.8 | % | 140.6 | % | |||||||||||||||||||||
| 02/13/02 | 05/15/02 | Investor Group | Deltek Systems Inc | 7.15 | 6.04 | 5.56 | 5.04 | 18.4 | % | 28.6 | % | 41.9 | % | |||||||||||||||||||||
| 02/14/02 | 07/26/02 | Investor Group | dick clark productions inc | 14.50 | 10.93 | 9.70 | 9.70 | 32.7 | % | 49.5 | % | 49.5 | % | |||||||||||||||||||||
| 02/20/02 | 03/22/02 | SCC Contracting Inc | Sevenson Environmental Svcs | 16.00 | 12.70 | 12.70 | 12.70 | 26.0 | % | 26.0 | % | 26.0 | % | |||||||||||||||||||||
| 02/27/02 | 05/05/02 | Baxter International Inc | Fusion Medical Technologies | 10.00 | 8.30 | 8.09 | 7.49 | 20.5 | % | 23.6 | % | 33.5 | % | |||||||||||||||||||||
| 03/11/02 | 05/23/02 | Valueclick Inc | Be Free Inc | 1.95 | 1.55 | 1.53 | 2.15 | 25.8 | % | 27.5 | % | -9.3 | % | |||||||||||||||||||||
| 03/11/02 | 06/28/02 | Chesapeake Energy Corp | Canaan Energy Corp | 18.00 | 9.75 | 9.82 | 10.05 | 84.6 | % | 83.3 | % | 79.1 | % | |||||||||||||||||||||
| 03/18/02 | 04/26/02 | Santos Ltd | Esenjay Exploration Inc | 2.84 | 2.72 | 2.77 | 2.63 | 4.4 | % | 2.5 | % | 8.0 | % | |||||||||||||||||||||
| 03/18/02 | 09/13/02 | Network Associates Inc | McAfee.com Corp | 15.43 | 15.54 | 17.40 | 16.25 | -0.7 | % | -11.3 | % | -5.0 | % | |||||||||||||||||||||
| 03/18/02 | 05/14/02 | MSC.Software Corp | Mechanical Dynamics Inc | 18.85 | 12.01 | 14.29 | 11.00 | 57.0 | % | 31.9 | % | 71.4 | % | |||||||||||||||||||||
| 03/20/02 | 07/03/02 | Schering AG | Collateral Therapeutics Inc | 11.25 | 5.09 | 4.95 | 4.25 | 121.0 | % | 127.3 | % | 164.7 | % | |||||||||||||||||||||
| 03/20/02 | 09/09/02 | S&T Bancorp Inc | Peoples Financial Corp Inc | 52.20 | 38.25 | 38.25 | 37.00 | 36.5 | % | 36.5 | % | 41.1 | % | |||||||||||||||||||||
| 03/21/02 | 08/30/02 | South Financial Group Inc | Gulf West Banks Inc | 13.95 | 13.30 | 12.90 | 11.25 | 4.9 | % | 8.1 | % | 24.0 | % | |||||||||||||||||||||
| 03/22/02 | 07/07/02 | Instrumentarium Corp | SpaceLabs Medical Inc | 14.25 | 15.45 | 15.30 | 13.00 | -7.8 | % | -6.9 | % | 9.6 | % | |||||||||||||||||||||
| 03/26/02 | 07/22/02 | RBC Centura Banks Inc | Eagle Bancshares Inc | 26.00 | 17.50 | 16.00 | 15.45 | 48.6 | % | 62.5 | % | 68.3 | % | |||||||||||||||||||||
| 04/02/02 | 06/14/02 | Kroll Inc | ONTRACK Data International | 15.51 | 9.71 | 9.50 | 8.67 | 59.7 | % | 63.3 | % | 78.9 | % | |||||||||||||||||||||
| 04/11/02 | 08/31/02 | Banknorth Group Inc | Bancorp Connecticut Inc | 28.00 | 22.85 | 22.30 | 22.50 | 22.5 | % | 25.6 | % | 24.4 | % | |||||||||||||||||||||
| 04/22/02 | 06/10/02 | IXYS Corp | Clare Inc | 5.58 | 6.08 | 4.85 | 3.36 | -8.2 | % | 15.1 | % | 66.1 | % | |||||||||||||||||||||
| 04/23/02 | 06/05/02 | Mentor Graphics Corp | Innoveda Inc | 3.95 | 2.45 | 2.36 | 2.01 | 61.2 | % | 67.4 | % | 96.5 | % | |||||||||||||||||||||
| 04/24/02 | 06/28/02 | Cadence Design Systems Inc | Simplex Solutions Inc | 14.35 | 11.63 | 10.88 | 9.94 | 23.4 | % | 31.9 | % | 44.4 | % | |||||||||||||||||||||
| 04/25/02 | 07/17/02 | Plantation Petroleum Holdings | Maynard Oil Co | 17.00 | 18.95 | 18.40 | 19.50 | -10.3 | % | -7.6 | % | -12.8 | % | |||||||||||||||||||||
| 04/29/02 | 07/31/02 | Synovus Financial Corp | Community Financial Group | 26.00 | 18.54 | 18.50 | 18.50 | 40.2 | % | 40.5 | % | 40.5 | % | |||||||||||||||||||||
| 05/02/02 | 07/31/02 | MeriStar Hotels & Resorts Inc | Interstate Hotels Corp | 5.57 | 2.61 | 2.51 | 2.58 | 113.4 | % | 121.9 | % | 115.9 | % | |||||||||||||||||||||
| 05/02/02 | 06/18/02 | Level 3 Communications Inc | Software Spectrum Inc | 37.00 | 16.64 | 16.70 | 18.50 | 122.4 | % | 121.6 | % | 100.0 | % | |||||||||||||||||||||
| 05/08/02 | 09/27/02 | Olin Corp | Chase Industries Inc | 11.52 | 14.50 | 14.00 | 11.80 | -20.6 | % | -17.7 | % | -2.4 | % | |||||||||||||||||||||
| 05/14/02 | 07/08/02 | Boston Scientific Corp | BEI Medical Systems Co | 6.84 | 5.52 | 5.07 | 5.80 | 23.9 | % | 34.9 | % | 17.9 | % | |||||||||||||||||||||
| 05/15/02 | 06/27/02 | Cardinal Health Inc | Boron LePore & Associates Inc | 16.00 | 13.33 | 12.10 | 12.20 | 20.0 | % | 32.2 | % | 31.1 | % | |||||||||||||||||||||
| 05/15/02 | 06/26/02 | Kellwood Co | Gerber Childrenswear | 6.85 | 8.25 | 6.80 | 7.60 | -17.0 | % | 0.7 | % | -9.9 | % | |||||||||||||||||||||
| 05/16/02 | 01/01/03 | NSB Holding Corp | Liberty Bancorp | 26.50 | 18.23 | 18.25 | 17.87 | 45.4 | % | 45.2 | % | 48.3 | % | |||||||||||||||||||||
| 05/21/02 | 07/25/02 | Castle Harlan Inc | Morton's Restaurant Group Inc | 17.00 | 15.23 | 15.50 | 12.98 | 11.6 | % | 9.7 | % | 31.0 | % | |||||||||||||||||||||
| 05/23/02 | 10/29/02 | SymmetriCom Inc | Datum Inc | 16.84 | 11.41 | 11.22 | 11.92 | 47.6 | % | 50.1 | % | 41.3 | % | |||||||||||||||||||||
| 05/29/02 | 08/01/02 | Openwave Systems Inc | SignalSoft Corp | 2.26 | 1.06 | 1.05 | 1.17 | 113.2 | % | 115.2 | % | 93.2 | % | |||||||||||||||||||||
| 05/30/02 | 07/31/02 | Tier Technologies Inc | Official Payments Corp | 3.00 | 2.23 | 2.08 | 2.44 | 34.5 | % | 44.2 | % | 23.0 | % | |||||||||||||||||||||
| 06/10/02 | 07/22/02 | Novell Inc | SilverStream Software Inc | 9.00 | 5.14 | 4.81 | 4.90 | 75.1 | % | 87.1 | % | 83.7 | % | |||||||||||||||||||||
| Rodman & Renshaw, Inc. | 7 of 18 |
Lexent Inc.
Premiums Paid Analysis — Small Cap.
| Transaction Date | Stock Price Before Announcement | Premium Paid | ||||||||||||||||||||||||||||||||
| Transaction | ||||||||||||||||||||||||||||||||||
| Announced | Effective | Acquiror | Target | Price | 1 Day | Week | 4 Weeks | 1 Day | Week | 4 Weeks | ||||||||||||||||||||||||
| 06/10/02 | 09/06/02 | SmartForce PLC | SkillSoft Corp | 12.67 | 15.10 | 17.62 | 17.92 | -16.1 | % | -28.1 | % | -29.3 | % | |||||||||||||||||||||
| 06/12/02 | 11/15/02 | Cornerstone Equity Investors | Vestcom International Inc | 6.25 | 4.15 | 3.80 | 3.50 | 50.6 | % | 64.5 | % | 78.6 | % | |||||||||||||||||||||
| 06/25/02 | 08/23/02 | Liberty Broadband Interactive | Wink Communications Inc | 3.00 | 2.79 | 1.87 | 2.31 | 7.5 | % | 60.4 | % | 29.9 | % | |||||||||||||||||||||
| 07/23/02 | 11/18/02 | Umpqua Holdings Corp | Centennial Bancorp | 9.35 | 7.00 | 7.49 | 7.40 | 33.6 | % | 24.8 | % | 26.4 | % | |||||||||||||||||||||
| 07/23/02 | 09/20/02 | Synopsys Inc | inSilicon Corp | 4.05 | 2.45 | 2.45 | 2.53 | 65.3 | % | 65.3 | % | 60.1 | % | |||||||||||||||||||||
| 07/26/02 | 02/28/03 | Samuel J Heyman | International Specialty Prods | 10.30 | 9.88 | 10.13 | 7.70 | 4.3 | % | 1.7 | % | 33.8 | % | |||||||||||||||||||||
| 07/26/02 | 02/07/03 | Valhi Inc | Tremont Corp | 65.21 | 33.20 | 30.39 | 29.80 | 96.4 | % | 114.6 | % | 118.8 | % | |||||||||||||||||||||
| 08/01/02 | 09/09/02 | Four Seasons Health Care Ltd | Omega Worldwide Inc | 3.32 | 2.20 | 2.05 | 2.00 | 50.9 | % | 62.0 | % | 66.0 | % | |||||||||||||||||||||
| 08/08/02 | 12/31/02 | Banknorth Group Inc | Warren Bancorp Inc | 15.75 | 10.56 | 12.25 | 12.20 | 49.1 | % | 28.6 | % | 29.1 | % | |||||||||||||||||||||
| 08/12/02 | 09/13/02 | NRT Inc | DeWolfe Cos Inc | 19.00 | 9.11 | 8.90 | 12.60 | 108.6 | % | 113.5 | % | 50.8 | % | |||||||||||||||||||||
| 08/19/02 | 11/01/02 | Berkshire Hathaway Inc | CTB International Corp | 12.75 | 14.67 | 14.73 | 12.46 | -13.1 | % | -13.4 | % | 2.3 | % | |||||||||||||||||||||
| 08/29/02 | 01/29/03 | RBC Centura Banks Inc | Admiralty Bancorp Inc | 26.00 | 23.32 | 22.99 | 21.00 | 11.5 | % | 13.1 | % | 23.8 | % | |||||||||||||||||||||
| 09/25/02 | 12/13/02 | KeyCorp | Union Bankshares Ltd | 22.63 | 13.75 | 13.00 | 13.00 | 64.6 | % | 74.1 | % | 74.1 | % | |||||||||||||||||||||
| 10/09/02 | 01/07/03 | Borland Software Corp | Starbase Corp | 2.75 | 0.80 | 0.76 | 0.83 | 243.8 | % | 261.4 | % | 231.3 | % | |||||||||||||||||||||
| 10/21/02 | 01/08/03 | King Pharmaceuticals Inc | Meridian Medical Technologies | 44.50 | 38.15 | 36.77 | 29.49 | 16.6 | % | 21.0 | % | 50.9 | % | |||||||||||||||||||||
| 10/22/02 | 12/13/02 | Microsoft Corp | Vicinity Corp | 3.33 | 2.24 | 2.24 | 2.23 | 48.7 | % | 48.7 | % | 49.3 | % | |||||||||||||||||||||
| 10/24/02 | 12/02/02 | DRS Technologies Inc | Paravant Inc | 4.75 | 3.60 | 3.50 | 3.71 | 31.9 | % | 35.7 | % | 28.0 | % | |||||||||||||||||||||
| 11/04/02 | 02/05/03 | SHPS Inc | Ebenx Inc | 4.85 | 1.97 | 1.65 | 1.67 | 146.2 | % | 193.9 | % | 190.4 | % | |||||||||||||||||||||
| 11/08/02 | 02/28/03 | Chittenden Corp | Granite State Bankshares | 46.00 | 36.88 | 35.40 | 31.38 | 24.7 | % | 29.9 | % | 46.6 | % | |||||||||||||||||||||
| 11/08/02 | 01/21/03 | Investor Group | Prophet 21 Inc | 16.30 | 13.00 | 12.00 | 9.16 | 25.4 | % | 35.8 | % | 77.9 | % | |||||||||||||||||||||
| 11/11/02 | 02/03/03 | Hyseq Pharmaceuticals Inc | Variagenics Inc | 2.22 | 0.96 | 1.04 | 0.74 | 131.3 | % | 113.6 | % | 200.0 | % | |||||||||||||||||||||
| 11/12/02 | 12/19/02 | Berwind Co LLC | Hunt Corp | 12.50 | 9.45 | 9.53 | 9.10 | 32.3 | % | 31.2 | % | 37.4 | % | |||||||||||||||||||||
| 11/14/02 | 02/10/03 | Johnson & Johnson | OraPharma Inc | 7.41 | 7.25 | 4.44 | 4.83 | 2.2 | % | 66.9 | % | 53.4 | % | |||||||||||||||||||||
| 11/21/02 | 03/06/03 | H Lundbeck A/S | Synaptic Pharmaceutical Corp | 6.50 | 6.00 | 4.00 | 4.01 | 8.3 | % | 62.5 | % | 62.1 | % | |||||||||||||||||||||
| 12/05/02 | 03/03/03 | Dun & Bradstreet Corp | Hoovers Inc | 7.00 | 5.29 | 5.58 | 5.14 | 32.3 | % | 25.4 | % | 36.2 | % | |||||||||||||||||||||
| 01/13/03 | 03/01/03 | Synopsys Inc | Numerical Technologies Inc | 7.00 | 3.70 | 3.70 | 3.10 | 89.2 | % | 89.2 | % | 125.8 | % | |||||||||||||||||||||
| 01/21/03 | 03/03/03 | Forrester Research Inc | Giga Information Group Inc | 4.75 | 1.56 | 1.73 | 1.55 | 204.5 | % | 174.6 | % | 206.5 | % | |||||||||||||||||||||
| Average: | 43.2 | % | 51.6 | % | 57.7 | % | ||||||||||||||||||||||||||||
| Median: | 32.3 | % | 36.5 | % | 46.6 | % | ||||||||||||||||||||||||||||
| Low: | -34.8 | % | -28.1 | % | -40.9 | % | ||||||||||||||||||||||||||||
| High: | 243.8 | % | 261.4 | % | 231.3 | % | ||||||||||||||||||||||||||||
| Rodman & Renshaw, Inc. | 8 of 18 |
Lexent Inc.
Premiums Paid Analysis — Comparable Industry
| Transaction Date | Stock Price Before Announcement | Premium Paid | ||||||||||||||||||||||||||||||||
| Transaction | ||||||||||||||||||||||||||||||||||
| Announced | Effective | Acquiror | Target | Price | 1 Day | Week | 4 Weeks | 1 Day | Week | 4 Weeks | ||||||||||||||||||||||||
| 01/18/99 | 06/30/99 | Vodafone Group PLC | AirTouch Communications Inc | $ | 97.52 | $ | 69.38 | $ | 64.94 | $ | 56.88 | 40.6 | % | 50.2 | % | 71.5 | % | |||||||||||||||||
| 01/29/99 | 04/19/00 | New England Electric System | Eastern Utilities Associates | 31.43 | 30.00 | 28.63 | 28.25 | 4.8 | % | 9.8 | % | 11.3 | % | |||||||||||||||||||||
| 02/01/99 | 05/21/99 | America Online Inc | MovieFone Inc | 29.25 | 25.00 | 21.25 | 16.50 | 17.0 | % | 37.6 | % | 77.3 | % | |||||||||||||||||||||
| 02/17/99 | 02/10/00 | SCANA Corp | PSNC | 33.00 | 22.75 | 22.75 | 25.00 | 45.1 | % | 45.1 | % | 32.0 | % | |||||||||||||||||||||
| 03/04/99 | 12/29/00 | UtiliCorp United Inc | St Joseph Light & Power Co | 24.15 | 16.88 | 17.00 | 17.13 | 43.1 | % | 42.1 | % | 41.0 | % | |||||||||||||||||||||
| 03/15/99 | 10/25/99 | El Paso Energy Corp | Sonat Inc | 35.75 | 30.06 | 25.75 | 25.62 | 18.9 | % | 38.8 | % | 39.5 | % | |||||||||||||||||||||
| 03/17/99 | 09/28/99 | Global Crossing Ltd | Frontier Corp | 49.20 | 44.63 | 38.63 | 34.75 | 10.3 | % | 27.4 | % | 41.6 | % | |||||||||||||||||||||
| 03/23/99 | 05/27/99 | ServiceMaster Co | American Residential Services | 5.75 | 4.38 | 3.38 | 3.44 | 31.4 | % | 70.4 | % | 67.3 | % | |||||||||||||||||||||
| 03/25/99 | 08/18/00 | Northern States Power Co | New Century Energies Inc | 42.24 | 38.69 | 39.00 | 41.25 | 9.2 | % | 8.3 | % | 2.4 | % | |||||||||||||||||||||
| 04/23/99 | 02/08/00 | Energy East Corp | Connecticut Energy | 42.00 | 31.31 | 28.00 | 25.44 | 34.1 | % | 50.0 | % | 65.1 | % | |||||||||||||||||||||
| 05/03/99 | 08/24/99 | Investor Group | Cellular Commun of Puerto Rico | 29.50 | 23.75 | 26.13 | 27.50 | 24.2 | % | 12.9 | % | 7.3 | % | |||||||||||||||||||||
| 05/05/99 | 10/29/99 | Thermo Electron Corp | Thermo Power Corp | 12.00 | 11.38 | 12.19 | 8.50 | 5.5 | % | -1.5 | % | 41.2 | % | |||||||||||||||||||||
| 05/18/99 | 10/05/99 | Metromedia International Group | PLD Telekom Inc | 2.74 | 2.75 | 2.75 | 2.75 | -0.4 | % | -0.4 | % | -0.4 | % | |||||||||||||||||||||
| 05/21/99 | 07/30/99 | Tandy Corp | AmeriLink Corp | 15.34 | 10.88 | 9.94 | 7.13 | 41.1 | % | 54.4 | % | 115.3 | % | |||||||||||||||||||||
| 05/25/99 | 04/07/00 | Investor Group | TNP Enterprises Inc | 44.00 | 34.94 | 32.94 | 32.00 | 25.9 | % | 33.6 | % | 37.5 | % | |||||||||||||||||||||
| 05/28/99 | 10/01/99 | MCI WorldCom | SkyTel Communications Inc | 19.97 | 19.31 | 20.06 | 17.13 | 3.4 | % | -0.5 | % | 16.6 | % | |||||||||||||||||||||
| 06/01/99 | 01/07/00 | Yorkshire Water PLC | Aquarion Co | 37.05 | 31.06 | 28.94 | 26.56 | 19.3 | % | 28.0 | % | 39.5 | % | |||||||||||||||||||||
| 06/01/99 | 01/14/00 | Liberty Media Group | Associated Group Inc | 67.47 | 65.00 | 65.25 | 57.88 | 3.8 | % | 3.4 | % | 16.6 | % | |||||||||||||||||||||
| 06/02/99 | 09/23/99 | Westwood One Inc | Metro Networks Inc | 52.50 | 55.50 | 57.00 | 50.06 | -5.4 | % | -7.9 | % | 4.9 | % | |||||||||||||||||||||
| 06/07/99 | 11/04/99 | Southern Union Co | Pennsylvania Enterprises Inc | 35.00 | 29.69 | 29.00 | 25.88 | 17.9 | % | 20.7 | % | 35.3 | % | |||||||||||||||||||||
| 06/11/99 | 03/31/00 | Indiana Energy Inc | SIGCORP Inc | 30.08 | 29.50 | 30.00 | 30.00 | 2.0 | % | 0.3 | % | 0.3 | % | |||||||||||||||||||||
| 06/14/99 | 06/30/00 | Qwest Commun Int Inc | US WEST Inc | 82.47 | 62.25 | 54.94 | 55.06 | 32.5 | % | 50.1 | % | 49.8 | % | |||||||||||||||||||||
| 06/15/99 | 09/01/00 | Energy East Corp | CMP Group Inc | 29.50 | 20.06 | 20.56 | 20.75 | 47.0 | % | 43.5 | % | 42.2 | % | |||||||||||||||||||||
| 06/15/99 | 03/01/00 | Northeast Utilities | Yankee Energy System Inc | 45.00 | 32.50 | 30.63 | 29.63 | 38.5 | % | 46.9 | % | 51.9 | % | |||||||||||||||||||||
| 06/23/99 | 02/28/00 | VoiceStream Wireless Corp | Omnipoint Corp | 32.23 | 20.75 | 18.00 | 17.63 | 55.3 | % | 79.1 | % | 82.9 | % | |||||||||||||||||||||
| 06/28/99 | 04/26/00 | Wisconsin Energy Corp | WICOR Inc | 31.50 | 26.56 | 24.38 | 25.50 | 18.6 | % | 29.2 | % | 23.5 | % | |||||||||||||||||||||
| 06/30/99 | 09/01/00 | Energy East Corp | CTG Resources Inc | 41.00 | 35.63 | 32.94 | 26.94 | 15.1 | % | 24.5 | % | 52.2 | % | |||||||||||||||||||||
| 07/15/99 | 11/08/00 | Eastern Enterprises | EnergyNorth Inc | 47.00 | 29.69 | 29.63 | 28.63 | 58.3 | % | 58.6 | % | 64.2 | % | |||||||||||||||||||||
| 07/19/99 | 01/06/00 | AirTouch Cellular | CommNet Cellular Inc | 31.00 | 30.25 | 32.06 | 21.43 | 2.5 | % | -3.3 | % | 44.7 | % | |||||||||||||||||||||
| 07/21/99 | 11/09/99 | Cincinnati Bell Inc | IXC Communications Inc | 49.43 | 36.25 | 37.31 | 42.00 | 36.4 | % | 32.5 | % | 17.7 | % | |||||||||||||||||||||
| 08/13/99 | 09/22/99 | Hochtief AG | Turner Corp | 28.63 | 25.31 | 27.00 | 21.25 | 13.1 | % | 6.0 | % | 34.7 | % | |||||||||||||||||||||
| 08/22/99 | 11/29/00 | Carolina Power & Light Co | Florida Progress Corp | 54.00 | 44.63 | 42.63 | 41.75 | 21.0 | % | 26.7 | % | 29.3 | % | |||||||||||||||||||||
| 08/23/99 | 11/23/99 | PSINet Inc | Transaction Network Services | 45.28 | 34.25 | 28.00 | 28.93 | 32.2 | % | 61.7 | % | 56.5 | % | |||||||||||||||||||||
| 08/23/99 | 07/27/00 | Suez Lyonnaise des Eaux SA | United Water Resources Inc | 35.00 | 31.06 | 24.13 | 23.19 | 12.7 | % | 45.1 | % | 50.9 | % | |||||||||||||||||||||
| 08/27/99 | 12/08/99 | Viatel Inc | Destia Communications Inc | 18.63 | 13.93 | 10.81 | 10.59 | 33.7 | % | 72.3 | % | 75.9 | % | |||||||||||||||||||||
| 09/20/99 | 05/01/00 | VoiceStream Wireless Corp | Aerial Communications Inc | 25.51 | 20.00 | 18.69 | 15.00 | 27.6 | % | 36.5 | % | 70.1 | % | |||||||||||||||||||||
| 09/23/99 | 10/20/00 | PECO Energy Co | Unicom Corp | 33.90 | 37.06 | 38.88 | 39.38 | -8.5 | % | -12.8 | % | -13.9 | % | |||||||||||||||||||||
| 10/05/99 | 05/31/01 | DTE Energy Co | MCN Energy Group Inc | 28.68 | 17.69 | 17.06 | 18.13 | 62.1 | % | 68.1 | % | 58.2 | % | |||||||||||||||||||||
| 10/25/99 | 03/14/00 | Investor Group | MidAmerican Energy Holdings Co | 35.05 | 27.25 | 27.63 | 28.94 | 28.6 | % | 26.9 | % | 21.1 | % | |||||||||||||||||||||
| 11/04/99 | 11/08/00 | KeySpan Corp | Eastern Enterprises | 64.00 | 51.56 | 50.38 | 48.25 | 24.1 | % | 27.0 | % | 32.6 | % | |||||||||||||||||||||
| 11/08/99 | 11/10/00 | Arch Communications Group Inc | PageNet | 0.85 | 0.97 | 1.09 | 0.75 | -12.3 | % | -22.3 | % | 13.3 | % | |||||||||||||||||||||
| Rodman & Renshaw, Inc. | 9 of 18 |
Lexent Inc.
Premiums Paid Analysis — Comparable Industry
| Transaction Date | Stock Price Before Announcement | Premium Paid | ||||||||||||||||||||||||||||||||
| Transaction | ||||||||||||||||||||||||||||||||||
| Announced | Effective | Acquiror | Target | Price | 1 Day | Week | 4 Weeks | 1 Day | Week | 4 Weeks | ||||||||||||||||||||||||
| 11/15/99 | 09/28/00 | Southern Union Co | Providence Energy Corp | 42.50 | 32.88 | 31.31 | 27.88 | 29.3 | % | 35.7 | % | 52.5 | % | |||||||||||||||||||||
| 11/22/99 | 11/29/00 | Thames Water PLC | E'town Corp | 68.00 | 51.88 | 52.00 | 45.63 | 31.1 | % | 30.8 | % | 49.0 | % | |||||||||||||||||||||
| 12/01/99 | 09/20/00 | Southern Union Co | Valley Resources Inc | 25.00 | 20.50 | 18.94 | 14.25 | 22.0 | % | 32.0 | % | 75.4 | % | |||||||||||||||||||||
| 12/13/99 | 02/09/00 | Mail.com Inc | NetMoves | 9.87 | 5.50 | 5.06 | 3.94 | 79.5 | % | 95.0 | % | 150.7 | % | |||||||||||||||||||||
| 12/22/99 | 04/26/00 | GPU Inc | MYR Group Inc | 30.10 | 21.00 | 20.63 | 18.88 | 43.3 | % | 45.9 | % | 59.5 | % | |||||||||||||||||||||
| 01/10/00 | 06/19/00 | NextLink Communications Inc | Concentric Network Corp | 45.00 | 30.00 | 31.63 | 25.00 | 50.0 | % | 42.3 | % | 80.0 | % | |||||||||||||||||||||
| 01/18/00 | 01/29/01 | El Paso Energy Corp | Coastal Corp | 45.66 | 36.00 | 34.13 | 33.44 | 26.8 | % | 33.8 | % | 36.6 | % | |||||||||||||||||||||
| 01/31/00 | 08/15/00 | Thermo Electron Corp | Thermo Ecotek | 7.00 | 6.25 | 5.75 | 5.19 | 12.0 | % | 21.7 | % | 34.9 | % | |||||||||||||||||||||
| 01/31/00 | 08/25/00 | Standard Pacific Corp | Writer Corp | 3.35 | 2.25 | 1.91 | 1.50 | 48.9 | % | 75.8 | % | 123.3 | % | |||||||||||||||||||||
| 02/17/00 | 05/02/00 | Lennar Corp | US Home Corp | 36.00 | 24.88 | 25.25 | 27.06 | 44.7 | % | 42.6 | % | 33.0 | % | |||||||||||||||||||||
| 02/28/00 | 11/01/00 | NiSource Inc | Columbia Energy Group | 72.60 | 57.06 | 59.94 | 65.00 | 27.2 | % | 21.1 | % | 11.7 | % | |||||||||||||||||||||
| 02/28/00 | 12/11/00 | PowerGen PLC | LG&E Energy Corp | 24.85 | 15.75 | 15.69 | 17.00 | 57.8 | % | 58.4 | % | 46.2 | % | |||||||||||||||||||||
| 02/29/00 | 11/13/00 | TeleCorp PCS Inc | Tritel Inc | 41.04 | 24.00 | 23.63 | 26.94 | 71.0 | % | 73.7 | % | 52.4 | % | |||||||||||||||||||||
| 03/13/00 | 06/22/00 | Coachmen Industries Inc | Mod U Kraf Homes Inc | 11.75 | 5.50 | 5.50 | 5.88 | 113.6 | % | 113.6 | % | 100.0 | % | |||||||||||||||||||||
| 03/20/00 | 11/29/00 | RMI.NET Inc | Internet Communications Corp | 0.42 | 3.56 | 4.00 | 2.94 | -88.2 | % | -89.5 | % | -85.7 | % | |||||||||||||||||||||
| 06/29/00 | 10/01/00 | Infrastrux Group Inc | Utilx Corp | 6.13 | 4.38 | 4.63 | 4.06 | 40.1 | % | 32.5 | % | 50.9 | % | |||||||||||||||||||||
| 06/30/00 | 10/10/01 | NS Power Hldg Inc | Bangor Hydro-Electric Co | 26.81 | 15.00 | 15.25 | 15.13 | 78.7 | % | 75.8 | % | 77.3 | % | |||||||||||||||||||||
| 07/17/00 | 03/27/01 | AES Corp | IPALCO Enterprises Inc | 25.00 | 21.50 | 21.38 | 19.94 | 16.3 | % | 17.0 | % | 25.4 | % | |||||||||||||||||||||
| 07/24/00 | 05/31/01 | Deutsche Telekom AG | VoiceStream Wireless Corp | 93.96 | 124.94 | 117.06 | 116.87 | -24.8 | % | -19.7 | % | -19.6 | % | |||||||||||||||||||||
| 08/08/00 | 11/06/01 | FirstEnergy Corp | GPU Inc | 36.50 | 30.70 | 26.69 | 28.19 | 18.9 | % | 36.8 | % | 29.5 | % | |||||||||||||||||||||
| 08/24/00 | 12/22/00 | Bracknell Corp | Able Telcom Holding Corp | 2.52 | 3.38 | 2.50 | 2.75 | -25.3 | % | 0.8 | % | -8.4 | % | |||||||||||||||||||||
| 08/27/00 | 05/31/01 | VoiceStream Wireless Corp | Powertel Inc | 106.01 | 86.63 | 83.06 | 86.06 | 22.4 | % | 27.6 | % | 23.2 | % | |||||||||||||||||||||
| 08/28/00 | 01/24/01 | Hovnanian Enterprises Inc | Washington Homes Inc | 10.08 | 7.13 | 7.25 | 6.50 | 41.5 | % | 39.0 | % | 55.1 | % | |||||||||||||||||||||
| 09/05/00 | 07/01/01 | WorldCom Inc | Intermedia Communications Inc | 16.19 | 22.88 | 20.88 | 19.44 | -29.2 | % | -22.4 | % | -16.7 | % | |||||||||||||||||||||
| 09/05/00 | 01/31/02 | National Grid Group PLC | Niagara Mohawk Holdings Inc | 19.00 | 13.88 | 12.75 | 14.00 | 36.9 | % | 49.0 | % | 35.7 | % | |||||||||||||||||||||
| 10/02/00 | 04/25/01 | Genesis Malaysia Maju Fund | Vialog Corp | 7.19 | 8.81 | 7.88 | 8.19 | -18.4 | % | -8.7 | % | -12.2 | % | |||||||||||||||||||||
| 10/03/00 | 12/07/00 | McLeodUSA Inc | CapRock Communications Corp | 5.06 | 5.06 | 5.53 | 5.44 | 0.0 | % | -8.5 | % | -6.9 | % | |||||||||||||||||||||
| 10/12/00 | 12/31/00 | Technical Olympic USA Inc | Engle Homes Inc | 19.10 | 15.75 | 15.63 | 15.75 | 21.3 | % | 22.2 | % | 21.3 | % | |||||||||||||||||||||
| 10/27/00 | 03/16/01 | Enron Corp | Azurix Corp | 8.38 | 3.56 | 3.56 | 3.58 | 135.2 | % | 135.2 | % | 134.2 | % | |||||||||||||||||||||
| 11/03/00 | 04/02/01 | Cendant Corp | Fairfield Communities Inc | 16.00 | 13.94 | 12.50 | 10.56 | 14.8 | % | 28.0 | % | 51.5 | % | |||||||||||||||||||||
| 02/12/01 | 08/01/02 | Potomac Electric Power Company | Conectiv Inc | 25.00 | 21.00 | 18.82 | 18.38 | 19.0 | % | 32.8 | % | 36.1 | % | |||||||||||||||||||||
| 02/20/01 | 06/28/02 | Energy East Corp | RGS Energy Group | 39.37 | 33.10 | 33.10 | 30.06 | 18.9 | % | 18.9 | % | 31.0 | % | |||||||||||||||||||||
| 03/16/01 | 05/11/01 | Enbridge Inc | Midcoast Energy Resources Inc | 27.00 | 25.20 | 26.25 | 22.60 | 7.1 | % | 2.9 | % | 19.5 | % | |||||||||||||||||||||
| 04/27/01 | 07/09/01 | TransWestern Publishing Co LLC | WorldPages.com Inc | 3.00 | 2.20 | 2.35 | 1.85 | 36.4 | % | 27.7 | % | 62.2 | % | |||||||||||||||||||||
| 05/01/01 | 07/31/01 | Pulte Homes Inc | Del Webb Corp | 41.82 | 33.80 | 30.80 | 30.50 | 23.7 | % | 35.8 | % | 37.1 | % | |||||||||||||||||||||
| 09/17/01 | 01/10/03 | RWE AG | American Water Works Co Inc | 46.00 | 32.74 | 33.43 | 31.14 | 40.5 | % | 37.6 | % | 47.7 | % | |||||||||||||||||||||
| 09/24/01 | 12/12/01 | VeriSign Inc | Illuminet Holdings Inc | 35.62 | 34.98 | 34.06 | 31.48 | 1.8 | % | 4.6 | % | 13.2 | % | |||||||||||||||||||||
| 09/27/01 | 02/19/02 | Reliant Resources Inc | Orion Power Holdings Inc | 26.80 | 19.20 | 17.65 | 22.40 | 39.6 | % | 51.8 | % | 19.6 | % | |||||||||||||||||||||
| 10/08/01 | 02/15/02 | AT&T Wireless Services Inc | TeleCorp PCS Inc | 14.51 | 10.04 | 10.01 | 13.01 | 44.5 | % | 45.0 | % | 11.5 | % | |||||||||||||||||||||
| 10/23/01 | 02/22/02 | DR Horton Inc | Schuler Homes Inc | 21.96 | 12.00 | 11.82 | 12.11 | 83.0 | % | 85.8 | % | 81.3 | % | |||||||||||||||||||||
| 11/07/01 | 01/07/02 | UtiliCorp United Inc | Aquila Inc | 20.69 | 17.99 | 18.35 | 24.65 | 15.0 | % | 12.8 | % | -16.1 | % | |||||||||||||||||||||
| Rodman & Renshaw, Inc. | 10 of 18 |
Lexent Inc.
Premiums Paid Analysis — Comparable Industry
| Transaction Date | Stock Price Before Announcement | Premium Paid | ||||||||||||||||||||||||||||||||
| Transaction | ||||||||||||||||||||||||||||||||||
| Announced | Effective | Acquiror | Target | Price | 1 Day | Week | 4 Weeks | 1 Day | Week | 4 Weeks | ||||||||||||||||||||||||
| 11/21/01 | 05/24/02 | D&E Communications Inc | Conestoga Enterprises Inc | 33.00 | 24.50 | 23.76 | 24.10 | 34.7 | % | 38.9 | % | 36.9 | % | |||||||||||||||||||||
| 01/07/02 | 02/27/02 | Dycom Industries Inc | Arguss Communications Inc | 5.76 | 4.42 | 4.06 | 3.76 | 30.3 | % | 41.9 | % | 53.2 | % | |||||||||||||||||||||
| 01/10/02 | 02/21/02 | US RealTel Inc | Cypress Communications Inc | 3.50 | 1.99 | 1.86 | 1.50 | 75.9 | % | 88.2 | % | 133.3 | % | |||||||||||||||||||||
| 01/30/02 | 04/17/02 | Beazer Homes USA | Crossmann Communities Inc | 46.48 | 30.23 | 30.99 | 33.00 | 53.8 | % | 50.0 | % | 40.8 | % | |||||||||||||||||||||
| 02/15/02 | 06/03/02 | Xcel Energy Inc | NRG Energy Inc | 12.86 | 10.00 | 9.60 | 13.27 | 28.6 | % | 34.0 | % | -3.1 | % | |||||||||||||||||||||
| Average: | 27.4 | % | 32.9 | % | 40.1 | % | ||||||||||||||||||||||||||||
| Median: | 26.8 | % | 33.6 | % | 37.5 | % | ||||||||||||||||||||||||||||
| Low: | -88.2 | % | -89.5 | % | -85.7 | % | ||||||||||||||||||||||||||||
| High: | 135.2 | % | 135.2 | % | 150.7 | % | ||||||||||||||||||||||||||||
| Rodman & Renshaw, Inc. | 11 of 18 |
Lexent Inc.
Premiums Paid Analysis — Majority Shareholder Acquiror
| Transaction Date | Stock Price Before Announcement | Premium Paid | ||||||||||||||||||||||||||||||||
| Transaction | ||||||||||||||||||||||||||||||||||
| Announced | Effective | Acquiror | Target | Price | 1 Day | Week | 4 Weeks | 1 Day | Week | 4 Weeks | ||||||||||||||||||||||||
| 02/24/99 | 05/21/99 | Investor Group | Industrial Scientific | $ | 28.50 | $ | 20.50 | $ | 20.38 | $ | 20.50 | 39.0 | % | 39.9 | % | 39.0 | % | |||||||||||||||||
| 03/08/99 | 12/01/99 | Investor Group | ENStar Inc | 12.50 | 8.00 | 7.88 | 8.25 | 56.3 | % | 58.7 | % | 51.5 | % | |||||||||||||||||||||
| 03/09/99 | 06/30/99 | Kerr-McGee Corp | Sun Energy Partners LP | 5.75 | 4.06 | 4.00 | 3.81 | 41.6 | % | 43.8 | % | 50.9 | % | |||||||||||||||||||||
| 03/21/99 | 07/01/99 | Viacom Inc | Spelling Entertainment Group | 9.75 | 9.00 | 6.81 | 6.31 | 8.3 | % | 43.2 | % | 54.5 | % | |||||||||||||||||||||
| 03/24/99 | 11/04/99 | Warburg, Pincus Ventures Inc | Knoll Inc | 28.00 | 15.25 | 18.44 | 19.13 | 83.6 | % | 51.9 | % | 46.4 | % | |||||||||||||||||||||
| 04/01/99 | 08/15/99 | Vivendi SA | Aqua Alliance Inc | 2.90 | 2.25 | 2.44 | 1.44 | 28.9 | % | 19.0 | % | 101.7 | % | |||||||||||||||||||||
| 04/12/99 | 06/30/99 | Investor Group | Meadowcraft Inc | 10.00 | 6.06 | 6.13 | 5.63 | 64.9 | % | 63.3 | % | 77.8 | % | |||||||||||||||||||||
| 04/29/99 | 08/09/99 | Killearn Inc | Killearn Properties Inc | 5.50 | 5.00 | 5.00 | 5.13 | 10.0 | % | 10.0 | % | 7.3 | % | |||||||||||||||||||||
| 05/05/99 | 10/29/99 | Thermo Electron Corp | Thermo Power Corp | 12.00 | 11.38 | 12.19 | 8.50 | 5.5 | % | -1.5 | % | 41.2 | % | |||||||||||||||||||||
| 05/07/99 | 07/30/99 | McDermott International Inc | J Ray McDermott SA | 35.62 | 30.50 | 31.50 | 29.87 | 16.8 | % | 13.1 | % | 19.3 | % | |||||||||||||||||||||
| 05/21/99 | 12/10/99 | Thermo Instrument Systems Inc | ThermoSpectra | 16.00 | 11.50 | 11.13 | 9.94 | 39.1 | % | 43.8 | % | 61.0 | % | |||||||||||||||||||||
| 07/13/99 | 01/07/00 | Thermo Instrument Systems Inc | Thermo Vision | 7.00 | 4.00 | 4.38 | 3.38 | 75.0 | % | 60.0 | % | 107.4 | % | |||||||||||||||||||||
| 10/20/99 | 06/06/00 | Thermo Electron Corp | Thermoretec Corp | 7.00 | 5.50 | 5.25 | 5.19 | 27.3 | % | 33.3 | % | 34.9 | % | |||||||||||||||||||||
| 11/05/99 | 11/05/99 | Discount Investment Corp | PEC Israel Economic Corp | 36.50 | 36.44 | 36.13 | 35.50 | 0.2 | % | 1.0 | % | 2.8 | % | |||||||||||||||||||||
| 11/16/99 | 09/22/00 | Thermo Electron Corp | Thermo TerraTech Inc | 6.00 | 7.13 | 6.63 | 5.38 | -15.8 | % | -9.4 | % | 11.6 | % | |||||||||||||||||||||
| 12/01/99 | 04/19/00 | Boise Cascade Corp | Boise Cascade Office Products | 16.50 | 11.50 | 10.63 | 10.31 | 43.5 | % | 55.3 | % | 60.0 | % | |||||||||||||||||||||
| 12/08/99 | 06/19/00 | Heico Companies LLC | Robertson-Ceco Corp | 11.50 | 7.88 | 8.00 | 8.13 | 46.0 | % | 43.8 | % | 41.5 | % | |||||||||||||||||||||
| 12/15/99 | 08/15/00 | Thermo Electron Corp | ThermoLase Corp | 2.73 | 2.38 | 2.13 | 1.88 | 14.9 | % | 28.5 | % | 45.6 | % | |||||||||||||||||||||
| 12/17/99 | 08/15/00 | Thermo Electron Corp | ThermoTrex Corp | 8.26 | 8.75 | 8.31 | 8.00 | -5.6 | % | -0.6 | % | 3.3 | % | |||||||||||||||||||||
| 01/19/00 | 04/19/00 | Metropolitan Life Insurance Co | Conning Corp | 12.50 | 10.81 | 9.00 | 8.22 | 15.6 | % | 38.9 | % | 52.1 | % | |||||||||||||||||||||
| 01/31/00 | 05/03/00 | Thermo Instrument Systems Inc | Metrika Systems Corp | 9.00 | 9.63 | 9.00 | 6.13 | -6.5 | % | 0.0 | % | 46.9 | % | |||||||||||||||||||||
| 01/31/00 | 04/13/00 | Thermo Instrument Systems Inc | ONIX Systems Inc | 9.00 | 8.75 | 7.75 | 6.50 | 2.9 | % | 16.1 | % | 38.5 | % | |||||||||||||||||||||
| 01/31/00 | 04/12/00 | Thermedics | Thermedics Detection Inc | 8.00 | 7.94 | 7.94 | 7.00 | 0.8 | % | 0.8 | % | 14.3 | % | |||||||||||||||||||||
| 01/31/00 | 04/20/00 | Thermo Instrument Systems Inc | Thermo BioAnalysis | 28.00 | 18.50 | 18.00 | 18.25 | 51.4 | % | 55.6 | % | 53.4 | % | |||||||||||||||||||||
| 01/31/00 | 05/12/00 | Thermo Instrument Systems Inc | Thermo Optek Corp | 15.00 | 14.06 | 15.81 | 10.63 | 6.7 | % | -5.1 | % | 41.2 | % | |||||||||||||||||||||
| 01/31/00 | 04/04/00 | Thermedics | Thermo Sentron Inc | 15.50 | 14.44 | 14.50 | 14.50 | 7.4 | % | 6.9 | % | 6.9 | % | |||||||||||||||||||||
| 01/31/00 | 05/12/00 | Thermo Instrument Systems Inc | ThermoQuest Corp | 17.00 | 12.50 | 11.56 | 10.50 | 36.0 | % | 47.0 | % | 61.9 | % | |||||||||||||||||||||
| 01/31/00 | 06/30/00 | Thermo Electron Corp | Thermedics | 10.80 | 6.13 | 5.81 | 5.31 | 76.3 | % | 85.8 | % | 103.3 | % | |||||||||||||||||||||
| 02/02/00 | 06/30/00 | Thermo Electron Corp | Thermo Instrument Systems Inc | 20.40 | 16.06 | 15.31 | 10.50 | 27.0 | % | 33.2 | % | 94.3 | % | |||||||||||||||||||||
| 03/14/00 | 06/20/00 | Alcoa Inc | Howmet International Inc | 21.00 | 18.50 | 18.63 | 18.38 | 13.5 | % | 12.8 | % | 14.3 | % | |||||||||||||||||||||
| 03/17/00 | 09/15/00 | BP Amoco PLC | Vastar Resources Inc | 83.00 | 71.44 | 61.50 | 49.00 | 16.2 | % | 35.0 | % | 69.4 | % | |||||||||||||||||||||
| 03/23/00 | 06/08/00 | Security Capital Group Inc | Homestead Village Inc | 4.10 | 2.75 | 2.63 | 2.06 | 49.1 | % | 56.2 | % | 98.8 | % | |||||||||||||||||||||
| 03/27/00 | 06/27/00 | Hartford Fin Svcs Group Inc | Hartford Life | 50.50 | 42.56 | 36.00 | 35.25 | 18.6 | % | 40.3 | % | 43.3 | % | |||||||||||||||||||||
| 04/24/00 | 07/17/00 | Investor Group | Cherry Corp | 26.40 | 13.00 | 12.63 | 15.50 | 103.1 | % | 109.1 | % | 70.3 | % | |||||||||||||||||||||
| 05/04/00 | 12/31/00 | Intermountain Industries | Petroglyph Energy Inc | 2.85 | 2.00 | 1.38 | 1.63 | 42.5 | % | 107.3 | % | 75.4 | % | |||||||||||||||||||||
| 07/09/00 | 09/14/00 | Invitrogen Corp | Life Technologies Inc | 60.00 | 49.00 | 49.00 | 50.00 | 22.4 | % | 22.4 | % | 20.0 | % | |||||||||||||||||||||
| 07/20/00 | 11/17/00 | Kennametal Inc | JLK Direct Distribution Inc | 8.75 | 5.88 | 4.50 | 5.19 | 48.9 | % | 94.4 | % | 68.7 | % | |||||||||||||||||||||
| 07/27/00 | 09/13/00 | Investor Group | Brookdale Living Communities | 15.25 | 15.00 | 14.88 | 14.56 | 1.7 | % | 2.5 | % | 4.7 | % | |||||||||||||||||||||
| 08/14/00 | 07/13/01 | News Corp Ltd | BHC Communications Inc | 165.00 | 141.75 | 145.50 | 150.00 | 16.4 | % | 13.4 | % | 10.0 | % | |||||||||||||||||||||
| 08/15/00 | 02/21/01 | Viacom Inc | Infinity Broadcasting Corp | 32.89 | 35.25 | 37.44 | 35.38 | -6.7 | % | -12.1 | % | -7.0 | % | |||||||||||||||||||||
| 08/30/00 | 01/03/01 | AXA Group | AXA Financial Inc | 54.63 | 52.25 | 49.75 | 40.69 | 4.6 | % | 9.8 | % | 34.3 | % | |||||||||||||||||||||
| 09/01/00 | 12/18/00 | Minolta Investments Co | Minolta-QMS Inc | 6.00 | 3.00 | 3.00 | 3.06 | 100.0 | % | 100.0 | % | 95.9 | % | |||||||||||||||||||||
| Rodman & Renshaw, Inc. | 12 of 18 |
Lexent Inc.
Premiums Paid Analysis — Majority Shareholder Acquiror
| Transaction Date | Stock Price Before Announcement | Premium Paid | ||||||||||||||||||||||||||||||||
| Transaction | ||||||||||||||||||||||||||||||||||
| Announced | Effective | Acquiror | Target | Price | 1 Day | Week | 4 Weeks | 1 Day | Week | 4 Weeks | ||||||||||||||||||||||||
| 09/21/00 | 03/09/01 | Ford Motor Co | Hertz Corp | 35.50 | 24.25 | 24.88 | 31.69 | 46.4 | % | 42.7 | % | 12.0 | % | |||||||||||||||||||||
| 10/25/00 | 07/31/01 | Investor Group | Uno Restaurant Corp | 9.75 | 7.31 | 6.06 | 6.81 | 33.3 | % | 60.8 | % | 43.1 | % | |||||||||||||||||||||
| 10/27/00 | 03/16/01 | Enron Corp | Azurix Corp | 8.38 | 3.56 | 3.56 | 3.58 | 135.2 | % | 135.2 | % | 134.2 | % | |||||||||||||||||||||
| 11/10/00 | 01/31/01 | HCH Acquisition Corp | Holt's Cigar Holding Inc | 5.50 | 3.50 | 3.81 | 3.56 | 57.1 | % | 44.3 | % | 54.4 | % | |||||||||||||||||||||
| 12/14/00 | 08/31/01 | O Gene Bicknell | NPC International Inc | 11.55 | 10.38 | 10.81 | 8.75 | 11.3 | % | 6.8 | % | 32.0 | % | |||||||||||||||||||||
| 12/20/00 | 04/12/01 | Vitamin Shoppe Industries Inc | Vitaminshoppe.com Inc | 1.00 | 0.31 | 0.47 | 0.38 | 220.0 | % | 113.3 | % | 166.7 | % | |||||||||||||||||||||
| 01/16/01 | 12/01/01 | Investor Group | Leslie Fay Co Inc | 5.00 | 2.88 | 2.81 | 3.13 | 73.9 | % | 77.8 | % | 60.0 | % | |||||||||||||||||||||
| 02/15/01 | 09/28/01 | Westfield America Trust | Westfield America Inc | 16.25 | 14.45 | 14.55 | 14.19 | 12.5 | % | 11.7 | % | 14.5 | % | |||||||||||||||||||||
| 03/26/01 | 08/21/01 | Credit Suisse First Boston | CSFBdirect | 6.00 | 2.50 | 2.97 | 3.45 | 140.0 | % | 102.0 | % | 73.9 | % | |||||||||||||||||||||
| 05/09/01 | 07/26/02 | Investor Group | Pierre Foods Inc | 2.50 | 1.63 | 0.97 | 1.00 | 53.8 | % | 158.1 | % | 150.0 | % | |||||||||||||||||||||
| 05/14/01 | 10/31/01 | Seneca Investments LLC | Agency.com Ltd | 3.35 | 2.05 | 2.31 | 1.28 | 63.4 | % | 45.0 | % | 161.7 | % | |||||||||||||||||||||
| 05/23/01 | 09/28/01 | Electronic Data Systems Corp | Unigraphics Solutions Inc | 32.50 | 21.25 | 19.25 | 17.98 | 52.9 | % | 68.8 | % | 80.8 | % | |||||||||||||||||||||
| 05/30/01 | 09/06/01 | Bacou SA | Bacou USA Inc | 28.50 | 23.40 | 24.30 | 25.60 | 21.8 | % | 17.3 | % | 11.3 | % | |||||||||||||||||||||
| 06/06/01 | 12/13/01 | Liberty Mutual Insurance Co | Liberty Financial Cos Inc | 33.70 | 27.00 | 24.06 | 24.00 | 24.8 | % | 40.1 | % | 40.4 | % | |||||||||||||||||||||
| 08/01/01 | 01/18/02 | Dwain Neumann | National Home Centers Inc | 1.40 | 1.11 | 1.16 | 1.05 | 26.1 | % | 20.7 | % | 33.3 | % | |||||||||||||||||||||
| 08/16/01 | 01/24/03 | Northwest Bancorp | Leeds Federal Bankshares Inc | 32.00 | 16.40 | 16.75 | 16.35 | 95.1 | % | 91.0 | % | 95.7 | % | |||||||||||||||||||||
| 08/21/01 | 02/26/02 | Thermo Electron Corp | Spectra Physics Inc | 17.50 | 13.69 | 17.61 | 19.00 | 27.8 | % | -0.6 | % | -7.9 | % | |||||||||||||||||||||
| 09/13/01 | 12/28/01 | MRV Communications Inc | Luminent Inc | 1.26 | 1.35 | 1.20 | 2.70 | -6.7 | % | 5.0 | % | -53.3 | % | |||||||||||||||||||||
| 10/01/01 | 02/13/02 | Investor Group | NCH Corp | 52.50 | 39.19 | 39.30 | 44.20 | 34.0 | % | 33.6 | % | 18.8 | % | |||||||||||||||||||||
| 10/12/01 | 03/15/02 | Liberty Media Corp | Liberty Digital | 3.23 | 2.93 | 3.13 | 4.49 | 10.2 | % | 3.2 | % | -28.1 | % | |||||||||||||||||||||
| 11/07/01 | 01/07/02 | UtiliCorp United Inc | Aquila Inc | 20.69 | 17.99 | 18.35 | 24.65 | 15.0 | % | 12.8 | % | -16.1 | % | |||||||||||||||||||||
| 02/04/02 | 03/21/02 | Limited Inc | Intimate Brands Inc | 19.72 | 17.90 | 16.72 | 15.81 | 10.2 | % | 17.9 | % | 24.7 | % | |||||||||||||||||||||
| 02/15/02 | 06/03/02 | Xcel Energy Inc | NRG Energy Inc | 12.86 | 10.00 | 9.60 | 13.27 | 28.6 | % | 34.0 | % | -3.1 | % | |||||||||||||||||||||
| 02/19/02 | 04/11/02 | Sabre Holdings Corp | Travelocity.com Inc | 28.00 | 19.20 | 19.96 | 22.86 | 45.8 | % | 40.3 | % | 22.5 | % | |||||||||||||||||||||
| 03/04/02 | 06/28/02 | IOS Brands Corp | FTD.COM INC | 3.35 | 9.00 | 8.74 | 7.79 | -62.8 | % | -61.7 | % | -57.0 | % | |||||||||||||||||||||
| 03/08/02 | 04/16/02 | Lufthansa Technik AG | Hawker Pacific Aerospace | 3.25 | 3.17 | 3.15 | 2.59 | 2.5 | % | 3.2 | % | 25.5 | % | |||||||||||||||||||||
| 03/18/02 | 09/13/02 | Network Associates Inc | McAfee.com Corp | 15.43 | 15.54 | 17.40 | 16.25 | -0.7 | % | -11.3 | % | -5.0 | % | |||||||||||||||||||||
| 04/18/02 | 02/21/03 | Investor Group | Partsbase Inc | 1.50 | 1.10 | 1.04 | 0.77 | 36.4 | % | 44.2 | % | 94.8 | % | |||||||||||||||||||||
| 05/16/02 | 08/19/02 | IPC Advisors SARL | Balanced Care Corp | 0.25 | 0.10 | 0.09 | 0.10 | 150.0 | % | 177.8 | % | 150.0 | % | |||||||||||||||||||||
| 05/31/02 | 01/17/03 | USA Interactive | Ticketmaster | 15.85 | 21.50 | 22.00 | 22.03 | -26.3 | % | -28.0 | % | -28.1 | % | |||||||||||||||||||||
| 07/26/02 | 02/07/03 | Valhi Inc | Tremont Corp | 65.21 | 33.20 | 30.39 | 29.80 | 96.4 | % | 114.6 | % | 118.8 | % | |||||||||||||||||||||
| 08/14/02 | 12/31/02 | First Banks Inc | First Banks America Inc | 40.54 | 40.35 | 41.50 | 40.09 | 0.5 | % | -2.3 | % | 1.1 | % | |||||||||||||||||||||
| 08/20/02 | 10/31/02 | Union Oil Co of California | Pure Resources Inc | 21.48 | 17.80 | 16.91 | 17.55 | 20.7 | % | 27.0 | % | 22.4 | % | |||||||||||||||||||||
| Average: | 35.7 | % | 38.8 | % | 45.5 | % | ||||||||||||||||||||||||||||
| Median: | 27.0 | % | 34.0 | % | 41.2 | % | ||||||||||||||||||||||||||||
| Low: | -62.8 | % | -61.7 | % | -57.0 | % | ||||||||||||||||||||||||||||
| High: | 220.0 | % | 177.8 | % | 166.7 | % | ||||||||||||||||||||||||||||
| Rodman & Renshaw, Inc. | 13 of 18 |
Lexent Inc.
Discounted Cash Flow
| 2002 | 2003E | 2004E | 2005E | 2006E | 2007E | ||||||||||||||||||||
| Net income | $ | (11,763 | ) | $ | (4,765 | ) | $ | (1,069 | ) | $ | 1,540 | $ | 1,958 | ||||||||||||
| Adjustments | |||||||||||||||||||||||||
| Depreciation | 2,455 | 1,095 | 1,096 | 759 | 780 | ||||||||||||||||||||
| Non-cash stock based compensation | 3,036 | — | — | — | — | ||||||||||||||||||||
| Loss of deposit | (2,012 | ) | — | — | — | — | |||||||||||||||||||
| Changes in working capital | 17,302 | (530 | ) | (948 | ) | (716 | ) | (358 | ) | ||||||||||||||||
| Capital expenditure | (600 | ) | (800 | ) | (1,000 | ) | (1,000 | ) | (1,000 | ) | |||||||||||||||
| Debt repayment | (2,105 | ) | (394 | ) | — | — | — | ||||||||||||||||||
| Payments from restructuring | (4,053 | ) | (1,400 | ) | (1,200 | ) | (740 | ) | (750 | ) | |||||||||||||||
| Long-term incentive compensation | 600 | 600 | 600 | 600 | — | ||||||||||||||||||||
| Total adjustments | 14,623 | (1,429 | ) | (1,452 | ) | (1,097 | ) | (1,328 | ) | ||||||||||||||||
| Net cash flow from operations | 2,860 | (6,194 | ) | (2,521 | ) | 443 | 630 | ||||||||||||||||||
| Terminal value: | |||||||||||||||||||||||||
| 2007 EBITDA | 1,517 | ||||||||||||||||||||||||
| EV/EBITDA multiple | 5.4 | ||||||||||||||||||||||||
| Projected EV | 8,241 | ||||||||||||||||||||||||
| Less restructuring reserve | (2,446 | ) | |||||||||||||||||||||||
| Less incentive comp. | (3,000 | ) | |||||||||||||||||||||||
| Equity value | 2,795 | ||||||||||||||||||||||||
| Total cash flows | $ | 72,411 | $ | 2,860 | $ | (6,194 | ) | $ | (2,521 | ) | $ | 443 | $ | 3,425 | |||||||||||
| Low | High | |||||||
| Discount rate | 25.0 | % | 15.0 | % | ||||
| Equity value | $ | 70,748 | $ | 70,513 | ||||
| Price per share | $ | 1.66 | $ | 1.66 | ||||
| Rodman & Renshaw, Inc. | 14 of 18 |
Lexent Inc.
Liquidation Value
| February 28. 2003 | ||||||||||||||||||||
| Low | High | |||||||||||||||||||
| Book | ||||||||||||||||||||
| Value | % | Value | % | Value | ||||||||||||||||
| Cash | $ | 69,184 | 100 | % | $ | 69,184 | 100 | % | $ | 69,184 | ||||||||||
| Certificate of deposit | 2,001 | 0 | % | — | 0 | % | — | |||||||||||||
| Accounts receivable | 22,253 | 70 | % | 15,577 | 85 | % | 18,915 | |||||||||||||
| Retention receivable | 3,032 | 70 | % | 2,122 | 85 | % | 2,577 | |||||||||||||
| Reserve for doubtful accounts | (4,805 | ) | 100 | % | (4,805 | ) | 100 | % | (4,805 | ) | ||||||||||
| Costs and est. earnings in excess of billings | 2,191 | 30 | % | 657 | 60 | % | 1,315 | |||||||||||||
| Unbilled receivables | 204 | 70 | % | 143 | 85 | % | 173 | |||||||||||||
| Costs of uncompleted jobs | 742 | 30 | % | 223 | 60 | % | 445 | |||||||||||||
| Interest receivable | 44 | 70 | % | 31 | 100 | % | 44 | |||||||||||||
| Prepaids and other current assets | 813 | 0 | % | — | 0 | % | — | |||||||||||||
| Taxes receivable | 14,750 | 100 | % | 14,750 | 100 | % | 14,750 | |||||||||||||
| Total current assets | 110,409 | 97,882 | 102,598 | |||||||||||||||||
| PP&E, net | 3,620 | 40 | % | 1,448 | 70 | % | 2,534 | |||||||||||||
| Other assets | 865 | 0 | % | — | 50 | % | 433 | |||||||||||||
| Total assets | 114,894 | 99,330 | 105,565 | |||||||||||||||||
| Less liabilities | (26,755 | ) | (26,755 | ) | (26,755 | ) | ||||||||||||||
| Net value | 88,139 | 72,575 | 78,810 | |||||||||||||||||
| Operating losses during shutdown period | — | (8,213 | ) | (8,213 | ) | |||||||||||||||
| Severance & other termination costs | — | (4,187 | ) | (4,187 | ) | |||||||||||||||
| Lease obligations, 2004 and beyond | — | (8,568 | ) | (4,284 | ) | |||||||||||||||
| Liquidation value | 88,139 | 51,607 | 62,126 | |||||||||||||||||
| Shares outstanding | 42,601 | 42,601 | 42,601 | |||||||||||||||||
Value per share | $ | 2.07 | $ | 1.21 | $ | 1.46 | ||||||||||||||
| Rodman & Renshaw, Inc. | 15 of 18 |
Lexent Inc.
Projections
| 2002 | 2003E | 2004E | 2005E | 2006E | 2007E | ||||||||||||||||||||
| Revenue: | |||||||||||||||||||||||||
| HOK | 91,821 | 82,639 | 85,118 | 87,672 | 90,302 | 93,011 | |||||||||||||||||||
| NNT | 33,784 | 3,410 | — | — | — | — | |||||||||||||||||||
| LSI | 4,177 | 10,466 | 12,036 | 13,239 | 14,563 | 15,292 | |||||||||||||||||||
| LMC | — | — | — | — | — | — | |||||||||||||||||||
| Intercompany | (5,937 | ) | — | — | — | — | — | ||||||||||||||||||
| Total | 123,845 | 96,515 | 97,154 | 100,911 | 104,865 | 108,302 | |||||||||||||||||||
| Direct costs: | |||||||||||||||||||||||||
| HOK | 83,168 | 67,764 | 68,775 | 69,787 | 70,797 | 72,920 | |||||||||||||||||||
| NNT | 29,297 | 2,796 | — | — | — | — | |||||||||||||||||||
| LSI | 3,400 | 7,850 | 9,027 | 9,930 | 10,923 | 11,469 | |||||||||||||||||||
| LMC | — | — | — | — | — | — | |||||||||||||||||||
| Corp. | (31 | ) | — | — | — | — | — | ||||||||||||||||||
| Intercompany | (5,937 | ) | — | — | — | — | — | ||||||||||||||||||
| Total | 109,897 | 78,410 | 77,802 | 79,716 | 81,719 | 84,389 | |||||||||||||||||||
| Overhead: | |||||||||||||||||||||||||
| HOK | 16,361 | 9,917 | 9,363 | 8,767 | 9,030 | 9,301 | |||||||||||||||||||
| NNT | 2,957 | 409 | — | — | — | — | |||||||||||||||||||
| LSI | 1,313 | 1,256 | 1,324 | 1,324 | 1,311 | 1,376 | |||||||||||||||||||
| LMC | — | — | — | — | — | — | |||||||||||||||||||
| Total | 20,631 | 11,582 | 10,687 | 10,091 | 10,341 | 10,677 | |||||||||||||||||||
| Gross profit: | |||||||||||||||||||||||||
| HOK | (7,708 | ) | 4,958 | 6,980 | 9,118 | 10,475 | 10,789 | ||||||||||||||||||
| NNT | 1,530 | 205 | — | — | — | — | |||||||||||||||||||
| LSI | (536 | ) | 1,361 | 1,685 | 1,986 | 2,330 | 2,447 | ||||||||||||||||||
| LMC | — | — | — | — | — | — | |||||||||||||||||||
| Corp. | 31 | — | — | — | — | — | |||||||||||||||||||
| Intercompany | — | — | — | — | — | — | |||||||||||||||||||
| Total | (6,683 | ) | 6,524 | 8,665 | 11,104 | 12,805 | 13,236 | ||||||||||||||||||
| General & administrative | 16,031 | 14,428 | 13,707 | 12,336 | 11,719 | 11,719 | |||||||||||||||||||
| EBITDA | (22,714 | ) | (7,904 | ) | (5,042 | ) | (1,232 | ) | 1,086 | 1,517 | |||||||||||||||
| Depreciation & amortization | 4,786 | 2,455 | 1,095 | 1,096 | 759 | 780 | |||||||||||||||||||
| Non-cash stock based compensation | 3,298 | 3,036 | — | — | — | — | |||||||||||||||||||
| Restructuring charges | 9,133 | — | — | — | — | — | |||||||||||||||||||
| EBIT | (39,931 | ) | (13,395 | ) | (6,137 | ) | (2,328 | ) | 327 | 737 | |||||||||||||||
| Interest expense | 245 | 60 | 9 | — | — | — | |||||||||||||||||||
| Interest income | (1,350 | ) | (1,320 | ) | (1,372 | ) | (1,259 | ) | (1,213 | ) | (1,221 | ) | |||||||||||||
| Other expense/(income), net | 3,744 | — | — | — | — | — | |||||||||||||||||||
| Impairment of goodwill | 1,514 | — | — | — | — | — | |||||||||||||||||||
| Income before taxes | (44,084 | ) | (12,135 | ) | (4,765 | ) | (1,069 | ) | 1,540 | 1,958 | |||||||||||||||
| Provision for income tax | 6,214 | (372 | ) | — | — | — | — | ||||||||||||||||||
| Net income | (50,298 | ) | (11,763 | ) | (4,765 | ) | (1,069 | ) | 1,540 | 1,958 | |||||||||||||||
| Balance sheet items: | |||||||||||||||||||||||||
| Cash & equivalents | 72,411 | 75,271 | 69,077 | 66,556 | 67,000 | 67,630 | |||||||||||||||||||
| Restricted cash | 2,012 | — | — | — | — | — | |||||||||||||||||||
| A/R | 28,311 | 24,129 | 24,288 | 25,228 | 26,216 | 27,076 | |||||||||||||||||||
| Other current assets | 16,329 | 1,579 | 1,579 | 1,579 | 1,579 | 1,579 | |||||||||||||||||||
| Current liabilities (exc. debt & restr.) | 19,033 | 17,403 | 17,033 | 17,024 | 17,297 | 17,798 | |||||||||||||||||||
| Working capital, excl. restructuring | 25,607 | 8,305 | 8,835 | 9,783 | 10,499 | 10,857 | |||||||||||||||||||
| Sub. debt & capital leases | 2,499 | 394 | — | — | — | — | |||||||||||||||||||
| Restructuring reserve | 10,589 | 6,536 | 5,136 | 3,936 | 3,196 | 2,446 | |||||||||||||||||||
| Long-term incentive compensation | 600 | 1,200 | 1,800 | 2,400 | 3,000 | 3,000 | |||||||||||||||||||
| NOL | 19,692 | 31,828 | 36,592 | 37,661 | 36,121 | 34,163 | |||||||||||||||||||
| Rodman & Renshaw, Inc. | 16 of 18 |
Lexent Inc.
Projections
| 2002 | 2003E | 2004E | 2005E | 2006E | 2007E | ||||||||||||||||||||
| Assumptions | |||||||||||||||||||||||||
| Revenue growth rates: | |||||||||||||||||||||||||
| HOK | -10.0 | % | 3.0 | % | 3.0 | % | 3.0 | % | 3.0 | % | |||||||||||||||
| NNT | -89.9 | % | -100.0 | % | 0.0 | % | 0.0 | % | 0.0 | % | |||||||||||||||
| LSI | 150.6 | % | 15.0 | % | 10.0 | % | 10.0 | % | 5.0 | % | |||||||||||||||
| LMC | #DIV/0! | 0.0 | % | 0.0 | % | 0.0 | % | 0.0 | % | ||||||||||||||||
| Intercompany revenue % of HOK & NNT | -4.7 | % | 0.0 | % | -5.0 | % | -5.0 | % | -5.0 | % | -5.0 | % | |||||||||||||
| Direct costs: | |||||||||||||||||||||||||
| HOK | 90.6 | % | 82.0 | % | 80.8 | % | 79.6 | % | 78.4 | % | 78.4 | % | |||||||||||||
| NNT | 86.7 | % | 82.0 | % | 80.8 | % | 79.6 | % | 78.4 | % | 78.4 | % | |||||||||||||
| LSI | 81.4 | % | 75.0 | % | 75.0 | % | 75.0 | % | 75.0 | % | 75.0 | % | |||||||||||||
| LMC | #DIV/0! | #DIV/0! | 40.0 | % | 40.0 | % | 40.0 | % | 40.0 | % | |||||||||||||||
| Overhead: | |||||||||||||||||||||||||
| HOK | 17.8 | % | 12.0 | % | 11.0 | % | 10.0 | % | 10.0 | % | 10.0 | % | |||||||||||||
| NNT | 8.8 | % | 12.0 | % | 11.0 | % | 10.0 | % | 10.0 | % | 10.0 | % | |||||||||||||
| LSI | 31.4 | % | 12.0 | % | 11.0 | % | 10.0 | % | 9.0 | % | 9.0 | % | |||||||||||||
| LMC | #DIV/0! | #DIV/0! | 20.0 | % | 20.0 | % | 20.0 | % | 20.0 | % | |||||||||||||||
| G&A growth rate | -10.0 | % | -5.0 | % | -10.0 | % | -5.0 | % | 0.0 | % | |||||||||||||||
| Interest expense % (prior year) | 2.4 | % | 2.4 | % | 2.4 | % | 2.4 | % | 2.4 | % | |||||||||||||||
| Interest income % (prior year) | -1.8 | % | -1.8 | % | -1.8 | % | -1.8 | % | -1.8 | % | |||||||||||||||
| Depreciation | |||||||||||||||||||||||||
| Existing PP&E | |||||||||||||||||||||||||
| Balance, beginning | 4,033 | 1,790 | 895 | 179 | — | ||||||||||||||||||||
| Depreciation | (2,243 | ) | (895 | ) | (716 | ) | (179 | ) | — | ||||||||||||||||
| Balance, ending | 1,790 | 895 | 179 | — | — | ||||||||||||||||||||
| Gross balance | 1,790 | 1,790 | 1,790 | 1,790 | |||||||||||||||||||||
| % depreciated | 50.0 | % | 40.0 | % | 10.0 | % | 0.0 | % | |||||||||||||||||
| Maintenance capex | |||||||||||||||||||||||||
| Balance, beginning | — | 540 | 1,140 | 1,760 | 2,180 | ||||||||||||||||||||
| Additions | 600 | 800 | 1,000 | 1,000 | 1,000 | ||||||||||||||||||||
| Depreciation | (60 | ) | (200 | ) | (380 | ) | (580 | ) | (780 | ) | |||||||||||||||
| Balance, ending | 540 | 1,140 | 1,760 | 2,180 | 2,400 | ||||||||||||||||||||
| Gross balance | 600 | 1,400 | 2,400 | 3,400 | 4,400 | ||||||||||||||||||||
| Depreciable life, years | 5 | 5 | 5 | 5 | 5 | ||||||||||||||||||||
| LMC capex | |||||||||||||||||||||||||
| Balance, beginning | — | — | — | — | — | ||||||||||||||||||||
| Additions | — | — | — | — | — | ||||||||||||||||||||
| Depreciation | — | — | — | — | — | ||||||||||||||||||||
| Balance, ending | — | — | — | — | — | ||||||||||||||||||||
| Gross balance | — | — | — | �� | — | — | |||||||||||||||||||
| Depreciable life, years | 20 | 20 | 20 | 20 | |||||||||||||||||||||
| Capital expenditure, maintenance | 1,019 | 600 | 800 | 1,000 | 1,000 | 1,000 | |||||||||||||||||||
| Capital expenditure, LMC | — | — | — | — | — | — | |||||||||||||||||||
| Working capital as % of sales | 20.7 | % | 8.6 | % | 8.6 | % | 8.6 | % | 8.6 | % | 8.6 | % | |||||||||||||
| Rodman & Renshaw, Inc. | 17 of 18 |
Lexent Inc.
Shutdown Operating Budget
| 3/31/2003 | 4/30/2003 | 5/31/2003 | 6/30/2003 | 7/31/2003 | 8/31/2003 | |||||||||||||||||||
Management Budget | ||||||||||||||||||||||||
| Revenue | $ | 8,043 | $ | 8,043 | $ | 8,043 | $ | 8,043 | $ | 8,043 | $ | 8,043 | ||||||||||||
| Direct costs | 6,534 | 6,534 | 6,534 | 6,534 | 6,534 | 6,534 | ||||||||||||||||||
| Overhead | 965 | 965 | 965 | 965 | 965 | 965 | ||||||||||||||||||
| Gross profit | 544 | 544 | 544 | 544 | 544 | 544 | ||||||||||||||||||
| General & administrative | 1,202 | 1,202 | 1,202 | 1,202 | 1,202 | 1,202 | ||||||||||||||||||
| EBITDA | (659 | ) | (659 | ) | (659 | ) | (659 | ) | (659 | ) | (659 | ) | ||||||||||||
| Direct costs % | 81.2 | % | 81.2 | % | 81.2 | % | 81.2 | % | 81.2 | % | 81.2 | % | ||||||||||||
| Overhead % | 12.0 | % | 12.0 | % | 12.0 | % | 12.0 | % | 12.0 | % | 12.0 | % | ||||||||||||
6 Month Shutdown Plan | ||||||||||||||||||||||||
| Revenue | $ | 8,043 | $ | 8,043 | $ | 6,032 | $ | 4,021 | $ | 2,011 | $ | — | ||||||||||||
| Direct costs | 6,534 | 6,534 | 4,901 | 3,267 | 1,634 | — | ||||||||||||||||||
| Overhead | 965 | 965 | 845 | 684 | 402 | — | ||||||||||||||||||
| Gross profit | 544 | 544 | 287 | 71 | (25 | ) | — | |||||||||||||||||
| General & administrative | 1,202 | 1,202 | 1,202 | 902 | 601 | 301 | ||||||||||||||||||
| Incremental bad debt expense | 1,206 | 1,206 | 905 | 603 | 302 | — | ||||||||||||||||||
| EBITDA | (1,865 | ) | (1,865 | ) | (1,820 | ) | (1,434 | ) | (928 | ) | (301 | ) | ||||||||||||
| Revenue, % of budget | 100.0 | % | 100.0 | % | 75.0 | % | 50.0 | % | 25.0 | % | 0.0 | % | ||||||||||||
| Direct costs % | 81.2 | % | 81.2 | % | 81.2 | % | 81.2 | % | 81.2 | % | 81.2 | % | ||||||||||||
| Overhead % | 12.0 | % | 12.0 | % | 14.0 | % | 17.0 | % | 20.0 | % | 0.0 | % | ||||||||||||
| G&A, % of budget | 100.0 | % | 100.0 | % | 100.0 | % | 75.0 | % | 50.0 | % | 25.0 | % | ||||||||||||
| Inc. bad debt expense, % of revenue | 15.0 | % | 15.0 | % | 15.0 | % | 15.0 | % | 15.0 | % | 15.0 | % | ||||||||||||
[Additional columns below]
[Continued from above table, first column(s) repeated]
| 9/30/2003 | 10/31/2003 | 11/30/2003 | 12/31/2003 | 1/31/2004 | 2/29/2004 | Total | ||||||||||||||||||||||
Management Budget | ||||||||||||||||||||||||||||
| Revenue | $ | 8,043 | $ | 8,043 | $ | 8,043 | $ | 8,043 | $ | 8,043 | $ | 8,043 | $ | 96,515 | ||||||||||||||
| Direct costs | 6,534 | 6,534 | 6,534 | 6,534 | 6,534 | 6,534 | 78,410 | |||||||||||||||||||||
| Overhead | 965 | 965 | 965 | 965 | 965 | 965 | 11,582 | |||||||||||||||||||||
| Gross profit | 544 | 544 | 544 | 544 | 544 | 544 | 6,524 | |||||||||||||||||||||
| General & administrative | 1,202 | 1,202 | 1,202 | 1,202 | 1,202 | 1,202 | 14,428 | |||||||||||||||||||||
| EBITDA | (659 | ) | (659 | ) | (659 | ) | (659 | ) | (659 | ) | (659 | ) | (7,904 | ) | ||||||||||||||
| Direct costs % | 81.2 | % | 81.2 | % | 81.2 | % | 81.2 | % | 81.2 | % | 81.2 | % | ||||||||||||||||
| Overhead % | 12.0 | % | 12.0 | % | 12.0 | % | 12.0 | % | 12.0 | % | 12.0 | % | ||||||||||||||||
6 Month Shutdown Plan | ||||||||||||||||||||||||||||
| Revenue | $ | — | $ | — | $ | — | $ | — | $ | — | $ | — | $ | 28,150 | ||||||||||||||
| Direct costs | — | — | — | — | — | — | 22,870 | |||||||||||||||||||||
| Overhead | — | — | — | — | — | — | 3,861 | |||||||||||||||||||||
| Gross profit | — | — | — | — | — | — | 1,420 | |||||||||||||||||||||
| General & administrative | — | — | — | — | — | — | 5,410 | |||||||||||||||||||||
| Incremental bad debt expense | — | — | — | — | — | — | 4,223 | |||||||||||||||||||||
| EBITDA | — | — | — | — | — | — | (8,213 | ) | ||||||||||||||||||||
| Revenue, % of budget | 0.0 | % | 0.0 | % | 0.0 | % | 0.0 | % | 0.0 | % | 0.0 | % | ||||||||||||||||
| Direct costs % | 81.2 | % | 81.2 | % | 81.2 | % | 81.2 | % | 81.2 | % | 81.2 | % | ||||||||||||||||
| Overhead % | 0.0 | % | 0.0 | % | 0.0 | % | 0.0 | % | 0.0 | % | 0.0 | % | ||||||||||||||||
| G&A, % of budget | 0.0 | % | 0.0 | % | 0.0 | % | 0.0 | % | 0.0 | % | 0.0 | % | ||||||||||||||||
| Inc. bad debt expense, % of revenue | 15.0 | % | 15.0 | % | 15.0 | % | 15.0 | % | 15.0 | % | 15.0 | % | ||||||||||||||||
| Rodman & Renshaw, Inc. | 18 of 18 |