EXHIBIT 99.2
Webcast April 18, 2017 Results of February Interim Analysis of ADAPT Trial and Perspective on Decision to Keep Trial Open
Any statements in this presentation about Argos' future expectations, plans and prospects, including statements about the ADAPT trial and the interim data from the trial, Argos' anticipated meeting with the FDA, clinical development of Argos' product candidates and future expectations and plans and prospects for Argos and other statements containing the words "believes," "anticipates," "estimates," "expects," "intends," "plans," "predicts," "projects," "targets," "may," "potential," "will," "would," "could," "should," "continue," and similar expressions, constitute forward - looking statements within the meaning of The Private Securities Litigation Reform Act of 1995 . Actual results may differ materially from those indicated by such forward - looking statements as a result of various important factors, including whether Argos' cash resources will be sufficient to fund its continuing operations for the periods anticipated ; the impact of the planned analysis of the data and discussions with the FDA on the development of R ocapuldencel - T ; the impact of the recommendation of the IDMC on the continuation of the ADAPT trial ; whether preliminary or interim clinical data such as the interim data reported in this slide presentation will be indicative of the final data from a clinical trial ; whether results obtained in clinical trials will be indicative of results obtained in future clinical trials ; whether Argos' product candidates will advance through the clinical trial process on a timely basis ; whether the results of such trials will warrant submission for approval from the United States Food and Drug Administration or equivalent foreign regulatory agencies ; whether Argos' product candidates will receive approval from regulatory agencies on a timely basis or at all ; whether, if product candidates obtain approval, they will be successfully distributed and marketed ; whether Argos can successfully establish commercial manufacturing operations on a timely basis or at all ; and other factors discussed in the "Risk Factors" section of Argos' Form 10 - K for the year ended December 31 , 2016 , which is on file with the SEC, and in other filings Argos makes with the SEC from time to time . In addition, the forward - looking statements included in this presentation represent Argos' views as of the date hereof . Argos anticipates that subsequent events and developments will cause Argos' views to change . However, while Argos may elect to update these forward - looking statements at some point in the future, Argos specifically disclaims any obligation to do so . These forward - looking statements should not be relied upon as representing Argos' views as of any date subsequent to the date hereof . 2 Forward Looking Statements
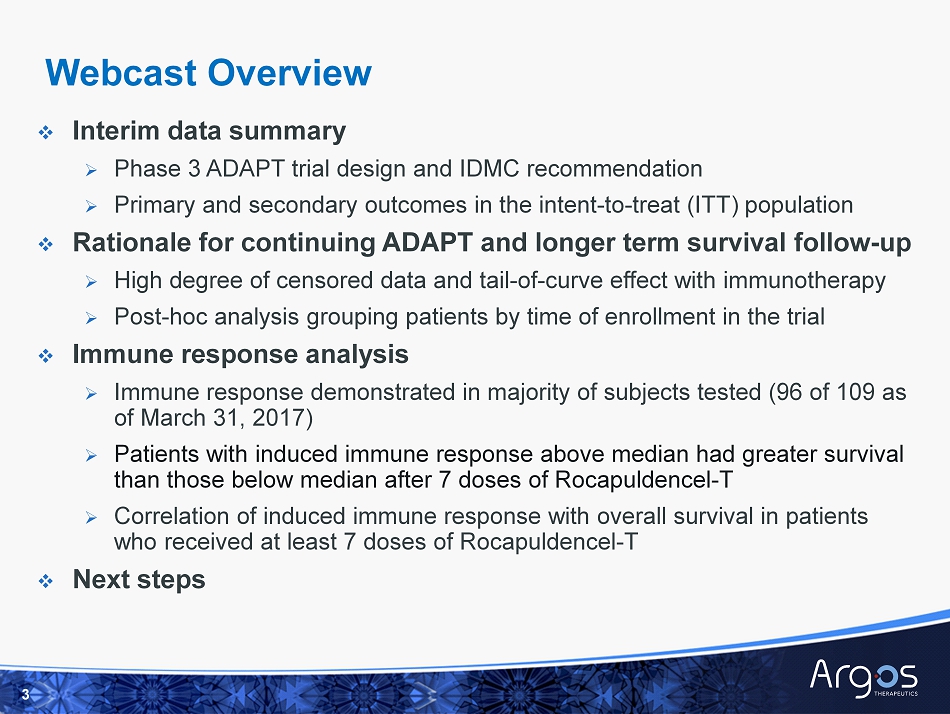
□ Interim data summary » Phase 3 ADAPT trial design and IDMC recommendation » P rimary and secondary outcomes in the intent - to - treat (ITT) population □ Rationale for continuing ADAPT and longer term survival follow - up » High degree of censored data and tail - of - curve effect with immunotherapy » Post - hoc analysis grouping patients by time of enrollment in the trial □ Immune response analysis » Immune response demonstrated in majority of subjects tested (96 of 109 as of March 31, 2017) » Patients with induced immune response above median had greater survival than those below median after 7 doses of Rocapuldencel - T » Correlation of induced immune response with overall survival in patients who received at least 7 doses of Rocapuldencel - T □ Next s teps 3 Webcast Overview
Phase 3 ADAPT Trial Design and Interim Data Summary 4
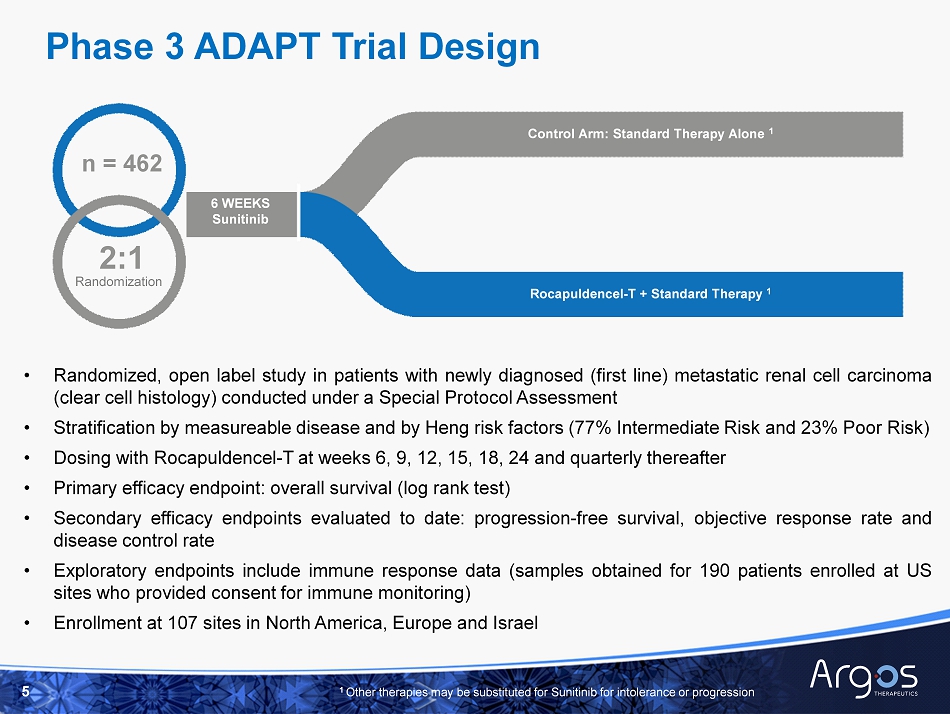
5 Phase 3 ADAPT Trial Design • Randomized, open label study in patients with newly diagnosed (first line) metastatic renal cell carcinoma (clear cell histology) conducted under a Special Protocol Assessment • Stratification by measureable disease and by Heng risk factors ( 77 % Intermediate Risk and 23 % Poor Risk) • Dosing with Rocapuldencel - T at weeks 6 , 9 , 12 , 15 , 18 , 24 and quarterly thereafter • Primary efficacy endpoint : o verall s urvival (log r ank test) • Secondary efficacy endpoints evaluated to date : progression - free survival, objective response rate and disease control rate • Exploratory endpoints include immune response data (samples obtained for 190 patients enrolled at US sites who provided consent for immune monitoring) • Enrollment at 107 sites in North America, Europe and Israel n = 462 2:1 6 WEEKS Sunitinib Control Arm: Standard Therapy Alone 1 Rocapuldencel - T + Standard Therapy 1 Randomization 1 Other therapies may be substituted for Sunitinib for intolerance or progression

Planned Analyses % Targeted # of Events (Deaths) Number of Events Interim Analysis 1 25% 72 Interim Analysis 2 50% 145 Interim Analysis 3 75% 217 Final Analysis 100% 290 □ IDMC charter established in 2012 based on assumptions regarding survival and standard statistical methodology at that time 6 □ IDMC recommendation at 3 rd interim analysis in Feb 2017: 1 » Termination of the study for futility based on analysis of the primary endpoint of o verall survival in the ITT population » No substantial evidence of harmful effects IDMC Recommendation (1) The data cut - off date for the February interim analysis was February 3, 2017
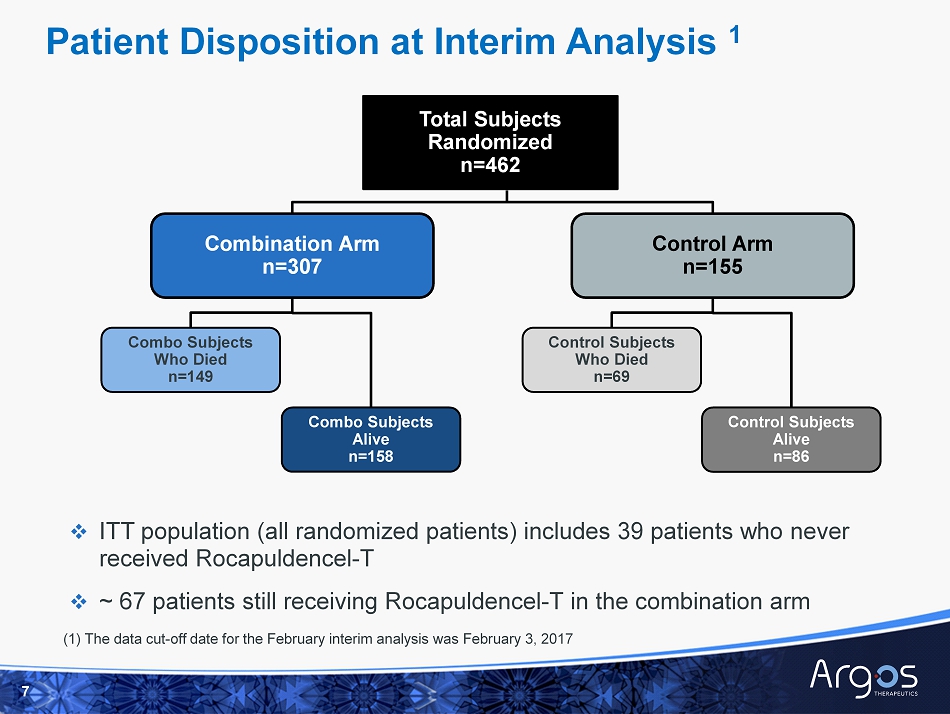
Total Subjects Randomized n =462 Combination Arm n=307 Control Arm n=155 Combo Subjects Who Died n=149 Combo Subjects Alive n=158 Control Subjects Who Died n=69 Control Subjects Alive n=86 Patient Disposition at Interim Analysis 1 □ ITT population (all randomized patients) includes 39 patients who never received Rocapuldencel - T □ ~ 67 patients still receiving Rocapuldencel - T in the combination arm (1) The data cut - off date for the February interim analysis was February 3, 2017 7
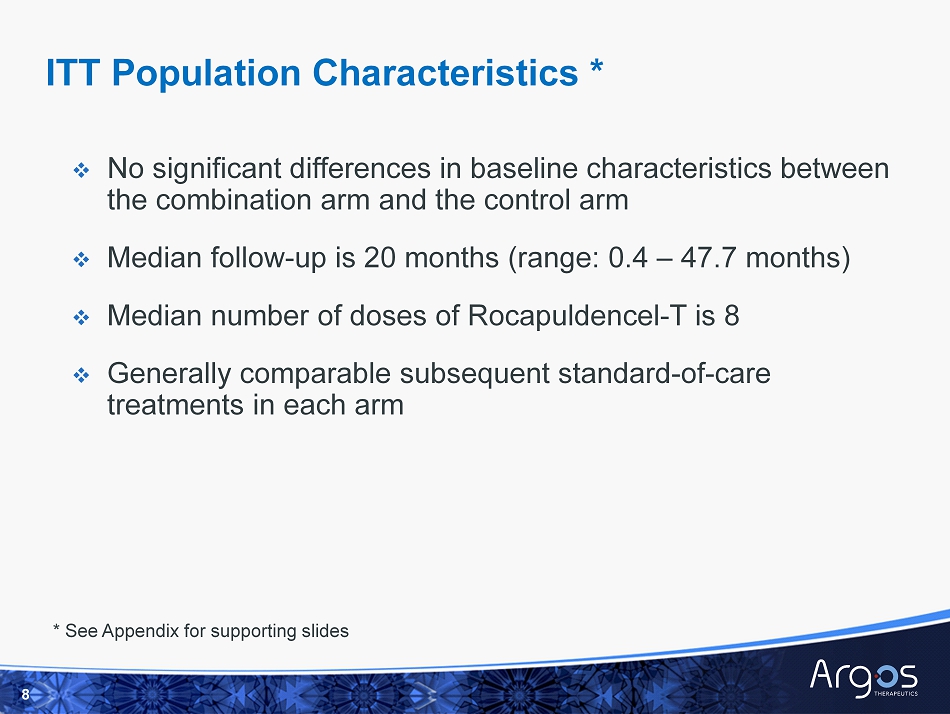
□ No significant differences in baseline characteristics between the combination arm and the control arm □ Median follow - up is 20 months (range: 0.4 – 47.7 months) □ Median number of doses of Rocapuldencel - T is 8 □ Generally comparable subsequent standard - of - care treatments in each arm 8 ITT Population Characteristics * * See Appendix for supporting slides
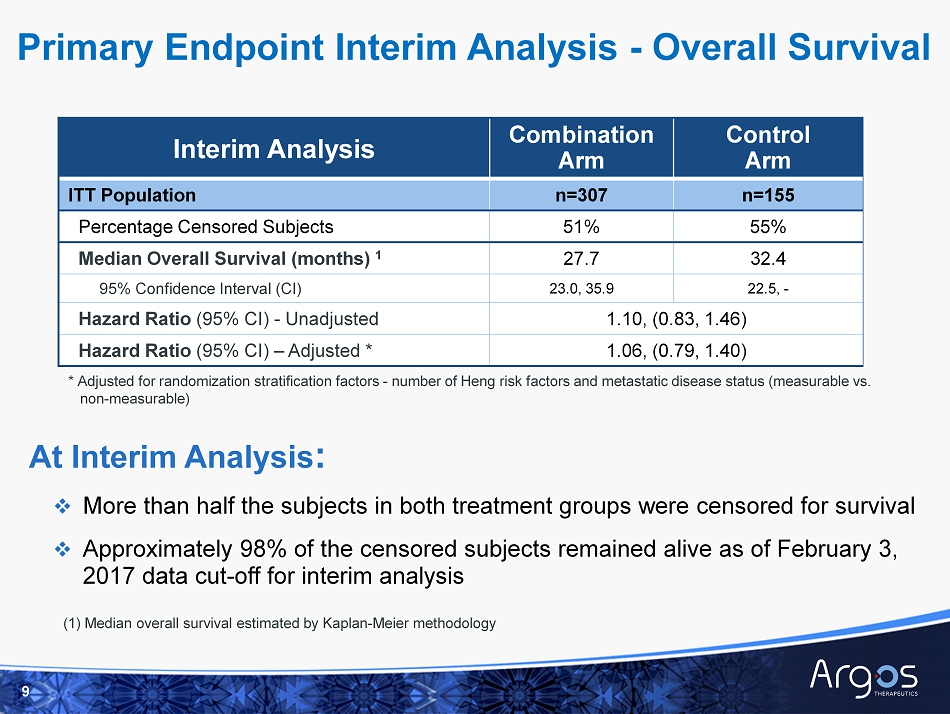
Interim Analysis Combination Arm Control Arm ITT Population n=307 n=155 Percentage Censored Subjects 51% 55% Median Overall Survival (months) 1 27.7 32.4 95% Confidence Interval (CI) 23.0, 35.9 22.5, - Hazard Ratio ( 95% CI) - Unadjusted 1.10, (0.83, 1.46) Hazard Ratio (95% CI) – Adjusted * 1.06, (0.79, 1.40) 9 At Interim Analysis : □ More than half the subjects in both treatment groups were censored for survival □ Approximately 98% of the censored subjects remained alive as of February 3, 2017 data cut - off for interim analysis * Adjusted for randomization stratification factors - number of Heng risk factors and metastatic disease status (measurable vs. non - measurable) Primary Endpoint Interim Analysis - Overall Survival (1) Median overall survival estimated by Kaplan - Meier methodology
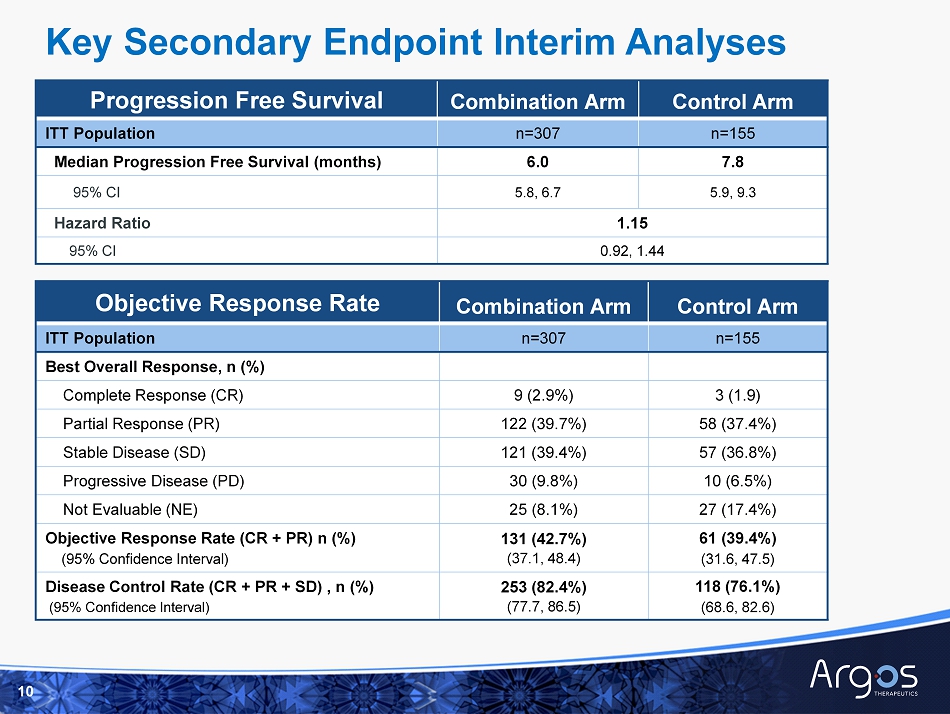
Progression Free Survival Combination Arm Control Arm ITT Population n=307 n=155 Median Progression Free Survival (months) 6.0 7.8 95% CI 5.8, 6.7 5.9, 9.3 Hazard Ratio 1.15 95% CI 0.92, 1.44 10 Objective Response Rate Combination Arm Control Arm ITT Population n=307 n=155 Best Overall Response, n (%) Complete Response (CR) 9 (2.9%) 3 (1.9) Partial Response (PR) 122 (39.7%) 58 (37.4%) Stable Disease (SD) 121 (39.4%) 57 (36.8%) Progressive Disease (PD) 30 (9.8%) 10 (6.5%) Not Evaluable (NE) 25 (8.1%) 27 (17.4%) Objective Response Rate (CR + PR) n (%) (95% Confidence Interval) 131 (42.7%) (37.1, 48.4) 61 (39.4%) (31.6, 47.5) Disease Control Rate (CR + PR + SD) , n (%) (95% Confidence Interval) 253 (82.4%) (77.7, 86.5) 118 (76.1%) (68.6, 82.6) Key Secondary Endpoint Interim Analyses
Rationale For Continuing ADAPT and Longer - Term S urvival Follow - up 11
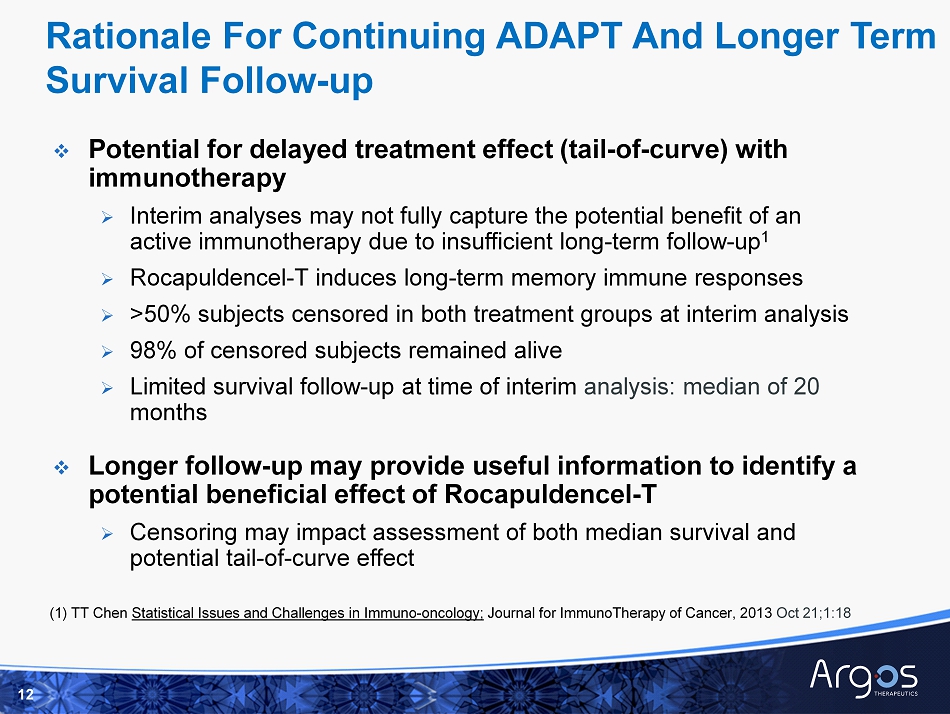
□ Potential for delayed treatment effect (tail - of - curve) with immunotherapy » Interim analyses may not fully capture the potential benefit of an active immunotherapy due to insufficient long - term follow - up 1 » Rocapuldencel - T induces long - term memory immune responses » > 50% subjects censored in both treatment groups at interim a nalysis » 98 % of censored subjects remained alive » Limited survival follow - up at time of interim a nalysis: median of 20 months □ Longer follow - up may provide useful information to identify a potential beneficial effect of Rocapuldencel - T » Censoring may impact assessment of both median survival and potential tail - of - curve effect 12 Rationale For Continuing ADAPT And Longer Term Survival Follow - up (1) TT Chen Statistical I ssues and Challenges in Immuno - oncology; Journal for ImmunoTherapy of Cancer, 2013 Oct 21;1:18
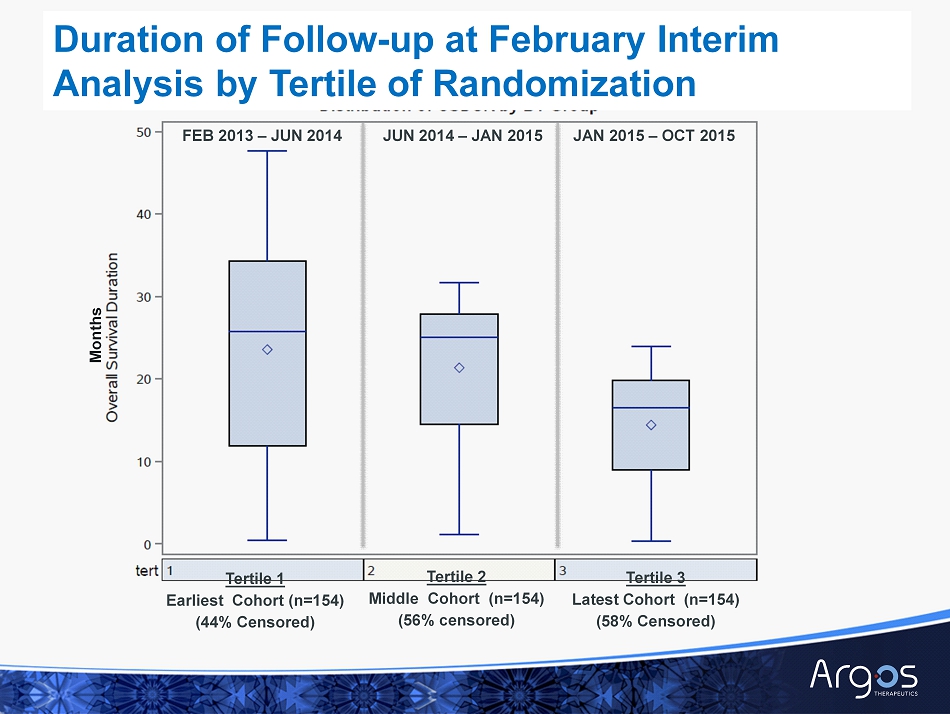
FEB 2013 – JUN 2014 Duration of Follow - up at February Interim Analysis by Tertile of Randomization Tertile 2 Middle Cohort (n=154) (56% censored) Tertile 1 Earliest Cohort (n=154) (44% Censored) JUN 2014 – JAN 2015 JAN 2015 – OCT 2015 Tertile 3 Latest Cohort (n=154) (58% Censored) Months
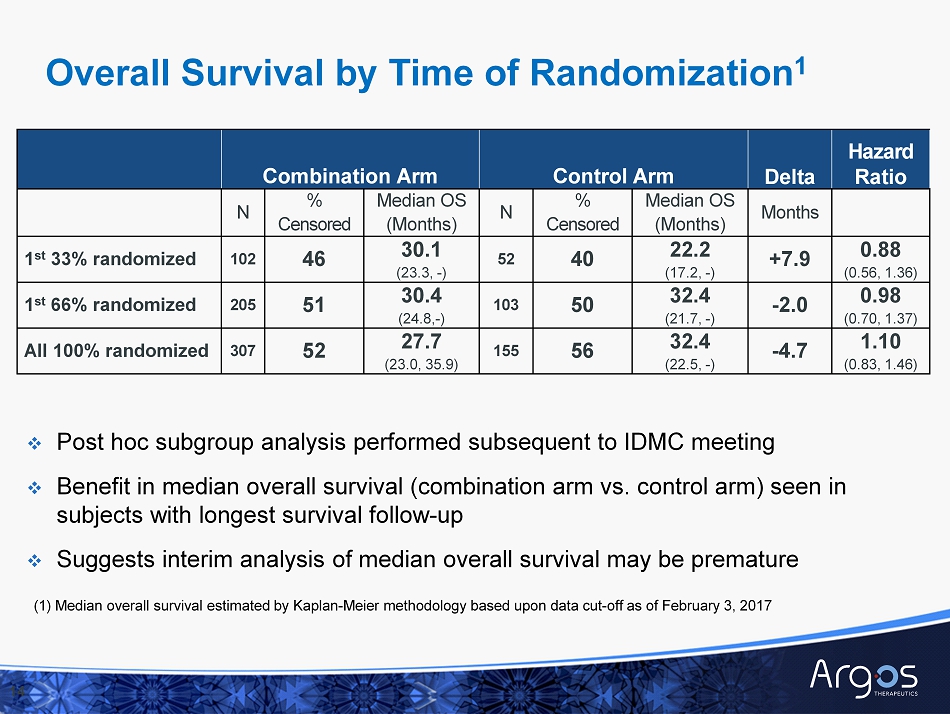
14 Combination Arm Control Arm Delta Hazard Ratio N % Censored Median OS (Months) N % Censored Median OS (Months) M onths 1 st 33 % randomized 102 46 30.1 (23.3, - ) 52 40 22.2 (17.2, - ) +7.9 0.88 (0.56, 1.36) 1 st 66 % randomized 205 51 30.4 (24.8, - ) 103 50 32.4 (21.7, - ) - 2.0 0.98 (0.70, 1.37) All 100 % randomized 307 52 27.7 (23.0, 35.9) 155 56 32.4 (22.5 , - ) - 4.7 1.10 (0.83, 1.46) □ Post hoc subgroup analysis performed subsequent to IDMC meeting □ Benefit in median overall s urvival (combination arm vs. control arm) seen in subjects with longest survival follow - up □ Suggests interim analysis of median overall s urvival may be premature Overall Survival by Time of Randomization 1 (1) Median overall survival estimated by Kaplan - Meier methodology based upon data cut - off as of February 3, 2017
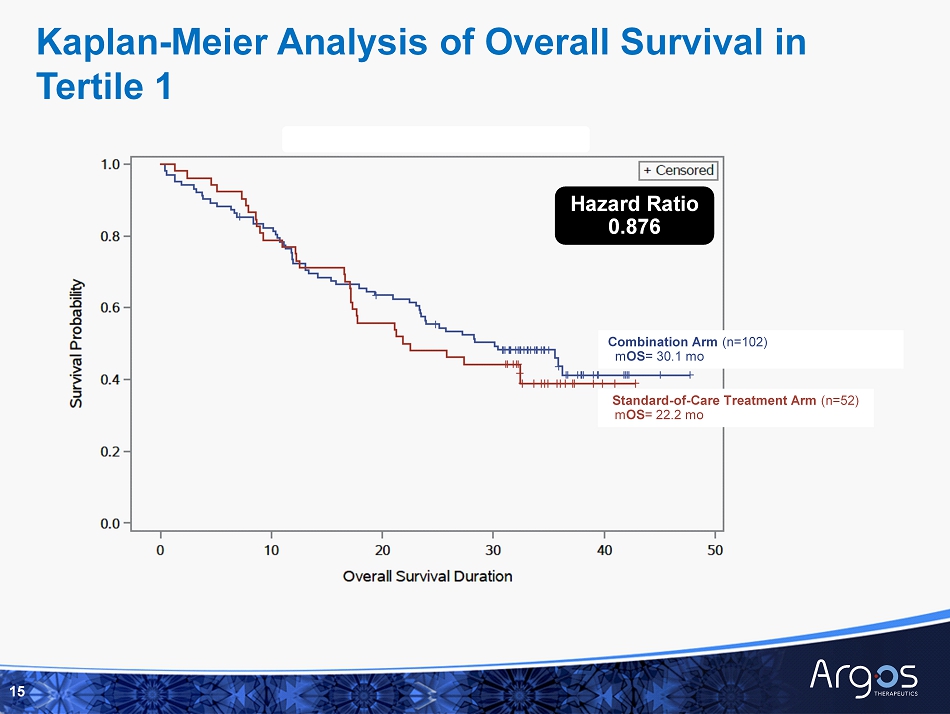
Combination Arm (n=102) m OS = 30.1 mo Standard - of - Care Treatment Arm (n=52) m OS = 22.2 mo Hazard Ratio 0.876 Kaplan - Meier Analysis of Overall Survival in Tertile 1 15
Immune Response Interim Analysis 16
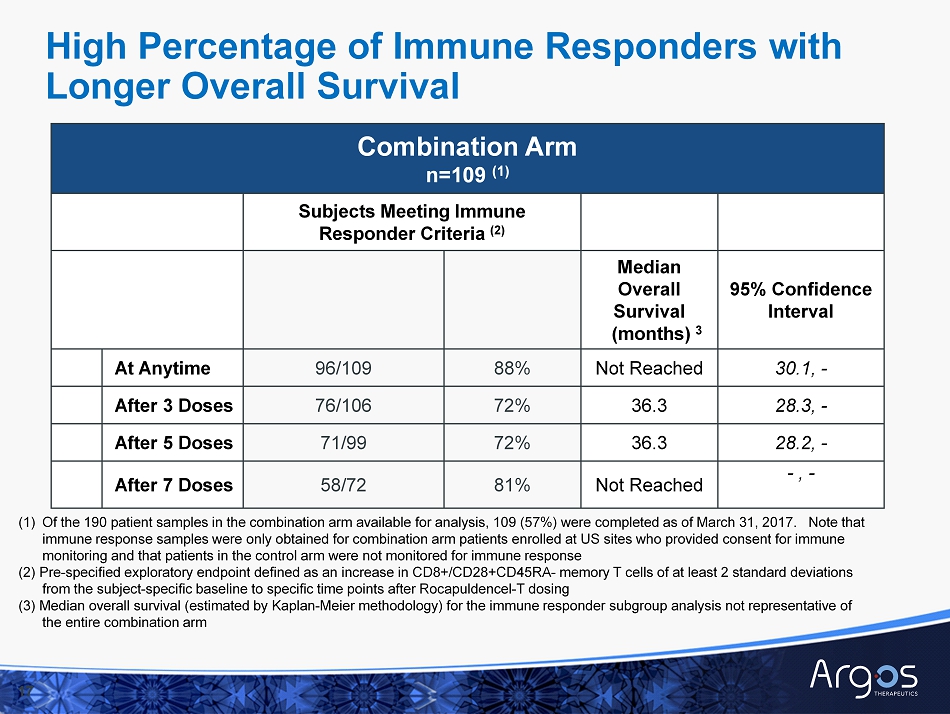
Combination Arm n=109 (1) Subjects Meeting Immune Responder Criteria (2) Median Overall Survival (months) 3 95% Confidence Interval At Anytime 96/109 88% Not Reached 30.1, - After 3 Doses 76/106 72% 36.3 28.3, - After 5 Doses 71/99 72% 36.3 28.2, - After 7 Doses 58/72 81% Not Reached - , - 17 (1) Of the 190 patient samples in the combination arm available for analysis, 109 (57%) were completed as of March 31, 2017. No te that immune response samples were only obtained for combination arm patients enrolled at US sites who provided consent for immune monitoring and that patients in the control arm were not monitored for immune response (2) Pre - specified exploratory endpoint defined as an increase in CD8+/CD28+CD45RA - memory T cells of at least 2 standard deviations from the subject - specific b aseline to specific time points after Rocapuldencel - T dosing ( 3) Median overall survival (estimated by Kaplan - Meier methodology) for the immune responder subgroup analysis not representative of the entire combination arm High Percentage of Immune Responders with Longer Overall Survival
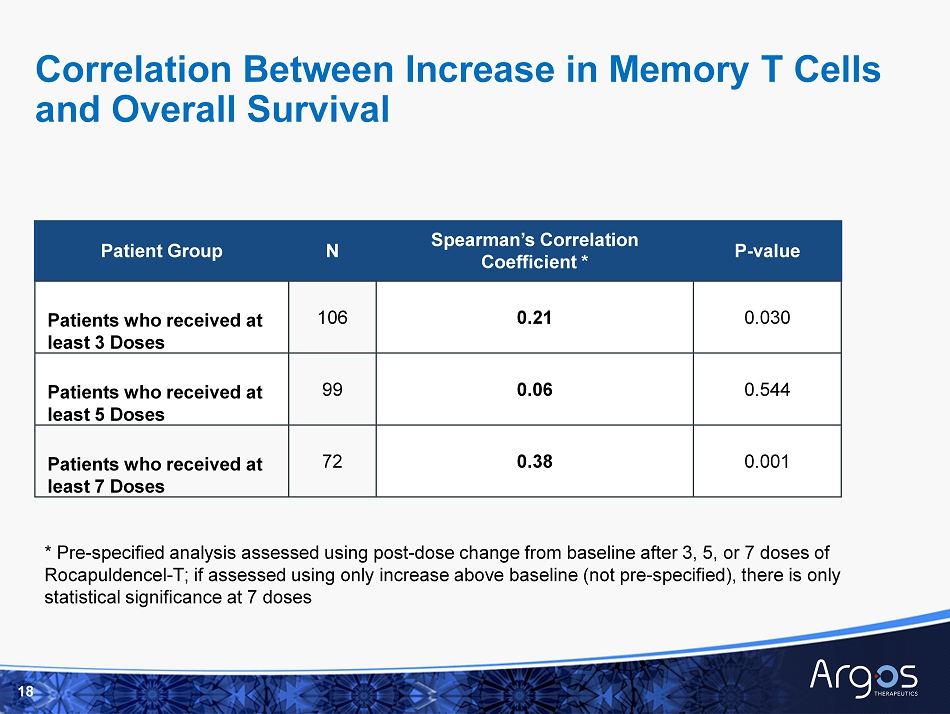
18 Patient Group N Spearman’s Correlation Coefficient * P - value Patients who received at least 3 Doses 106 0.21 0.030 Patients who received at least 5 Doses 99 0.06 0.544 Patients who received at least 7 Doses 72 0.38 0.001 * Pre - specified analysis assessed using post - dose change from baseline after 3, 5, or 7 doses of Rocapuldencel - T; if assessed using only increase above baseline (not pre - specified), there is only statistical significance at 7 doses Correlation Between Increase in Memory T Cells and Overall Survival
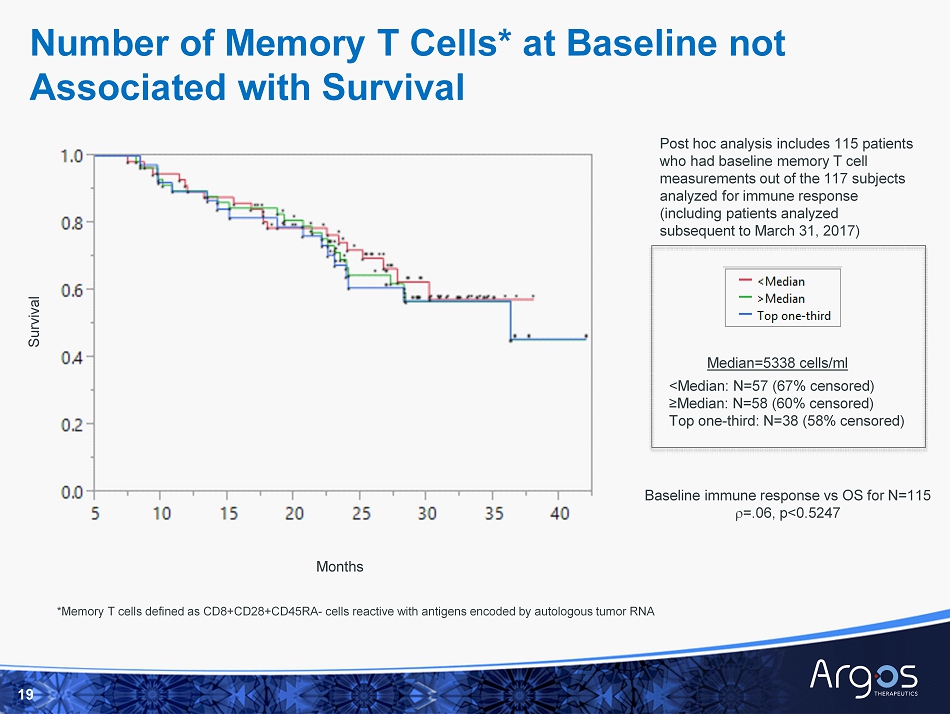
Number of Memory T Cells* at Baseline not Associated with Survival 19 <Median: N=57 (67% censored) ≥Median: N=58 (60% censored) Top one - third: N=38 (58% censored) Survival Post hoc analysis includes 115 patients who had baseline memory T cell measurements out of the 117 subjects analyzed for immune response (including patients analyzed subsequent to March 31, 2017) Baseline immune response vs OS for N=115 r =.06, p<0.5247 Median=5338 cells/ml *Memory T cells defined as CD8+CD28+CD45RA - cells reactive with antigens encoded by autologous tumor RNA Months
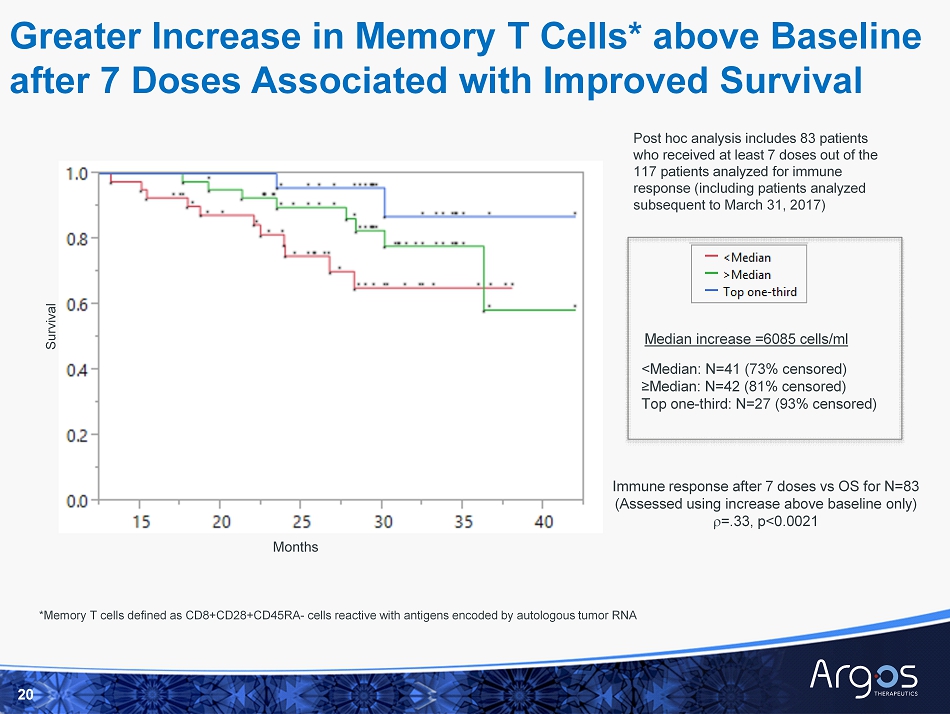
Greater Increase in Memory T Cells* above Baseline after 7 Doses Associated with Improved Survival 20 <Median: N=41 (73% censored) ≥Median: N=42 (81% censored) Top one - third: N=27 (93% censored) Post hoc analysis includes 83 patients who received at least 7 doses out of the 117 patients analyzed for immune response (including patients analyzed subsequent to March 31, 2017) Immune response after 7 doses vs OS for N=83 (Assessed using increase above baseline only) r =.33, p<0.0021 Median increase =6085 cells/ml *Memory T cells defined as CD8+CD28+CD45RA - cells reactive with antigens encoded by autologous tumor RNA Survival Months
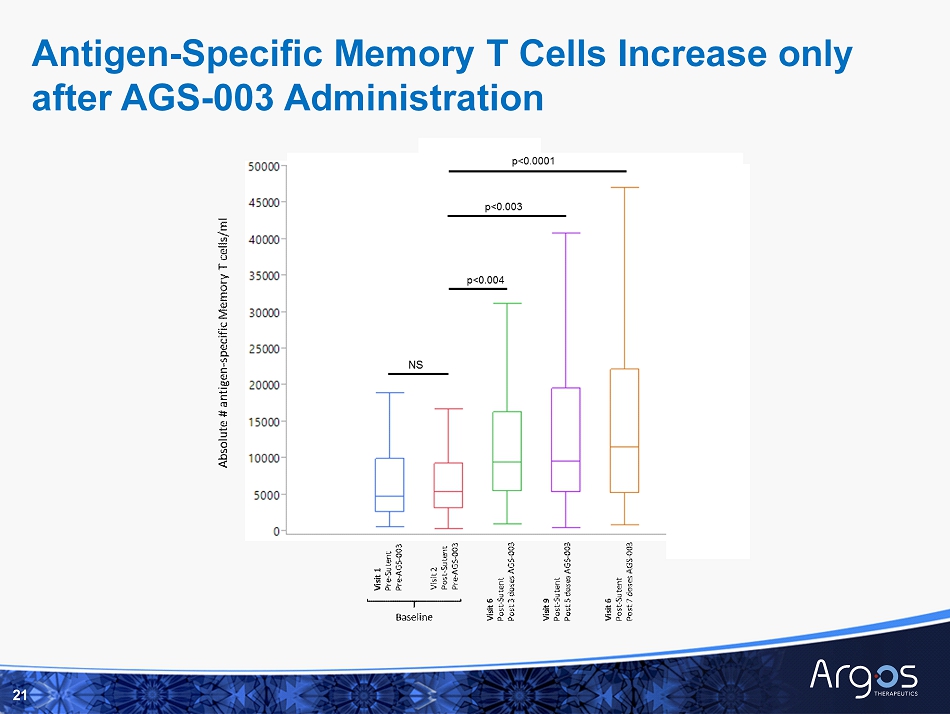
Antigen - Specific Memory T Cells Increase only after AGS - 003 Administration 14
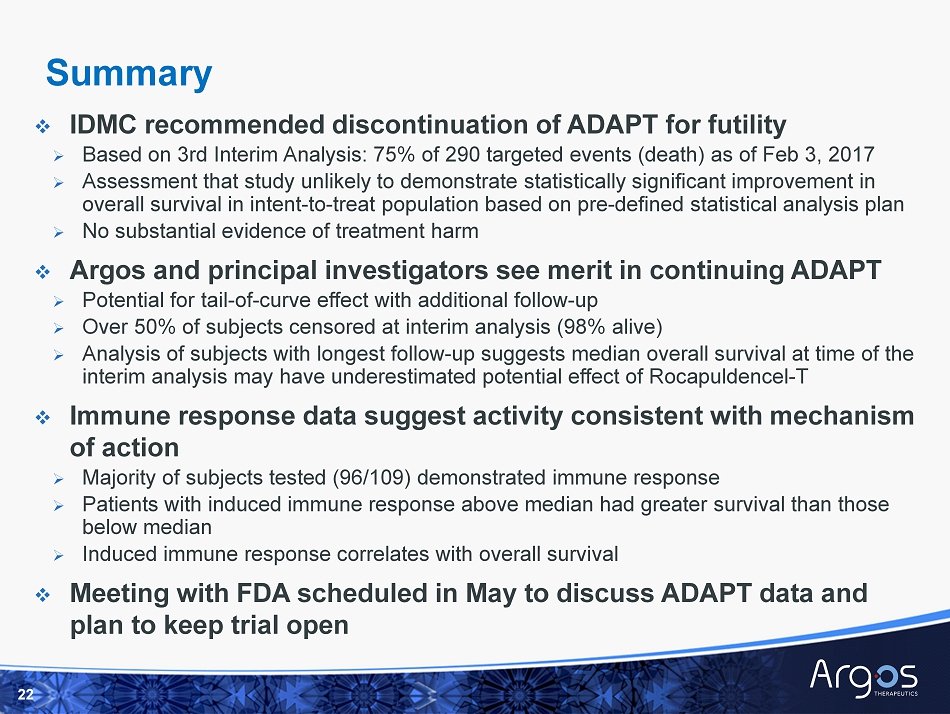
□ IDMC recommended discontinuation of ADAPT for futility » Based on 3rd Interim Analysis: 75% of 290 targeted events ( death) as of Feb 3, 2017 » Assessment that study unlikely to demonstrate statistically significant improvement in o verall survival in intent - to - treat population based on pre - defined statistical analysis plan » No substantial evidence of treatment harm □ Argos and principal investigators see merit in continuing ADAPT » Potential for tail - of - curve effect with additional follow - up » Over 50% of subjects censored at interim analysis (98% alive) » Analysis of subjects with longest follow - up suggests median overall survival at time of the interim analysis may have underestimated potential effect of Rocapuldencel - T □ Immune response data suggest activity consistent with mechanism of action » Majority of subjects tested (96/109) demonstrated immune response » Patients with induced immune response above median had greater survival than those below median » Induced immune response correlates with overall survival □ Meeting with FDA scheduled in May to discuss ADAPT data and plan to keep trial open 22 Summary

Appendix
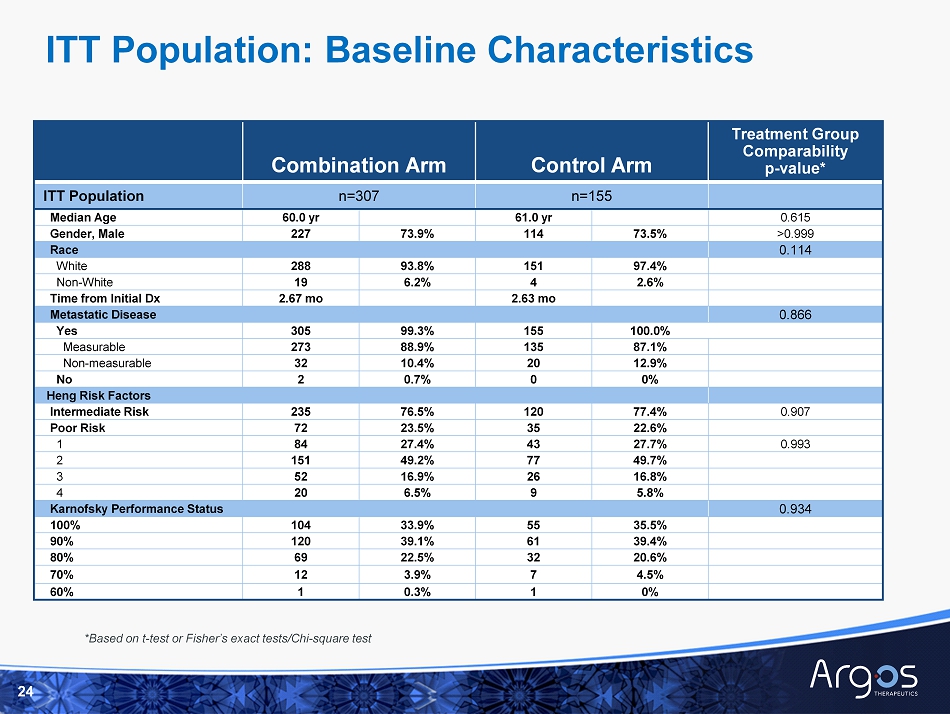
Combination Arm Control Arm Treatment Group Comparability p - value* ITT Population n=307 n=155 Median Age 60.0 yr 61.0 yr 0.615 Gender, Male 227 73.9% 114 73.5% >0.999 Race 0.114 White 288 93.8% 151 97.4% Non - White 19 6.2% 4 2.6% Time from Initial Dx 2.67 mo 2.63 mo Metastatic Disease 0.866 Yes 305 99.3% 155 100.0% Measurable 273 88.9% 135 87.1% Non - measurable 32 10.4% 20 12.9% No 2 0.7% 0 0% Heng Risk Factors Intermediate Risk 235 76.5% 120 77.4% 0.907 Poor Risk 72 23.5% 35 22.6% 1 84 27.4% 43 27.7% 0.993 2 151 49.2% 77 49.7% 3 52 16.9% 26 16.8% 4 20 6.5% 9 5.8% Karnofsky Performance Status 0.934 100% 104 33.9% 55 35.5% 90% 120 39.1% 61 39.4% 80% 69 22.5% 32 20.6% 70% 12 3.9% 7 4.5% 60% 1 0.3% 1 0% *Based on t - test or Fisher’s exact tests/Chi - square test 24 ITT Population: Baseline Characteristics
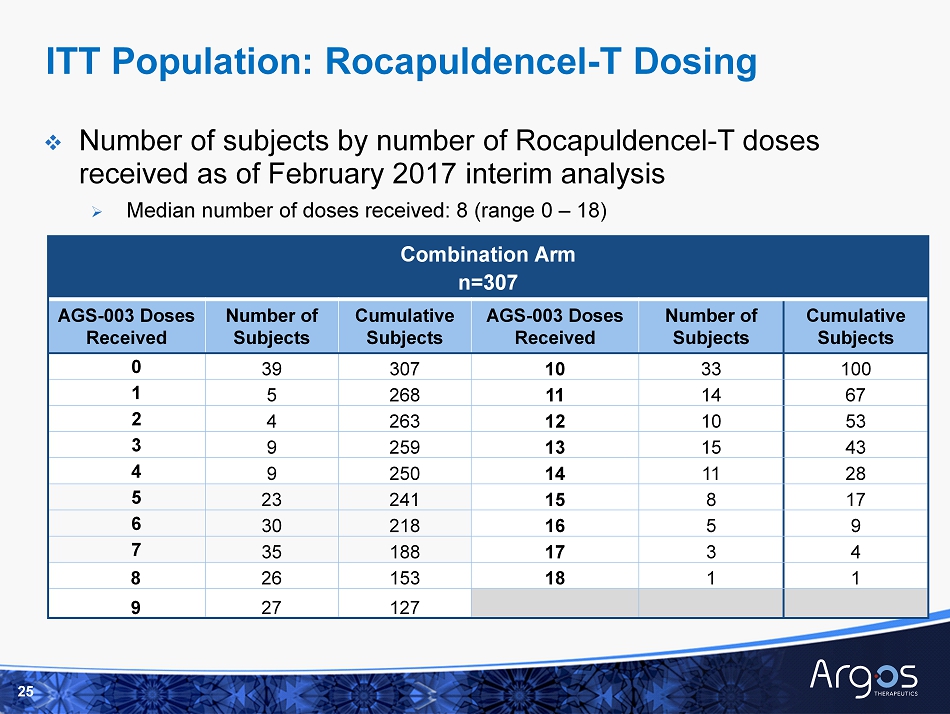
Combination Arm n=307 AGS - 003 Doses Received Number of Subjects Cumulative Subjects AGS - 003 Doses Received Number of Subjects Cumulative Subjects 0 39 307 10 33 100 1 5 268 11 14 67 2 4 263 12 10 53 3 9 259 13 15 43 4 9 250 14 11 28 5 23 241 15 8 17 6 30 218 16 5 9 7 35 188 17 3 4 8 26 153 18 1 1 9 27 127 □ Number of subjects by number of Rocapuldencel - T doses received as of February 2017 interim analysis » Median number of doses received: 8 (range 0 – 18) 25 ITT Population: Rocapuldencel - T Dosing
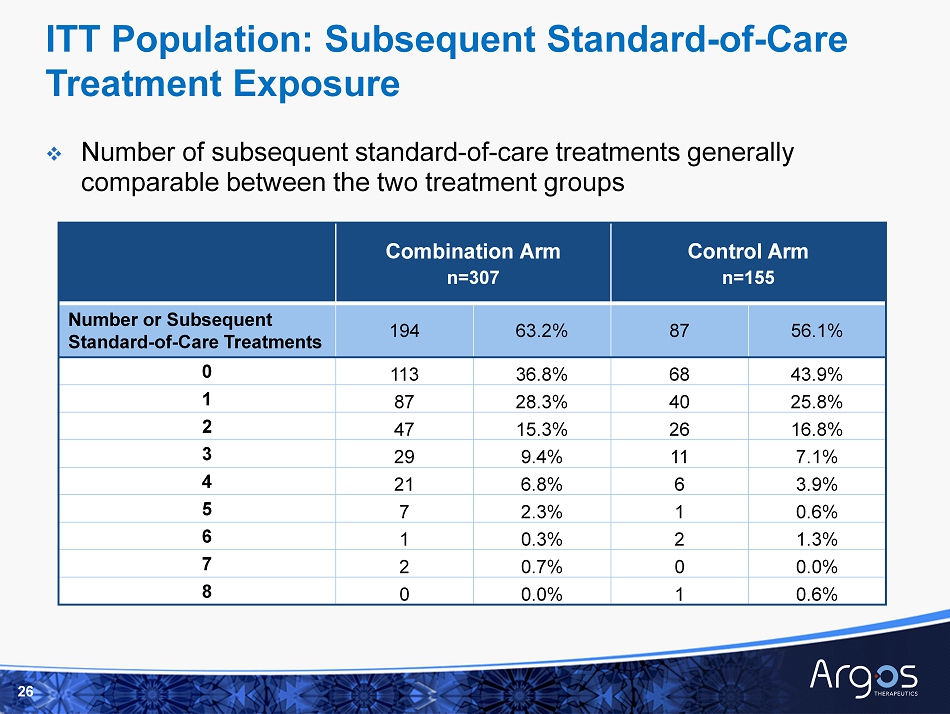
Combination Arm n=307 Control Arm n=155 Number or Subsequent Standard - of - Care Treatments 194 63.2% 87 56.1% 0 113 36.8% 68 43.9% 1 87 28.3% 40 25.8% 2 47 15.3% 26 16.8% 3 29 9.4% 11 7.1% 4 21 6.8% 6 3.9% 5 7 2.3% 1 0.6% 6 1 0.3% 2 1.3% 7 2 0.7% 0 0.0% 8 0 0.0% 1 0.6% □ Number of subsequent standard - of - care t reatments generally comparable between the two treatment groups 26 ITT Population: Subsequent Standard - of - Care Treatment Exposure
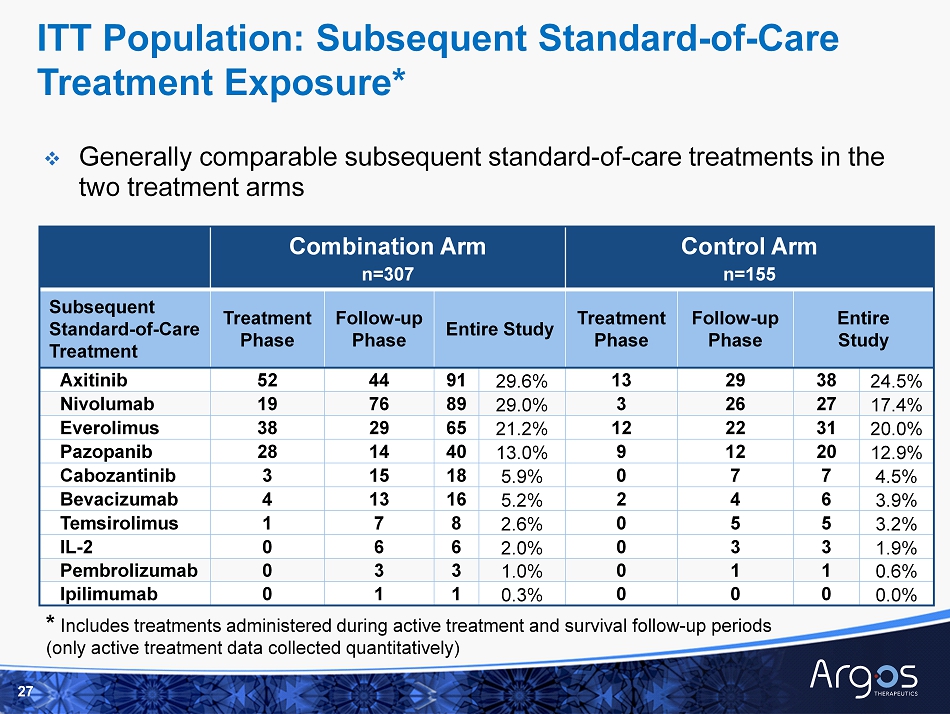
Combination Arm n=307 Control Arm n=155 Subsequent Standard - of - Care Treatment Treatment Phase Follow - up Phase Entire Study Treatment Phase Follow - up Phase Entire Study Axitinib 52 44 91 29.6% 13 29 38 24.5% Nivolumab 19 76 89 29.0% 3 26 27 17.4% Everolimus 38 29 65 21.2% 12 22 31 20.0% Pazopanib 28 14 40 13.0% 9 12 20 12.9% Cabozantinib 3 15 18 5.9% 0 7 7 4.5% Bevacizumab 4 13 16 5.2% 2 4 6 3.9% Temsirolimus 1 7 8 2.6% 0 5 5 3.2% IL - 2 0 6 6 2.0% 0 3 3 1.9% Pembrolizumab 0 3 3 1.0% 0 1 1 0.6% Ipilimumab 0 1 1 0.3% 0 0 0 0.0% □ Generally comparable subsequent standard - of - care treatments in the two treatment arms 27 * Includes treatments administered during active treatment and survival follow - up periods (only active treatment data collected quantitatively) ITT Population: Subsequent Standard - of - Care Treatment Exposure*
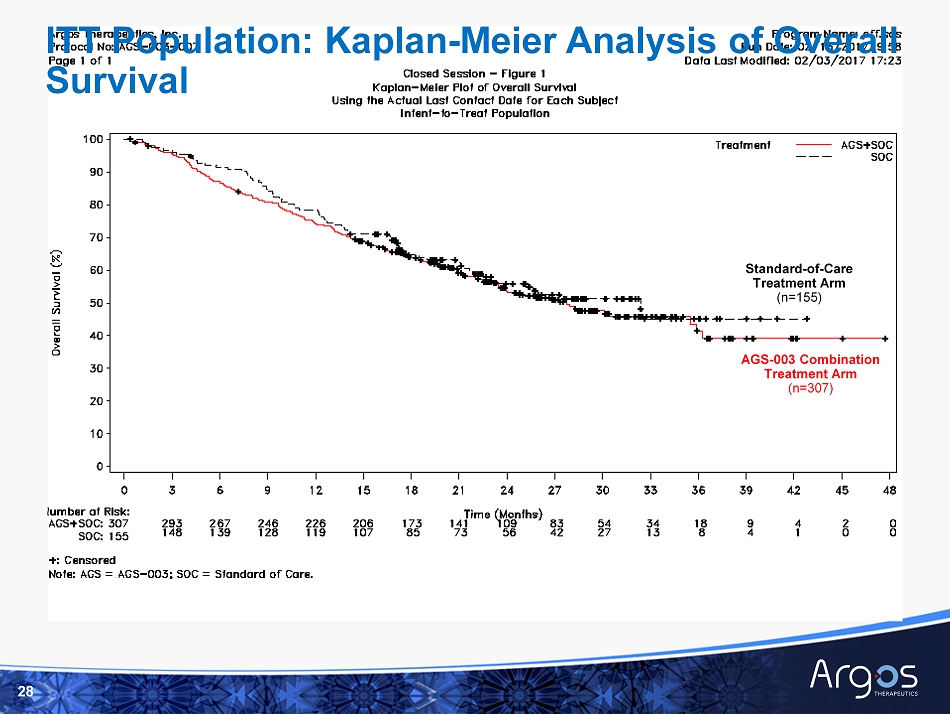
28 AGS - 003 Combination Treatment Arm ( n=307) Standard - of - Care Treatment Arm ( n=155) ITT Population: Kaplan - Meier Analysis of Overall Survival
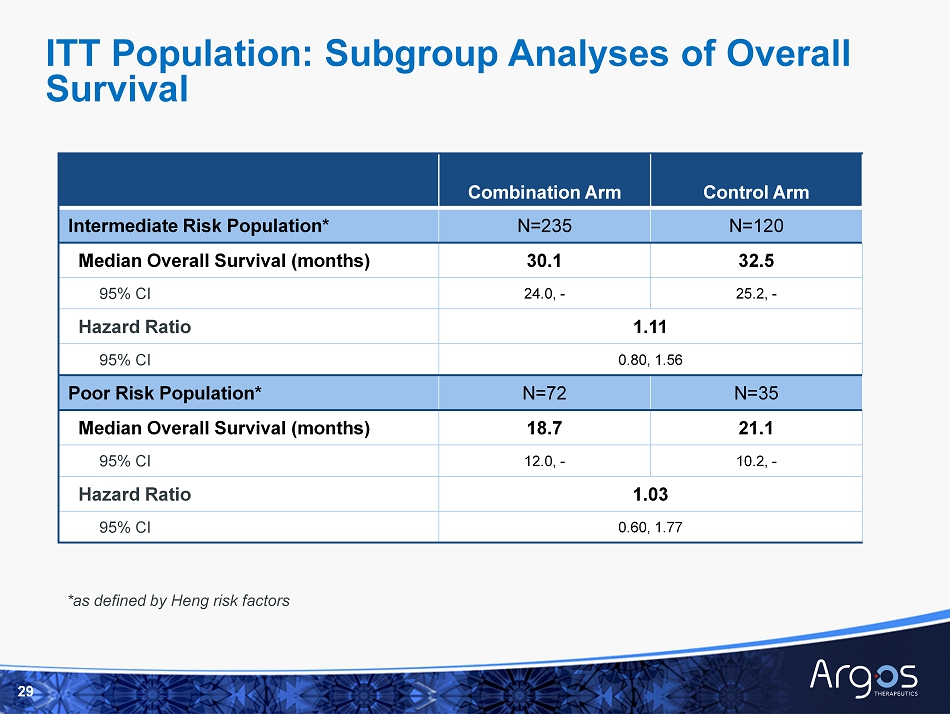
Combination Arm Control Arm Intermediate Risk Population* N=235 N=120 Median Overall Survival (months) 30.1 32.5 95% CI 24.0, - 25.2, - Hazard Ratio 1.11 95% CI 0.80, 1.56 Poor Risk Population* N=72 N=35 Median Overall Survival (months) 18.7 21.1 95% CI 12.0, - 10.2, - Hazard Ratio 1.03 95% CI 0.60, 1.77 ITT Population: Subgroup Analyses of Overall Survival 29 *as defined by Heng risk factors
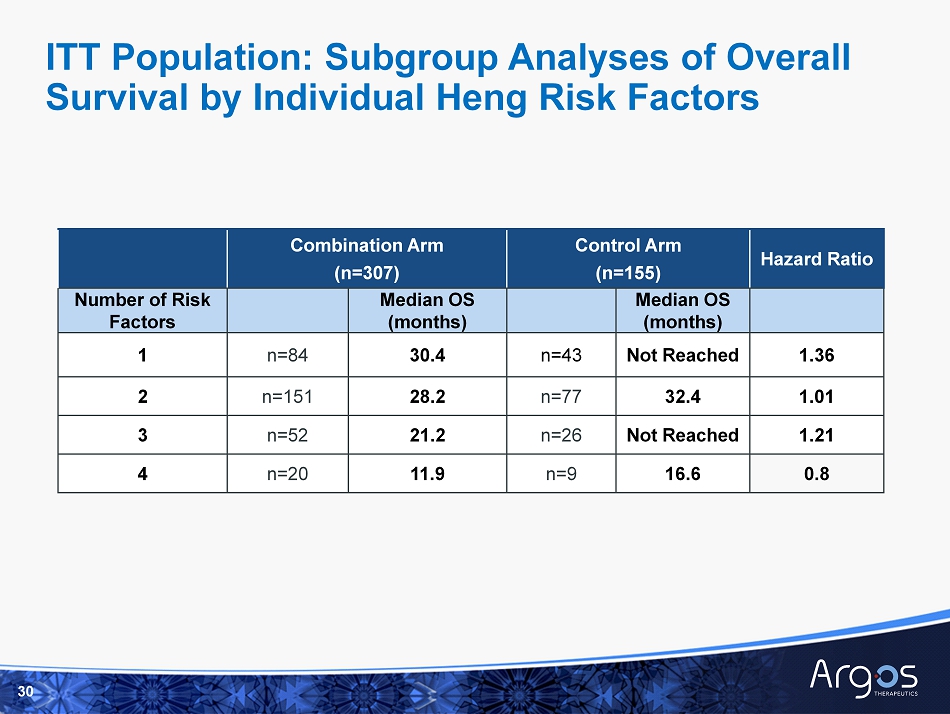
Combination Arm (n=307) Control Arm (n=155) Hazard Ratio Number of Risk Factors Median OS (months) Median OS (months) 1 n=84 30.4 n=43 Not Reached 1.36 2 n=151 28.2 n=77 32.4 1.01 3 n=52 21.2 n=26 Not Reached 1.21 4 n=20 11.9 n=9 16.6 0.8 30 ITT Population: Subgroup Analyses of Overall Survival by Individual Heng Risk Factors
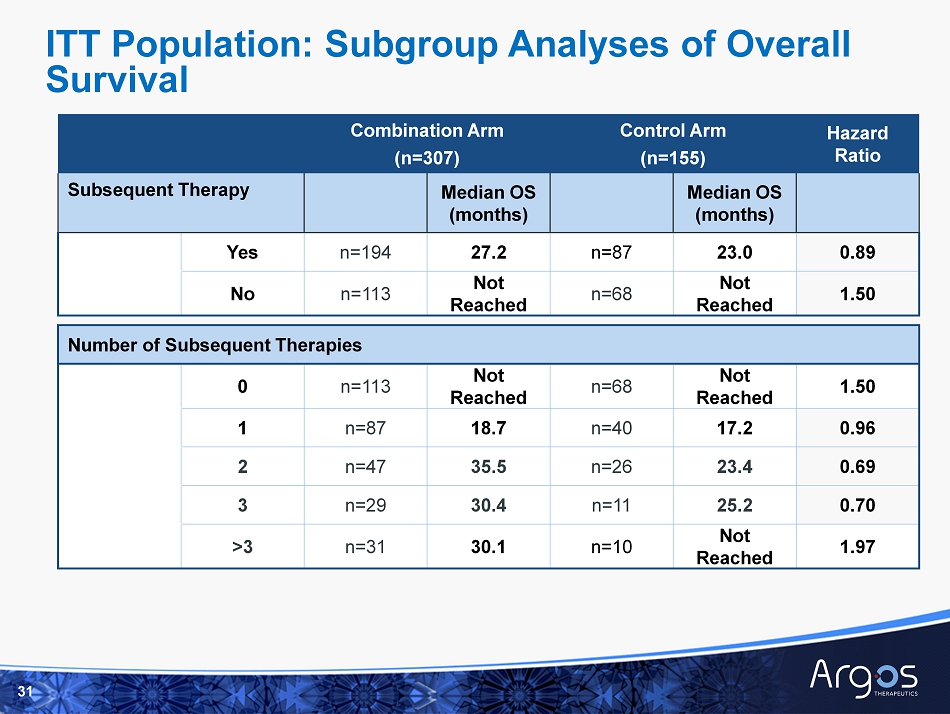
Combination Arm (n=307) Control Arm (n=155) Hazard Ratio Subsequent Therapy Median OS (months) Median OS (months) Yes n=194 27.2 n=87 23.0 0.89 No n=113 Not Reached n=68 Not Reached 1.50 Number of Subsequent Therapies 0 n=113 Not Reached n=68 Not Reached 1.50 1 n=87 18.7 n=40 17.2 0.96 2 n=47 35.5 n=26 23.4 0.69 3 n=29 30.4 n=11 25.2 0.70 >3 n=31 30.1 n=10 Not Reached 1.97 31 ITT Population: Subgroup Analyses of Overall Survival

Combination Arm Control Arm Subjects Who Received Any Amount of Study Medication (n=299) n, % (n=141) n, % Pre - Treatment Period Any Adverse Events 10 (3.3%) 2 (1.4%) Any Serious Adverse Events 1 (0.3%) 0 (0.0%) Any Grade 3/4/5 AEs 1 (0.3%) 0 (0.0%) Randomized Treatment Period Any Adverse Events 296 (99.0%) 139 (98.6%) AGS - 003 Related AEs 174 (58.2%) - Standard of Care Related AEs 285 (95.3%) 134 (95.0%) Any Grade 3/4/5 AEs 214 (71.6%) 98 (69.5%) AGS - 003 Related Grade 3/4/5 AEs 6 (2.0%) - Standard of Care Related Grade 3/4/5 AEs 144 (48.2%) 74 (52.5%) Deaths 19 (6.4%) 7 (5.0%) 32 Summary of Adverse Events - Safety Population
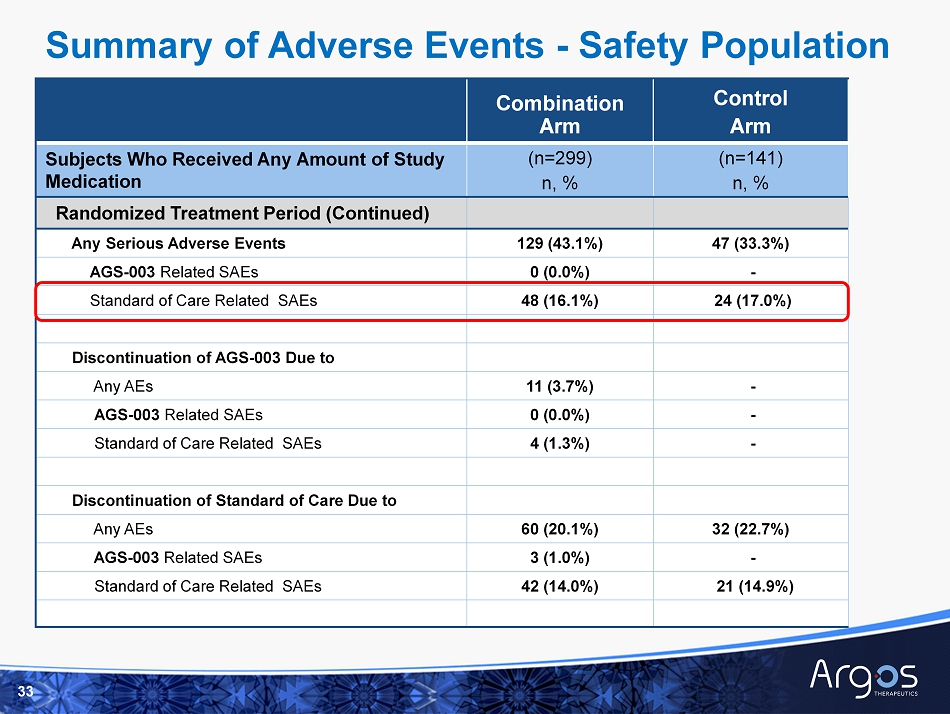
Combination Arm Control Arm Subjects Who Received Any Amount of Study Medication (n=299) n, % (n=141) n, % Randomized Treatment Period (Continued) Any Serious Adverse Events 129 (43.1%) 47 (33.3%) AGS - 003 Related SAEs 0 (0.0%) - Standard of Care Related SAEs 48 (16.1%) 24 (17.0%) Discontinuation of AGS - 003 Due to Any AEs 11 (3.7%) - AGS - 003 Related SAEs 0 (0.0%) - Standard of Care Related SAEs 4 (1.3%) - Discontinuation of Standard of Care Due to Any AEs 60 (20.1%) 32 (22.7%) AGS - 003 Related SAEs 3 (1.0%) - Standard of Care Related SAEs 42 (14.0%) 21 (14.9%) 33 Summary of Adverse Events - Safety Population
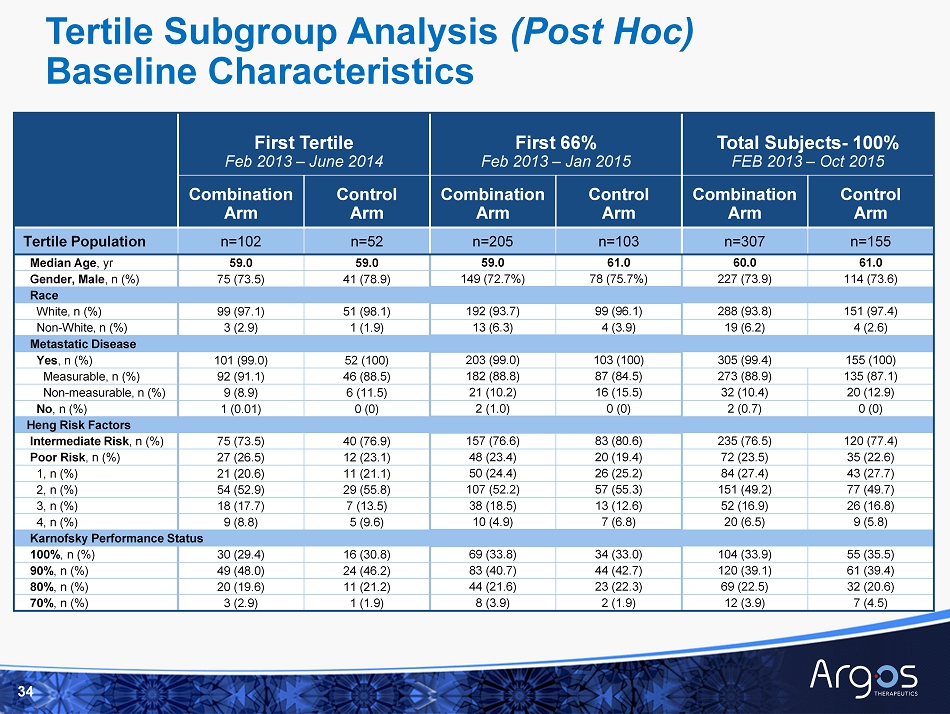
First Tertile Feb 2013 – June 2014 First 66% Feb 2013 – Jan 2015 Total Subjects - 100% FEB 2013 – Oct 2015 Combination Arm Control Arm Combination Arm Control Arm Combination Arm Control Arm Tertile Population n=102 n=52 n=205 n=103 n=307 n=155 Median Age , yr 59.0 59.0 59.0 61.0 60.0 61.0 Gender, Male , n (%) 75 (73.5) 41 (78.9) 149 (72.7%) 78 (75.7%) 227 (73.9) 114 (73.6) Race White, n (%) 99 (97.1) 51 (98.1) 192 (93.7) 99 (96.1) 288 (93.8) 151 (97.4) Non - White , n (%) 3 (2.9) 1 (1.9) 13 (6.3) 4 (3.9) 19 (6.2) 4 (2.6) Metastatic Disease Yes , n (%) 101 (99.0) 52 (100) 203 (99.0) 103 (100) 305 (99.4) 155 (100) Measurable , n (%) 92 (91.1) 46 (88.5) 182 (88.8) 87 (84.5) 273 (88.9) 135 (87.1) Non - measurable, n (%) 9 (8.9) 6 (11.5) 21 (10.2) 16 (15.5) 32 (10.4) 20 (12.9) No , n (%) 1 (0.01) 0 (0) 2 (1.0) 0 (0) 2 (0.7) 0 (0) Heng Risk Factors Intermediate Risk , n (%) 75 (73.5) 40 (76.9) 157 (76.6) 83 (80.6) 235 (76.5) 120 (77.4) Poor Risk , n (%) 27 (26.5) 12 (23.1) 48 (23.4) 20 (19.4) 72 (23.5) 35 (22.6) 1 , n (%) 21 (20.6) 11 (21.1) 50 (24.4) 26 (25.2) 84 (27.4) 43 (27.7) 2, n (%) 54 (52.9) 29 (55.8) 107 (52.2) 57 (55.3) 151 (49.2) 77 (49.7) 3 , n (%) 18 (17.7) 7 (13.5) 38 (18.5) 13 (12.6) 52 (16.9) 26 (16.8) 4, n (%) 9 (8.8) 5 (9.6) 10 (4.9) 7 (6.8) 20 (6.5) 9 (5.8) Karnofsky Performance Status 100% , n (%) 30 (29.4) 16 (30.8) 69 (33.8) 34 (33.0) 104 (33.9) 55 (35.5) 90% , n (%) 49 (48.0) 24 (46.2) 83 (40.7) 44 (42.7) 120 (39.1) 61 (39.4) 80% , n (%) 20 (19.6) 11 (21.2) 44 (21.6) 23 (22.3) 69 (22.5) 32 (20.6) 70% , n (%) 3 (2.9) 1 (1.9) 8 (3.9) 2 (1.9) 12 (3.9) 7 (4.5) 34 Tertile Subgroup Analysis (Post Hoc) Baseline Characteristics
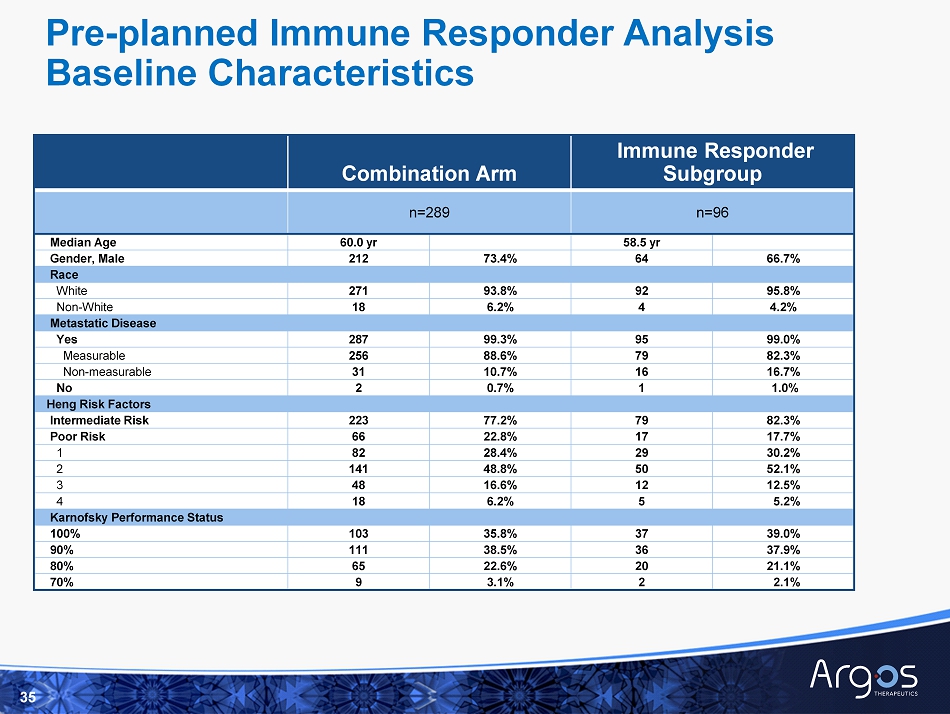
Combination Arm Immune Responder Subgroup n=289 n=96 Median Age 60.0 yr 58.5 yr Gender, Male 212 73.4% 64 66.7% Race White 271 93.8% 92 95.8% Non - White 18 6.2% 4 4.2% Metastatic Disease Yes 287 99.3% 95 99.0% Measurable 256 88.6% 79 82.3% Non - measurable 31 10.7% 16 16.7% No 2 0.7% 1 1.0% Heng Risk Factors Intermediate Risk 223 77.2% 79 82.3% Poor Risk 66 22.8% 17 17.7% 1 82 28.4% 29 30.2% 2 141 48.8% 50 52.1% 3 48 16.6% 12 12.5% 4 18 6.2% 5 5.2% Karnofsky Performance Status 100% 103 35.8% 37 39.0% 90% 111 38.5% 36 37.9% 80% 65 22.6% 20 21.1% 70% 9 3.1% 2 2.1% 35 Pre - planned Immune Responder Analysis Baseline Characteristics