This presentation contains information that is proprietary to ClickSoftware . Any copying, distribution, display, transmission or dissemination of the information contained in this presentation to third parties without the prior written consent of ClickSoftware is strictly prohibited . No part of this presentation may be reproduced, translated or transmitted in any form or by any means, electronic, optic or mechanical, including photocopying, recording, or any information storage or retrieval system without written prior permission from the owner of the copyright . © 2015 ClickSoftware Technologies Ltd . All rights reserved . ClickSoftware (CKSW) Q4 & YE 2014 Earnings Call February 4, 2015 Dr. Moshe BenBassat, CEO Joel Jeselsohn, CFO

SAFE HARBOR STATEMENT This presentation contains express or implied forward - looking statements within the Private Securities Litigation Reform Act of 1995 and other U . S Federal securities laws . These forward - looking statements include, but are not limited to, those regarding future results of operations, including our outlook for full year 2015 revenues, visibility into future periods, growth and rates of growth, expectations of future cash flows and dividends, and expectations regarding closing of contracts, receipt of orders, recognition of revenues and deferred revenues . Such “forward - looking statements” involve known and unknown risks, uncertainties and other factors, which may cause actual results or performance to be materially different from those projected . ClickSoftware's achievement of these results may be affected by many factors, including among others, the following : uncertainties regarding the general economic outlook ; the length of or change in the Company's sales cycle ; the Company’s ability to identify potential customers and to close sales to potential customers in a timely manner ; the Company’s ability to maintain relationships with strategic partners, the ability of the Company’s professional services group to successfully complete implementations ; and the Company’s ability to predict and control expenses and to align revenues and expenses . The forward - looking statements contained in this presentation are subject to other risks and uncertainties, including those discussed in the "Risk Factors" section and elsewhere in ClickSoftware's annual report on Form 20 - F for the year ended December 31 , 2013 and in subsequent filings with the Securities and Exchange Commission . Except as otherwise required by law, ClickSoftware is under no obligation to (and expressly disclaims any such obligation to) update or alter its forward - looking statements whether as a result of new information, future events or otherwise . Please note that ClickSoftware reports net income and net earnings per share on both a GAAP basis and on an adjusted non - GAAP basis . ClickSoftware’s financial reports include a reconciliation of non - GAAP information to the most directly comparable GAAP information and is posted in the Investors section of the Company's website at www . clicksoftware . com . Reconciliation of the Non - GAAP fully diluted EPS for 2015 to the most directly comparable GAAP information is detailed in the press release which was issued on February 4 , 2015 , and which is posted in the Investors section of the Company's website .
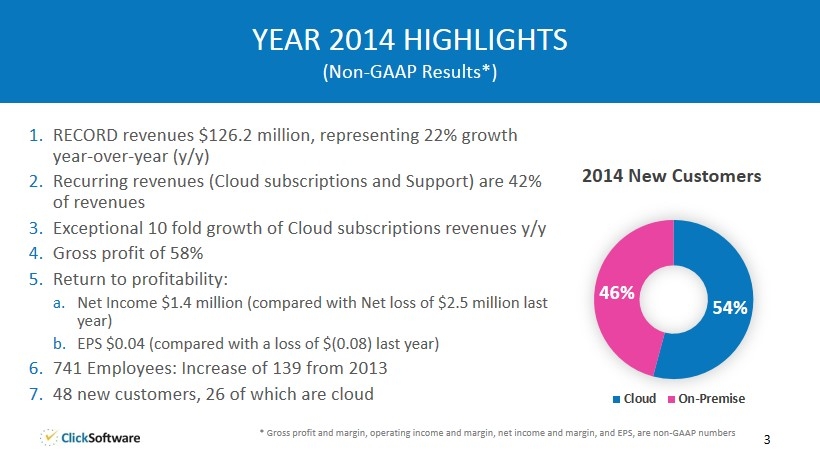
1. RECORD revenues $126.2 million, representing 22% growth year - over - year (y/y) 2. Recurring revenues (Cloud subscriptions and Support) are 42% of revenues 3. Exceptional 10 fold growth of Cloud subscriptions revenues y/y 4. Gross profit of 58% 5. Return to profitability: a. Net Income $1.4 million (compared with Net loss of $2.5 million last year) b. EPS $0.04 (compared with a loss of $(0.08) last year) 6. 741 Employees: Increase of 139 from 2013 7. 48 new customers, 26 of which are cloud 3 YEAR 2014 HIGHLIGHTS (Non - GAAP Results*) 54% 46% 2014 New Customers Cloud On-Premise * Gross profit and margin, operating income and margin, net income and margin, and EPS, are non - GAAP numbers

1. RECORD revenues $34.5 million, representing 12% growth year - over - year (y/y) 2. Recurring revenues (Cloud subscriptions and Support) are 41% of revenues 3. ARR End of 2014: $22.7 million 4. Gross profit of 60% 5. Return to profitability: a. Net Income $3.6 million (compared with $2.3 million in Q4’13, an increase of 59% y/y) b. EPS $0.11 (compared $0.07 in Q4’13) 6. We ended the year with $45 million in cash and cash equivalents with positive cash flow in the quarter 7. 22 new customers (record number!), 15 of which are cloud 4 Q4 HIGHLIGHTS (Non - GAAP Results*) 68% 32% Q4'14 New Customers Cloud On-Premise * Gross profit and margin, operating income and margin, net income and margin, and EPS, are non - GAAP numbers
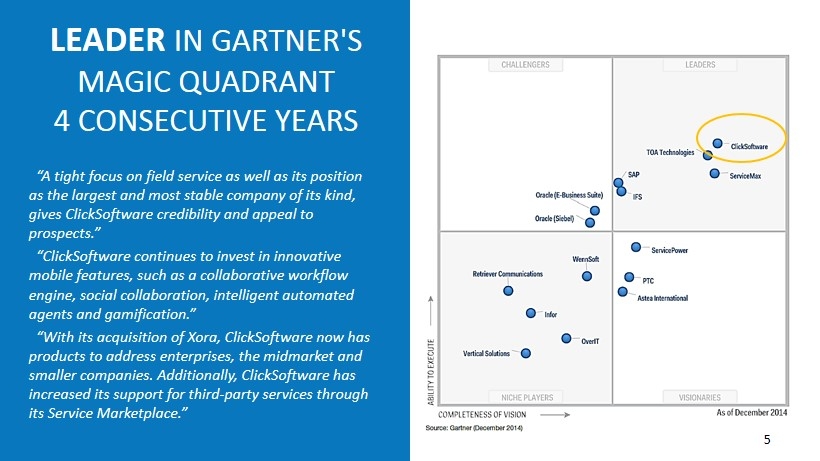
LEADER IN GARTNER'S MAGIC QUADRANT 4 CONSECUTIVE YEARS “ A tight focus on field service as well as its position as the largest and most stable company of its kind, gives ClickSoftware credibility and appeal to prospects .” “ ClickSoftware continues to invest in innovative mobile features, such as a collaborative workflow engine, social collaboration, intelligent automated agents and gamification.” “ With its acquisition of Xora, ClickSoftware now has products to address enterprises, the midmarket and smaller companies. Additionally, ClickSoftware has increased its support for third - party services through its Service Marketplace.” 5

CLOUD TRACTION We have become a PREMIER CLOUD VENDOR in terms of USER BASE and SOLUTION BREADTH for companies of ALL SIZES Pipeline ▪ Cloud pipeline increased by 75% . ▪ Cloud customers represent 45% of total opportunities at end of 2014. 61% 32% 45% 39% 68% 55% Americas EMEA APAC Pipeline in Territories Cloud On-Premise $ 1,596 $ 18,723 2013 2014 Exceptional 10 fold growth of Cloud subscriptions revenues y/y (in $000)
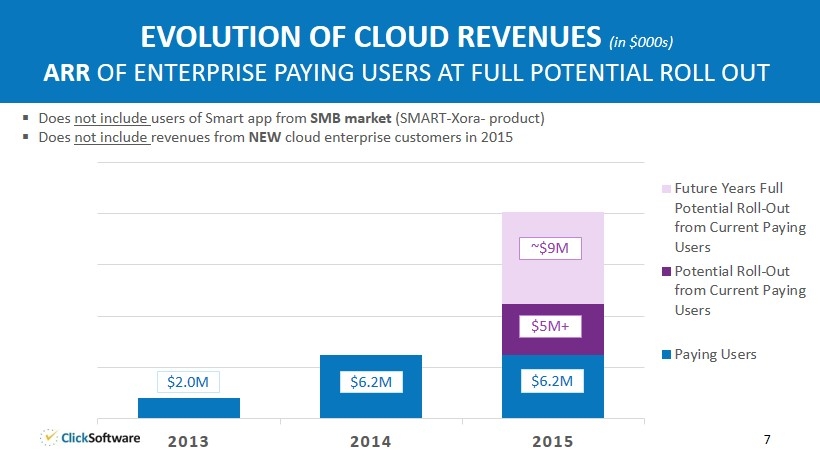
2013 2014 2015 Future Years Full Potential Roll-Out from Current Paying Users Potential Roll-Out from Current Paying Users Paying Users 7 EVOLUTION OF CLOUD REVENUES (in $000s) ARR OF ENTERPRISE PAYING USERS AT FULL POTENTIAL ROLL OUT $6.2M $2.0M $5M+ $6.2M ▪ Does not include users of Smart app from SMB market (SMART - Xora - product) ▪ Does not include revenues from NEW cloud enterprise customers in 2015 ~$9M

8 EXPANDING OUR ADDRESSABLE MARKET TO SERVICE PROVIDERS OF ALL SIZES AND SERVICE NETWORKS ENTERPRISE MEDIUM SMALL INDIVIDUAL SERVICE COMPANIES OF ALL SIZES NETWORK OF SERVICE PROVIDERS 1000’s 100’s 10’s A MULTI - TIER NETWORK OF SERVICE PROVIDERS WORKING TOGETHER IN A VARIETY OF OUTSOURCING OR SUB - CONTRACTING ROLES

Intelligent automation is ClickSoftware’s most powerful unique differentiator, and generates the most value for our customers INTEGRATE INTELLIGENT AUTOMATION WITH MOBILITY - BASED CONNECTIVITY AND YOU GET: ▪ REAL TIME, CONTEXT - AWARE INTELLIGENT AUTOMATIC ACTIONS ▪ PROACTIVE, AUTONOMOUS, OR AT USER’S REQUEST SERVICE PROVIDERS SENSORS ASSETS CUSTOMER PARTS VEHICLES TECHNICIANS CONNECT & OPTIMIZE ALL “THINGS” IN THE SERVICE WORLD 9
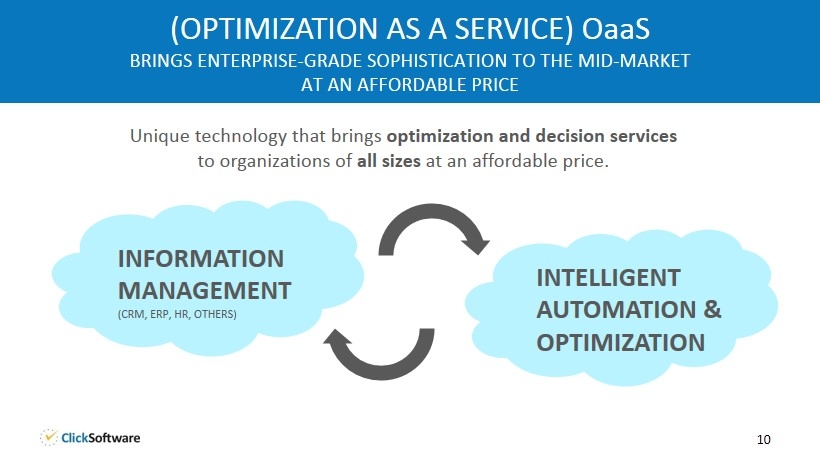
10 ( OPTIMIZATION AS A SERVICE) O aa S BRINGS ENTERPRISE - GRADE SOPHISTICATION TO THE MID - MARKET AT AN AFFORDABLE PRICE Unique technology that brings optimization and decision services to organizations of all sizes at an affordable price. INFORMATION MANAGEMENT (CRM, ERP, HR, OTHERS) INTELLIGENT AUTOMATION & OPTIMIZATION
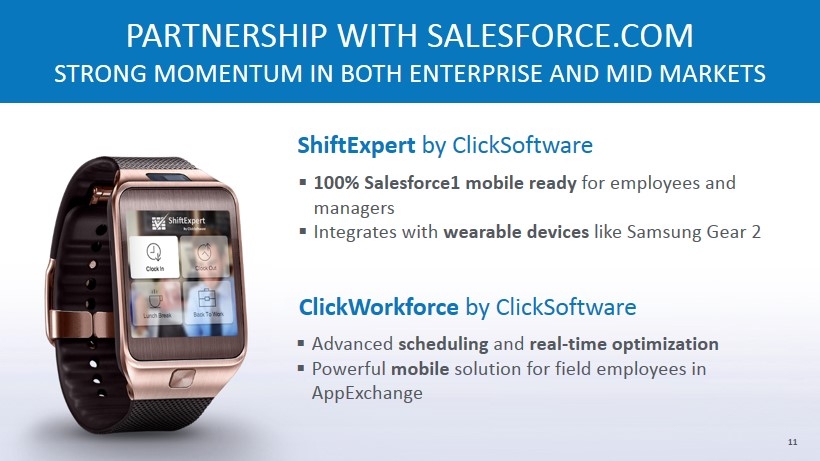
11 PARTNERSHIP WITH SALESFORCE.COM STRONG MOMENTUM IN BOTH ENTERPRISE AND MID MARKETS ▪ 100% Salesforce1 mobile ready for employees and managers ▪ Integrates with wearable devices like Samsung Gear 2 11 ShiftExpert by ClickSoftware ▪ Advanced scheduling and real - time optimization ▪ Powerful mobile solution for field employees in AppExchange ClickWorkforce by ClickSoftware
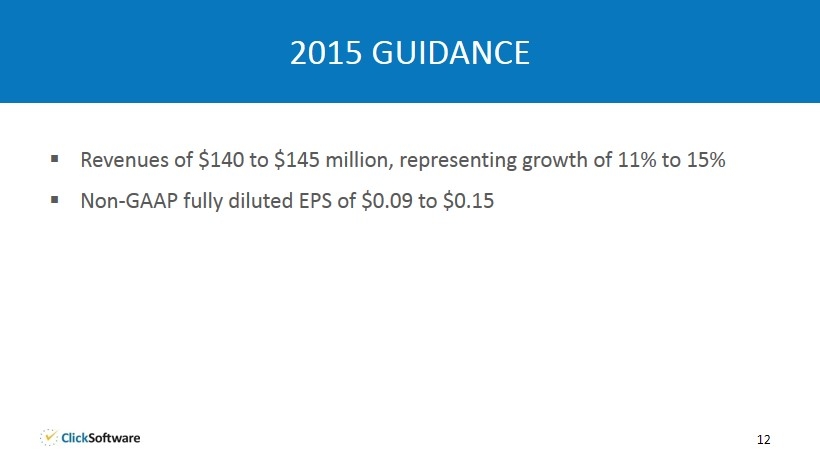
12 2015 GUIDANCE ▪ Revenues of $140 to $145 million, representing growth of 11% to 15 % ▪ Non - GAAP fully diluted EPS of $0.09 to $ 0.15
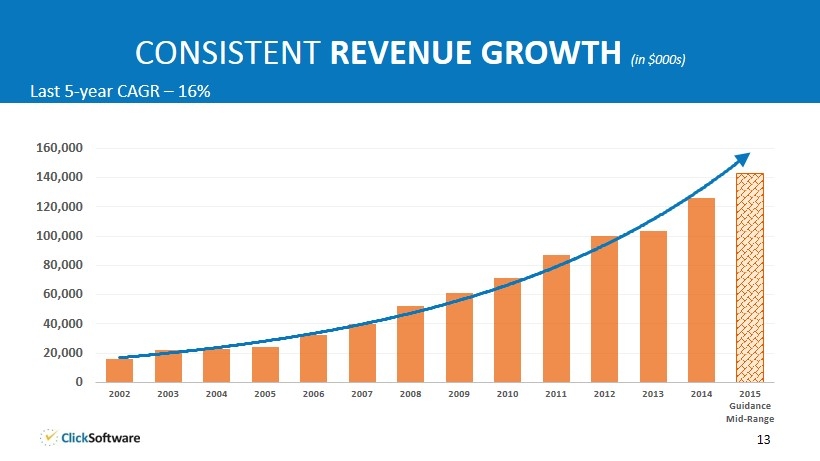
CONSISTENT REVENUE GROWTH (in $000s) Last 5 - year CAGR – 16% 0 20,000 40,000 60,000 80,000 100,000 120,000 140,000 160,000 2002 2003 2004 2005 2006 2007 2008 2009 2010 2011 2012 2013 2014 2015 Guidance Mid - Range 13

14 STEPPING OUT OF CLOUD TRANSITION – BACK TO PROFITABILITY (0.20) (0.10) - 0.10 0.20 0.30 0.40 0.50 0.60 (4,000) (2,000) - 2,000 4,000 6,000 8,000 10,000 12,000 14,000 16,000 18,000 20,000 2007 2008 2009 2010 2011 2012 2013 2014 2015 Guidance Mid-Range Net Income (Non-GAAP) EPS (Non-GAAP) (in $000s)
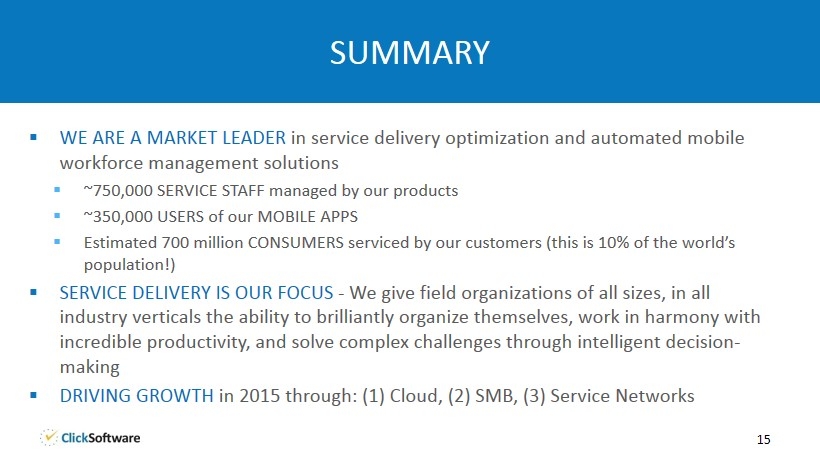
▪ WE ARE A MARKET LEADER in service delivery optimization and automated mobile workforce management solutions ▪ ~750,000 SERVICE STAFF managed by our products ▪ ~ 350,000 USERS of our MOBILE APPS ▪ Estimated 700 million CONSUMERS serviced by our customers (this is 10% of the world’s population!) ▪ SERVICE DELIVERY IS OUR FOCUS - We give field organizations of all sizes, in all industry verticals the ability to brilliantly organize themselves, work in harmony with incredible productivity, and solve complex challenges through intelligent decision - making ▪ DRIVING GROWTH in 2015 through: (1) Cloud, (2) SMB, (3) Service Networks 15 SUMMARY
APPENDIX

ANNUAL P&L STATEMENTS (Non - GAAP Results*) 2014 2013 2012 2011 License 27,277 27,083 33,882 31,270 Cloud Subscriptions 18,723 1,596 659 272 Support 34,437 31,040 26,564 21,788 Consulting 45,776 43,462 38,941 33,757 Total Revenues ($K) 126,213 103,181 100,046 87,087 Y/Y Growth (%) 22% 3% 15% 23% Gross Profit ($K) 73,738 59,655 62,084 56,312 Gross Margin (%) 58% 58% 62% 65% Operating (Loss) Income ($K) 954 (2,727) 10,522 18,172 Operating Margin (%) 1% (3%) 11% 21% Net (Loss) Income ($K) 1,446 (2,530) 10,197 17,027 Net Margin (%) 1% (2%) 10% 20% EPS ($) 0.04 (0.08) 0.31 0.53 * Gross profit and margin, operating income and margin, net income and margin, and EPS, are non - GAAP numbers 17
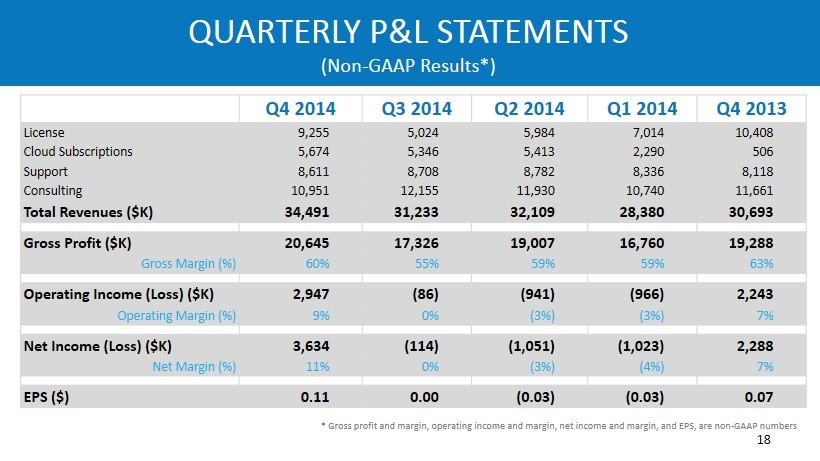
QUARTERLY P&L STATEMENTS (Non - GAAP Results*) Q4 2014 Q3 2014 Q2 2014 Q1 2014 Q4 2013 License 9,255 5,024 5,984 7,014 10,408 Cloud Subscriptions 5,674 5,346 5,413 2,290 506 Support 8,611 8,708 8,782 8,336 8,118 Consulting 10,951 12,155 11,930 10,740 11,661 Total Revenues ($K) 34,491 31,233 32,109 28,380 30,693 Gross Profit ($K) 20,645 17,326 19,007 16,760 19,288 Gross Margin (%) 60% 55% 59% 59% 63% Operating Income (Loss) ($K) 2,947 (86) (941) (966) 2,243 Operating Margin (%) 9% 0% (3%) (3%) 7% Net Income (Loss) ($K) 3,634 (114) (1,051) (1,023) 2,288 Net Margin (%) 11% 0% (3%) (4%) 7% EPS ($) 0.11 0.00 (0.03) (0.03) 0.07 * Gross profit and margin, operating income and margin, net income and margin, and EPS, are non - GAAP numbers 18