UNITED STATES
SECURITIES AND EXCHANGE COMMISSION
Washington, D.C. 20549
FORM N-CSR
CERTIFIED SHAREHOLDER REPORT OF REGISTERED
MANAGEMENT INVESTMENT COMPANIES
Investment Company Act file number 811-09821
Allied Asset Advisors Funds
(Exact name of Registrant as specified in charter)
745 McClintock Drive, Suite 314
Burr Ridge, IL 60527
(Address of principal executive offices) (Zip code)
Bassam Osman
Allied Asset Advisors Funds
745 McClintock Drive, Suite 314
Burr Ridge, IL 60527
(Name and address of agent for service)
(877) 417-6161
Registrant's telephone number, including area code
Date of fiscal year end: May 31, 2008
Date of reporting period: November 30, 2007
Item 1. Report to Stockholders.
Semi-Annual Report
November 30, 2007
(Unaudited)
Dow JonesSM
Islamic Fund
DOW JONES ISLAMIC FUND
January 15, 2008
Dear fellow Shareholders:
Assalamu Alaykum (Greetings of Peace).
We are pleased to report that the Dow Jones Islamic Fund-Class K (“Fund”) performed well in the six months ending November 30, 2007, rising 6.79%. The Morningstar Large Growth Index went up 2.94% while the Standard and Poor’s 500 Index went down 2.33%. The Fund out-performed its benchmarks, the Russell 3000 Growth Index (up 1.21%, dividends omitted) and The Dow Jones Islamic Market US Index (up 1.96%, dividends omitted).
The excellent performance of the Fund occurred in spite of the market turbulence towards the end of the six-month reporting period. We believe this performance was due to our fine stock selection and disciplined investment process. We believe our strategy of over-weighing energy, health care and technology sectors helped considerably. Moreover the avoidance of financial stocks, which faced a severe decline due to the mortgage crisis, came in handy to boost the Fund performance.
The U. S. stock market is now focused on the credit and housing markets and fear of recession. We are carefully watching these issues as well as Fed actions, the possible enacting of a stimulus, oil prices, consumer sentiment, the labor market and the changing value of the dollar against major currencies. We are positioning the Fund to potentially benefit from changes in these factors and other emerging trends. Many analysts do not think a recession, if it occurs, will be a severe one. Moreover, the recent stock decline in early 2008 was not from a very high valuation. Therefore many analysts do not think further decline in stocks will be a severe one. As stocks tend to reflect future outlooks, they often start going up by the time a recession is formally acknowledged and before it ends. So, hopefully the worst may be behind us.
By investing in the Dow Jones Islamic Fund, you acquire a slice of a highly diversified portfolio exceeding 150 companies in a variety of industries. We will continue our rigorous search to find what we believe are the best stocks that also meet Islamic principles, so Muslims can adhere to their faith while encouraging better business ethics.
We, at the Dow Jones Islamic Fund, are committed to be prudent and diligent in investing the money you entrust with us. Your Fund will continue to adhere to the highest standard of integrity and act at all times in the best interest of shareholders. Let us thank you again for your trust and confidence in the Dow Jones Islamic Fund. If you have any questions, please do not hesitate to call us at (877) 417-6161.
Respectfully,
Dr. Bassam Osman
President, Dow Jones Islamic Fund
DOW JONES ISLAMIC FUND
Past performance does not guarantee future results.
The above discussion and analysis of the Fund reflect the opinions of the Advisor as of January 2008, are subject to change, and any forecasts made cannot be guaranteed. Investment performance reflects fee waivers in effect. In the absence of such waivers, total return would be reduced.
Mutual Fund investing involves risk; principal loss is possible. The Fund invests in foreign securities which involve greater volatility and political, economic and currency risks and differences in accounting methods. It is possible that the Islamic Shari’ah restrictions placed on investments and reflected in the main investment strategies may result in the Fund not performing as well as mutual funds not subject to such restrictions.
The Dow Jones Islamic Market USA Index is a diversified compilation of U.S. equity securities considered by the Shari’ah Supervisory Board of Dow Jones to be in compliance with Islamic principles. The Russell 3000 Growth Index measures the performance of those Russell 3000 Index companies with higher price-to-book ratios and higher forecasted growth values. The performance of the Dow Jones Islamic Market USA Index and the Russell 3000 Growth Index do not include the reinvestment of dividends. The Morningstar Large Cap Growth Index measures the performance of large-cap stocks that are expected to grow at a faster pace than the rest of the market as measured by forward earnings, historical earnings, book value, cash flow and sales. The S&P 500 Index is a broad based unmanaged index of 500 stocks, which is widely recognized as representative of the equity market in general. You cannot invest directly in an index.
(01/08)
DOW JONES ISLAMIC FUND
EXPENSE EXAMPLE
November 30, 2007 (Unaudited)
As a shareholder of the Fund, you incur two types of costs: (1) transaction costs and (2) ongoing costs, including management fees and other Fund expenses. This Example is intended to help you understand your ongoing costs (in dollars) of investing in the Fund and to compare these costs with the ongoing costs of investing in other mutual funds. The Example is based on an investment of $1,000 invested at the beginning of the period and held for the entire period (06/01/07 - 11/30/07).
Actual Expenses
The first line of the table below provides information about actual account values and actual expenses. Although the Fund charges no sales load or transaction fees, you will be assessed fees for outgoing wire transfers, returned checks and stop payment orders at prevailing rates charged by U.S. Bancorp Fund Services, LLC, the Fund’s transfer agent. If you request a redemption be made by wire transfer, currently a $15.00 fee is charged by the Fund’s transfer agent. IRA accounts will be charged a $15.00 annual maintenance fee. The example below includes, but is not limited to, management fees, fund accounting, custody and transfer agent fees. However, the example below does not include portfolio trading commissions and related expenses, and other extraordinary expenses as determined under generally accepted accounting principles. You may use the information in this line, together with the amount you invested, to estimate the expenses that you paid over the period. Simply divide your account value by $1,000 (for example, an $8,600 account value divided by $1,000 = 8.6), then multiply the result by the number in the first line under the heading entitled “Expenses Paid During Period” to estimate the expenses you paid on your account during this period.
Hypothetical Example for Comparison Purposes
The second line of the table below provides information about hypothetical account values and hypothetical expenses based on the Fund’s actual expense ratio and an assumed rate of return of 5% per year before expenses, which is not the Fund’s actual return. The hypothetical account values and expenses may not be used to estimate the actual ending account balance or expenses you paid for the period. You may use this information to compare the ongoing costs of investing in the Fund and other funds. To do so, compare this 5% hypothetical example with the 5% hypothetical examples that appear in the shareholder reports of the other funds. Please note that the expenses shown in the table are meant to highlight your ongoing costs only and do not reflect any transactional costs, such as sales charges (loads), redemption fees, or exchange fees. Therefore, the second line of the table is useful in comparing ongoing costs only, and will not help you determine the relative total costs of owning different funds. In addition, if these transactional costs were included, your costs would have been higher.
| | Beginning | Ending | Expenses Paid |
| | Account Value | Account Value | During Period |
| | 6/1/07 | 11/30/07 | 6/1/07 - 11/30/07* |
| Actual | $1,000.00 | $1,067.90 | $8.79 |
| Hypothetical (5% return before expenses) | 1,000.00 | 1,016.50 | 8.57 |
| * | Expenses are equal to the Fund’s annualized expense ratio of 1.70% multiplied by the average account value over the period multiplied by 183/366 (to reflect the one-half year period). |
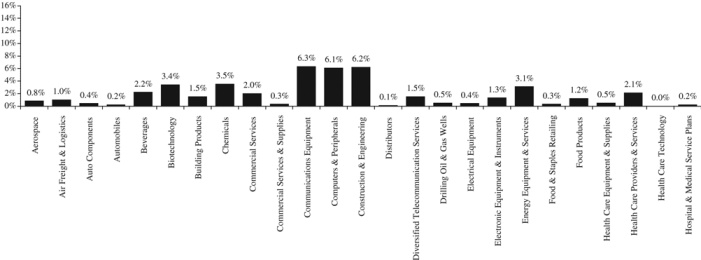
DOW JONES ISLAMIC FUND
ALLOCATION OF PORTFOLIO ASSETS
(Calculated as a percentage of net assets)
November 30, 2007 (Unaudited)
DOW JONES ISLAMIC FUND
Total Rate of Return
For the Period June 30, 2000 to November 30, 2007
(Unaudited)
This chart assumes an initial investment of $10,000 made on June 30, 2000 (SEC effective date). Performance reflects fee waivers in effect. In the absence of fee waivers, the total return would have been reduced.
Performance data quoted represents past performance and does not guarantee future results. The investment return and principal value of an investment will fluctuate so that an investor's shares, when redeemed, may be worth more or less that their original cost. Current performance of the fund may be lower than the performance quoted. Performance data current to the recent month end may be obtained by visiting www.investaaa.com.
The Fund invests in foreign securities which may involve greater volatility and political, economic and currency risks and differences in accounting methods. Indices mentioned are unmanaged and commonly used to measure U.S. and Foreign markets. You cannot invest directly in an index.
The graph and table do not reflect the deduction of taxes that a shareholder would pay on fund distributions or redemptions of fund shares.
| | | | | Since SEC |
| | Six | One | Five | Effective Date |
Average Annual Total Return as of November 30, 2007 | Months | Year | Year | June 30, 2000 |
| Dow Jones Islamic Fund | 6.79% | 15.83% | 11.13% | (0.81)% |
| Dow Jones Islamic Market USA Index* | 1.96% | 12.88% | 10.66% | (1.78)% |
| Russell 3000 Growth Index** | 1.89% | 12.19% | 9.69% | (4.26)% |
| * | The Dow Jones Islamic Market USA Index is a diversified compilation of U.S. equity securities considered by the Shari'ah Supervisory Board of Dow Jones to be in compliance with Islamic principles. The index is constructed from stocks in the Dow Jones Indexes (“DJGI”) family. Dow Jones believes that these stocks are accessible to investors and are well traded. The DJGI methodology removes issues that are not suitable for global investing. The performance of the Dow Jones Islamic Market USA Index does not include the reinvestment of dividends. |
| ** | The Russell 3000 Growth Index takes the largest 3,000 US companies based on market capitalization and measures the performance of those with higher price-to-book ratios and higher forecasted growth values. The average annual performance for the five year period ended November 30, 2007 and since SEC effective date of the Russell 3000 Growth Index does not include the reinvestment of dividends. |
DOW JONES ISLAMIC FUND
SCHEDULE OF INVESTMENTS
November 30, 2007 (Unaudited)
Number of | | | | Market | |
Shares | | | | Value | |
COMMON STOCKS - 99.0% | | | |
| | | AEROSPACE - 0.8% | | | |
| | 4,400 | | United Technologies Corp. | | $ | 328,988 | |
| | | | AIR FREIGHT & | | | | |
| | | | LOGISTICS - 1.0% | | | | |
| | 5,500 | | United Parcel Service, Inc. - Class B | | | 405,240 | |
| | | | AUTO COMPONENTS - 0.4% | | | | |
| | 4,000 | | LKQ Corp. (a) | | | 158,840 | |
| | | | AUTOMOBILES - 0.2% | | | | |
| | 1,200 | | Harley-Davidson, Inc. | | | 57,624 | |
| | | | BEVERAGES - 2.2% | | | | |
| | 8,500 | | The Coca-Cola Co. | | | 527,850 | |
| | 4,500 | | PepsiCo, Inc. | | | 347,310 | |
| | | | | | | 875,160 | |
| | | | BIOTECHNOLOGY - 3.4% | | | | |
| | 1,500 | | Amgen, Inc. (a) | | | 82,875 | |
| | 7,000 | | Celgene Corp. (a) | | | 430,850 | |
| | 2,000 | | Genentech, Inc. (a) | | | 152,500 | |
| | 13,500 | | Gilead Sciences, Inc. (a) | | | 628,290 | |
| | 500 | | Waters Corp. (a) | | | 39,020 | |
| | | | | | | 1,333,535 | |
| | | | BUILDING PRODUCTS - 1.5% | | | | |
| | 8,300 | | American Woodmark Corp. | | | 160,771 | |
| | 6,500 | | Apogee Enterprises, Inc. | | | 144,430 | |
| | 10,000 | | Simpson Manufacturing Co., Inc. | | | 266,100 | |
| | | | | | | 571,301 | |
| | | | CHEMICALS - 3.5% | | | | |
| | 4,000 | | Monsanto Co. | | | 397,480 | |
| | 2,000 | | Sigma-Aldrich Corp. | | | 105,300 | |
| | 8,000 | | Syngenta AG - ADR (b) | | | 396,400 | |
| | 18,000 | | W.R. Grace & Co. (a) | | | 486,180 | |
| | | | | | | 1,385,360 | |
| | | | COMMERCIAL | | | | |
| | | | SERVICES - 2.0% | | | | |
| | 3,500 | | Barrett Business Services, Inc. | | | 57,330 | |
| | 5,000 | | Career Education Corp. (a) | | | 143,650 | |
| | 15,000 | | Copart, Inc. (a) | | | 560,400 | |
| | | | | | | 761,380 | |
| | | | COMMERCIAL SERVICES & | | | | |
| | | | SUPPLIES - 0.3% | | | | |
| | 2,000 | | CoStar Group Inc. (a) | | | 96,380 | |
| | | | COMMUNICATIONS | | | | |
| | | | EQUIPMENT - 6.3% | | | | |
| | 15,000 | | Cisco Systems, Inc. (a) | | | 420,300 | |
| | 19,000 | | Corning Incorporated | | | 461,510 | |
| | 9,000 | | Harmonic Inc. (a) | | | 93,330 | |
| | 28,000 | | Motorola, Inc. | | | 447,160 | |
| | 500 | | Plantronics, Inc. | | | 13,425 | |
| | 9,000 | | Research In Motion Ltd. (a)(b) | | | 1,024,380 | |
| | | | | | | 2,460,105 | |
| | | | COMPUTERS & | | | | |
| | | | PERIPHERALS - 6.1% | | | | |
| | 5,200 | | Apple Inc. (a) | | | 947,544 | |
| | 4,000 | | Dell Inc. (a) | | | 98,160 | |
| | 8,500 | | EMC Corp. (a) | | | 163,795 | |
| | 15,000 | | Hewlett-Packard Co. | | | 767,400 | |
| | 4,000 | | International Business | | | | |
| | | | Machines Corp. (IBM) | | | 420,720 | |
| | | | | | | 2,397,619 | |
| | | | CONSTRUCTION & | | | | |
| | | | ENGINEERING - 6.2% | | | | |
| | 7,000 | | Aecom Technology Corp. (a) | | | 186,130 | |
| | 4,000 | | Fluor Corp. | | | 588,680 | |
| | 4,000 | | Foster Wheeler Ltd. (a)(b) | | | 596,000 | |
| | 5,000 | | Granite Construction Inc. | | | 205,100 | |
| | 9,000 | | McDermott International, Inc. (a)(b) | | | 470,700 | |
| | 5,000 | | The Shaw Group Inc. (a) | | | 317,100 | |
| | 500 | | Vulcan Materials Co. | | | 44,400 | |
| | | | | | | 2,408,110 | |
| | | | DISTRIBUTORS - 0.1% | | | | |
| | 1,100 | | Genuine Parts Co. | | | 52,855 | |
The accompanying notes are an integral part of these financial statements.
DOW JONES ISLAMIC FUND
SCHEDULE OF INVESTMENTS (Continued)
November 30, 2007 (Unaudited)
Number of | | | | Market | |
Shares | | | | Value | |
COMMON STOCKS (CONTINUED) | | | |
| | | DIVERSIFIED | | | |
| | | TELECOMMUNICATION | | | |
| | | SERVICES - 1.5% | | | |
| | 7,766 | | Chunghwa Telecom | | | |
| | | | Co. Ltd. - ADR (b) | | $ | 154,776 | |
| | 20,000 | | Deutsche Telekom AG - ADR (b) | | | 441,000 | |
| | | | | | | 595,776 | |
| | | | DRILLING OIL & | | | | |
| | | | GAS WELLS - 0.5% | | | | |
| | 16,300 | | Pioneer Drilling Co. (a) | | | 194,133 | |
| | | | ELECTRICAL EQUIPMENT - 0.4% | | | | |
| | 1,000 | | The Genlyte Group, Inc. (a) | | | 94,250 | |
| | 700 | | Rockwell Automation, Inc. | | | 47,523 | |
| | | | | | | 141,773 | |
| | | | ELECTRONIC EQUIPMENT & | | | | |
| | | | INSTRUMENTS - 1.3% | | | | |
| | 3,300 | | Agilent Technologies, Inc. (a) | | | 124,839 | |
| | 500 | | AVX Corp. | | | 7,165 | |
| | 500 | | Jabil Circuit, Inc. | | | 8,475 | |
| | 3,000 | | ScanSource, Inc. (a) | | | 105,840 | |
| | 1,500 | | Sunpower Corp. - Class A (a) | | | 186,660 | |
| | 2,000 | | Trimble Navigation Ltd. (a) | | | 74,140 | |
| | | | | | | 507,119 | |
| | | | ENERGY EQUIPMENT & | | | | |
| | | | SERVICES - 3.1% | | | | |
| | 2,000 | | Core Laboratories N.V. (a)(b) | | | 234,500 | |
| | 500 | | ENSCO International, Inc. | | | 26,925 | |
| | 2,000 | | GulfMark Offshore, Inc. (a) | | | 88,880 | |
| | 10,000 | | Helmerich & Payne, Inc. | | | 345,500 | |
| | 1,000 | | Noble Corp. (b) | | | 52,130 | |
| | 1,000 | | Patterson-UTI Energy, Inc. | | | 18,850 | |
| | 500 | | Rowan Companies, Inc. | | | 17,700 | |
| | 6,000 | | RPC, Inc. | | | 66,600 | |
| | 4,000 | | Schlumberger Ltd. (b) | | | 373,800 | |
| | | | | | | 1,224,885 | |
| | | | FOOD & STAPLES | | | | |
| | | | RETAILING - 0.3% | | | | |
| | 2,800 | | CVS Caremark Corp. | | | 112,252 | |
| | | | FOOD PRODUCTS - 1.2% | | | | |
| | 4,000 | | Lance, Inc. | | | 82,960 | |
| | 2,266 | | Nestle SA - ADR (b) | | | 272,450 | |
| | 4,000 | | Peet’s Coffee & Tea Inc. (a) | | | 106,880 | |
| | | | | | | 462,290 | |
| | | | HEALTH CARE | | | | |
| | | | EQUIPMENT & | | | | |
| | | | SUPPLIES - 0.5% | | | | |
| | 1,000 | | C.R. Bard, Inc. | | | 84,530 | |
| | 1,000 | | DENTSPLY International, Inc. | | | 42,780 | |
| | 1,000 | | Stryker Corp. | | | 72,630 | |
| | | | | | | 199,940 | |
| | | | HEALTH CARE PROVIDERS | | | | |
| | | | & SERVICES - 2.1% | | | | |
| | 1,650 | | Cardinal Health, Inc. | | | 99,907 | |
| | 6,500 | | Healthways, Inc. (a) | | | 379,405 | |
| | 1,100 | | IMS Health, Inc. | | | 25,685 | |
| | 1,000 | | Lincare Holdings, Inc. (a) | | | 34,190 | |
| | 10,000 | | Odyssey HealthCare, Inc. (a) | | | 100,000 | |
| | 7,000 | | PSS World Medical, Inc. (a) | | | 134,260 | |
| | 1,000 | | UnitedHealth Group, Inc. | | | 55,000 | |
| | | | | | | 828,447 | |
| | | | HEALTH CARE | | | | |
| | | | TECHNOLOGY - 0.0% | | | | |
| | 1,000 | | Hlth Corp. (a) | | | 13,990 | |
| | | | HOSPITAL & MEDICAL | | | | |
| | | | SERVICE PLANS - 0.2% | | | | |
| | 1,500 | | WellCare Health Plans Inc (a) | | | 58,365 | |
| | | | HOUSEHOLD | | | | |
| | | | DURABLES - 0.4% | | | | |
| | 10,050 | | Brookfield Homes Corp. | | | 169,443 | |
The accompanying notes are an integral part of these financial statements.
DOW JONES ISLAMIC FUND
SCHEDULE OF INVESTMENTS (Continued)
November 30, 2007 (Unaudited)
Number of | | | | Market | |
Shares | | | | Value | |
COMMON STOCKS (CONTINUED) | | | |
| | | HOUSEHOLD | | | |
| | | PRODUCTS - 2.1% | | | |
| | 2,000 | | Colgate-Palmolive Co. | | $ | 160,160 | |
| | 2,000 | | Kimberly-Clark Corp. | | | 139,620 | |
| | 7,000 | | Procter & Gamble Co. | | | 518,000 | |
| | | | | | | 817,780 | |
| | | | INDUSTRIAL | | | | |
| | | | CONGLOMERATES - 0.6% | | | | |
| | 3,000 | | 3M Co. | | | 249,780 | |
| | | | INTERNET & CATALOG | | | | |
| | | | RETAIL - 0.2% | | | | |
| | 2,000 | | eBay, Inc. (a) | | | 67,060 | |
| | | | INTERNET SOFTWARE & | | | | |
| | | | SERVICES - 4.0% | | | | |
| | 1,700 | | Google Inc. (a) | | | 1,178,100 | |
| | 14,000 | | Yahoo! Inc. (a) | | | 375,340 | |
| | | | | | | 1,553,440 | |
| | | | IT SERVICES - 1.1% | | | | |
| | 7,000 | | Automatic Data Processing, Inc. | | | 315,420 | |
| | 500 | | Convergys Corp. (a) | | | 8,155 | |
| | 1,200 | | Paychex, Inc. | | | 46,800 | |
| | 3,000 | | Western Union Co. | | | 67,800 | |
| | | | | | | 438,175 | |
| | | | MACHINERY - 3.0% | | | | |
| | 6,000 | | American Railcar Industries, Inc. | | | 92,280 | |
| | 3,500 | | Ampco-Pittsburgh Corp. | | | 123,270 | |
| | 2,000 | | Bucyrus International, Inc. - Class A | | | 175,420 | |
| | 7,500 | | CIRCOR International, Inc. | | | 325,425 | |
| | 2,200 | | Illinois Tool Works, Inc. | | | 122,100 | |
| | 7,500 | | The Manitowoc Company, Inc. | | | 328,875 | |
| | 500 | | Pall Corp. | | | 19,125 | |
| | | | | | | 1,186,495 | |
| | | | MANAGEMENT CONSULTING | | | | |
| | | | SERVICES - 2.0% | | | | |
| | 26,500 | | ABB Ltd - ADR (b) | | | 778,570 | |
| | | | MEDIA - 0.8% | | | | |
| | 9,600 | | Getty Images, Inc. (a) | | | 279,840 | |
| | 500 | | John Wiley & Sons, Inc. - Class A | | | 21,075 | |
| | | | | | | 300,915 | |
| | | | MEDICAL DEVICES - 0.8% | | | | |
| | 1,000 | | Intuitive Surgical, Inc. (a) | | | 327,680 | |
| | | | MEDICAL, DENTAL, AND | | | | |
| | | | HOSPITAL EQUIPMENT | | | | |
| | | | & SUPPLIES - 0.3% | | | | |
| | 23,000 | | HealthTronics Inc. (a) | | | 97,980 | |
| | | | METALS & MINING - 5.5% | | | | |
| | 3,000 | | AMCOL International Corp. | | | 113,940 | |
| | 6,000 | | Brush Engineered Materials Inc. (a) | | | 268,380 | |
| | 1,500 | | Compania de Minas | | | | |
| | | | Buenaventura S.A. - ADR (b) | | | 83,745 | |
| | 3,000 | | FNX Mining Company Inc. (a)(b) | | | 100,200 | |
| | 2,000 | | Freeport-McMoRan | | | | |
| | | | Copper & Gold, Inc. | | | 197,860 | |
| | 3,500 | | Haynes International, Inc. (a) | | | 295,785 | |
| | 5,000 | | Kaiser Aluminum Corporation | | | 355,700 | |
| | 9,000 | | Meridian Gold Inc. (a)(b) | | | 322,290 | |
| | 3,000 | | Schnitzer Steel Industries, | | | | |
| | | | Inc. - Class A | | | 187,260 | |
| | 20,000 | | Uranium Resources, Inc. (a) | | | 237,200 | |
| | | | | | | 2,162,360 | |
| | | | MULTILINE RETAIL - 0.5% | | | | |
| | 23,500 | | 99 Cents Only Stores (a) | | | 189,410 | |
| | | | OFFICE ELECTRONICS - 1.3% | | | | |
| | 9,500 | | CANON Inc. - ADR (b) | | | 499,890 | |
| | | | OIL & GAS - 10.1% | | | | |
| | 6,000 | | Arena Resources, Inc. (a) | | | 225,540 | |
| | 6,500 | | BG Group PLC - ADR (b) | | | 680,271 | |
| | 5,000 | | Bois d’ Arc Energy, Inc. (a) | | | 98,000 | |
| | 5,500 | | Chevron Corp. | | | 482,735 | |
| | 2,000 | | Cimarex Energy Co. | | | 77,260 | |
| | 6,400 | | EOG Resources, Inc. | | | 529,792 | |
| | 11,000 | | Exxon Mobil Corporation | | | 980,760 | |
| | 2,000 | | Murphy Oil Corp. | | | 143,040 | |
The accompanying notes are an integral part of these financial statements.
DOW JONES ISLAMIC FUND
SCHEDULE OF INVESTMENTS (Continued)
November 30, 2007 (Unaudited)
Number of | | | | Market | |
Shares | | | | Value | |
COMMON STOCKS (CONTINUED) | | | |
| | | OIL & GAS (Continued) | | | |
| | 4,000 | | Plains Exploration & | | | |
| | | | Production Company (a) | | $ | 201,640 | |
| | 2,309 | | Royal Dutch Shell PLC - ADR (b) | | | 186,198 | |
| | 11,500 | | Tesco Corporation (a)(b) | | | 251,620 | |
| | 1,000 | | Total SA - ADR (b) | | | 80,920 | |
| | | | | | | 3,937,776 | |
| | | | PERSONAL PRODUCTS - 0.4% | | | | |
| | 1,600 | | Avon Products, Inc. | | | 65,680 | |
| | 11,000 | | Mannatech, Inc. | | | 69,410 | |
| | | | | | | 135,090 | |
| | | | PHARMACEUTICALS - 9.1% | | | | |
| | 5,600 | | Abbott Laboratories | | | 322,056 | |
| | 1,500 | | Alcon, Inc. (b) | | | 208,710 | |
| | 1,000 | | AstraZeneca PLC - ADR (b) | | | 47,380 | |
| | 6,500 | | Eli Lilly & Co. | | | 344,175 | |
| | 2,000 | | Forest Laboratories, Inc. (a) | | | 77,100 | |
| | 1,000 | | Genzyme Corp. (a) | | | 74,930 | |
| | 11,500 | | GlaxoSmithKline PLC - ADR (b) | | | 605,820 | |
| | 3,000 | | Johnson & Johnson | | | 203,220 | |
| | 8,500 | | Merck & Co. Inc. | | | 504,560 | |
| | 5,000 | | Novartis AG - ADR (b) | | | 282,600 | |
| | 20,000 | | Pfizer, Inc. | | | 475,200 | |
| | 800 | | Roche Holding AG - ADR (b) | | | 76,347 | |
| | 2,400 | | Schering-Plough Corp. | | | 75,120 | |
| | 5,300 | | Wyeth | | | 260,230 | |
| | | | | | | 3,557,448 | |
| | | | ROAD & RAIL - 0.1% | | | | |
| | 2,000 | | Providence and | | | | |
| | | | Worcester Railroad Co. | | | 36,720 | |
| | | | SEMICONDUCTOR & | | | | |
| | | | SEMICONDUCTOR | | | | |
| | | | EQUIPMENT - 1.9% | | | | |
| | 500 | | Cree, Inc. (a) | | | 12,315 | |
| | 650 | | Integrated Device | | | | |
| | | | Technology, Inc. (a) | | | 7,884 | |
| | 13,500 | | Intel Corp. | | | 352,080 | |
| | 750 | | Microchip Technology, Inc. | | | 21,593 | |
| | 8,000 | | Micron Technology, Inc. (a) | | | 66,560 | |
| | 28,000 | | Taiwan Semiconductor | | | | |
| | | | Manufacturing Co. Ltd. - ADR (b) | | | 277,760 | |
| | 220 | | Verigy Ltd. (a)(b) | | | 5,573 | |
| | | | | | | 743,765 | |
| | | | SOFTWARE - 4.2% | | | | |
| | 1,690 | | Adobe Systems, Inc. (a) | | | 71,217 | |
| | 1,250 | | Electronic Arts, Inc. (a) | | | 70,237 | |
| | 750 | | Fair Isaac Corp. | | | 27,720 | |
| | 30,000 | | Microsoft Corp. | | | 1,008,000 | |
| | 2,000 | | Nintendo Co., Ltd - ADR (b) | | | 152,130 | |
| | 18,000 | | Symantec Corp. (a) | | | 320,400 | |
| | | | | | | 1,649,704 | |
| | | | SPECIALTY RETAIL - 3.3% | | | | |
| | 10,000 | | Bed Bath & Beyond, Inc. (a) | | | 314,500 | |
| | 2,500 | | Best Buy Co., Inc. | | | 127,625 | |
| | 20,000 | | Circuit City Stores, Inc. | | | 129,400 | |
| | 3,000 | | DSW Inc. - Class A (a) | | | 67,470 | |
| | 19,000 | | Foot Locker, Inc. | | | 247,950 | |
| | 6,000 | | O’Reilly Automotive, Inc. (a) | | | 197,160 | |
| | 6,000 | | Pacific Sunwear Of California (a) | | | 98,280 | |
| | 2,000 | | Ross Stores, Inc. | | | 52,760 | |
| | 6,500 | | Select Comfort Corp. (a) | | | 69,160 | |
| | | | | | | 1,304,305 | |
| | | | TEXTILES, APPAREL & | | | | |
| | | | LUXURY GOODS - 0.6% | | | | |
| | 1,000 | | Coach, Inc. (a) | | | 37,140 | |
| | 2,000 | | Gildan Activewear Inc. (a)(b) | | | 76,280 | |
| | 1,000 | | Liz Claiborne, Inc. | | | 25,090 | |
| | 1,500 | | Nike, Inc. - Class B | | | 98,475 | |
| | | | | | | 236,985 | |
The accompanying notes are an integral part of these financial statements.
DOW JONES ISLAMIC FUND
SCHEDULE OF INVESTMENTS (Continued)
November 30, 2007 (Unaudited)
Number of | | | | Market | |
Shares | | | | Value | |
COMMON STOCKS (CONTINUED) | | | |
| | | WIRELESS | | | |
| | | TELECOMMUNICATION | | | |
| | | SERVICES - 1.6% | | | |
| | 3,500 | | China Mobile Limited - ADR (b) | | $ | 320,810 | |
| | 7,875 | | Vodafone Group Plc - ADR (b) | | | 293,344 | |
| | | | | | | 614,154 | |
| | | | TOTAL COMMON STOCKS | | | | |
| | | | (Cost $35,088,341) | | | 38,686,392 | |
| | | | Total Investments - 99.0% | | | | |
| | | | (Cost $35,088,341) | | | 38,686,392 | |
| | | | Other Assets in | | | | |
| | | | Excess of Liabilities 1.0% | | | 436,634 | |
| | | | TOTAL NET ASSETS 100.0% | | $ | 39,123,026 | |
ADR - American Depositary Receipt
| (b) | Foreign Issued Securities |
The accompanying notes are an integral part of these financial statements.
DOW JONES ISLAMIC FUND
STATEMENT OF ASSETS AND LIABILITIES
November 30, 2007 (Unaudited)
Assets: | | | |
| Investments in securities, at market value (cost: $35,088,341) | | $ | 38,686,392 | |
| Cash | | | 271,960 | |
| Receivable for Fund shares sold | | | 4,660 | |
| Dividends receivable | | | 50,347 | |
| Receivable for investments sold | | | 330,541 | |
| Receivable from Advisor | | | 9,962 | |
| Other assets | | | 12,986 | |
Total Assets | | | 39,366,848 | |
| | | | | |
Liabilities: | | | | |
| Payable for investments purchased | | | 176,870 | |
| Accrued expenses and other liabilities | | | 66,952 | |
Total Liabilities | | | 243,822 | |
Net Assets | | $ | 39,123,026 | |
| | | | | |
Net Assets Consist of: | | | | |
| Paid-in capital | | $ | 35,806,706 | |
| Accumulated net realized loss on investments | | | (281,732 | ) |
| Unrealized appreciation on investments | | | 3,598,051 | |
Net Assets | | $ | 39,123,026 | |
| | | | | |
| Shares of beneficial interest outstanding (unlimited number of shares authorized, no par value) | | | 4,141,278 | |
Net asset value, redemption price and offering price per share | | $ | 9.45 | |
The accompanying notes are an integral part of these financial statements.
DOW JONES ISLAMIC FUND
STATEMENT OF OPERATIONS
| | | For the | |
| | | Six Months Ended | |
| | | November 30, 2007 | |
| | | (Unaudited) | |
Investment income: | | | |
| Dividend Income (net of foreign tax withheld of $5,070) | | $ | 193,245 | |
Expenses: | | | | |
| Advisory fees | | | 136,735 | |
| Shareholder servicing and accounting fees | | | 35,502 | |
| Registration fees | | | 23,790 | |
| Professional fees | | | 21,777 | |
| Administration fees | | | 19,947 | |
| Reports to shareholders | | | 2,928 | |
| Custody fees | | | 1,830 | |
| Miscellaneous expenses | | | 1,281 | |
Total expenses | | | 243,790 | |
| Expenses recaptured by Advisor (Note 3) | | | 20,393 | |
Net expenses | | | 264,183 | |
Net investment loss | | | (70,938 | ) |
Net realized and unrealized gain (loss): | | | | |
| Net realized gain on investments | | | 3,290,992 | |
| Change in unrealized appreciation/depreciation on investments | | | (782,731 | ) |
Net realized and unrealized gain on investments | | | 2,508,261 | |
Net increase in net assets from operations | | $ | 2,437,323 | |
The accompanying notes are an integral part of these financial statements.
DOW JONES ISLAMIC FUND
STATEMENTS OF CHANGES IN NET ASSETS
| | | Six Months Ended | | | | |
| | | November 30, 2007 | | | Year Ended | |
| | | (Unaudited) | | | May 31, 2007 | |
Operations: | | | | | | |
| Net investment loss | | $ | (70,938 | ) | | $ | (38,019 | ) |
| Net realized gain on investments | | | 3,290,992 | | | | 832,960 | |
| Change in unrealized appreciation on investments | | | (782,731 | ) | | | 4,795,920 | |
Net increase in net assets from operations | | | 2,437,323 | | | | 5,590,861 | |
| | | | | | | | | |
Capital share transactions (Note 4): | | | | | | | | |
| Shares sold | | | 2,841,780 | | | | 4,300,467 | |
| Reinvested dividends | | | — | | | | — | |
| Shares redeemed | | | (1,345,653 | ) | | | (1,501,599 | ) |
Net increase in net assets from capital shares transactions | | | 1,496,127 | | | | 2,798,868 | |
| | | | | | | | | |
Total increase in net assets | | | 3,933,450 | | | | 8,389,729 | |
| | | | | | | | | |
Net assets at beginning of period | | | 35,189,576 | | | | 26,799,847 | |
Net assets at end of period | | $ | 39,123,026 | | | $ | 35,189,576 | |
The accompanying notes are an integral part of these financial statements.
DOW JONES ISLAMIC FUND
FINANCIAL HIGHLIGHTS
Per Share Data for a Share Outstanding Throughout each Period
| | | Six Months | | | | | | | | | | | | | | | | |
| | | Ended | | | | | | | | | | | | | | | | |
| | | November 30, | | | Year Ended May 31, | |
| | | 2007 | | | | | | | | | | | | 2004 | | | 2003 | |
| | | (Unaudited) | | | 2007 | | | 2006 | | | 2005 | | | Class K(4) | | | Class K | |
Net asset value, | | | | | | | | | | | | | | | | | | |
Beginning of Period | | $ | 8.84 | | | $ | 7.37 | | | $ | 6.97 | | | $ | 6.64 | | | $ | 5.73 | | | $ | 6.26 | |
| | | | | | | | | | | | | | | | | | | | | | | | | |
Income (loss) from | | | | | | | | | | | | | | | | | | | | | | | | |
investment operations: | | | | | | | | | | | | | | | | | | | | | | | | |
| Net investment income (loss) | | | (0.02 | )(1) | | | (0.01 | )(1) | | | (0.02 | )(1) | | | 0.02 | (1) | | | (0.02 | )(2) | | | 0.02 | (2) |
| Net realized and unrealized | | | | | | | | | | | | | | | | | | | | | | | | |
| gains (losses) on investments | | | 0.63 | | | | 1.48 | | | | 0.43 | | | | 0.32 | | | | 0.94 | | | | (0.54 | ) |
| Total from | | | | | | | | | | | | | | | | | | | | | | | | |
| Investment Operations | | | 0.61 | | | | 1.47 | | | | 0.41 | | | | 0.34 | | | | 0.92 | | | | (0.52 | ) |
| | | | | | | | | | | | | | | | | | | | | | | | | |
Less distributions paid: | | | | | | | | | | | | | | | | | | | | | | | | |
| From net investment income | | | — | | | | — | | | | (0.01 | ) | | | (0.01 | ) | | | (0.01 | ) | | | (0.01 | ) |
| Total distributions paid | | | — | | | | — | | | | (0.01 | ) | | | (0.01 | ) | | | (0.01 | ) | | | (0.01 | ) |
| | | | | | | | | | | | | | | | | | | | | | | | | |
Net asset value, End of period | | $ | 9.45 | | | $ | 8.84 | | | $ | 7.37 | | | $ | 6.97 | | | $ | 6.64 | | | $ | 5.73 | |
| | | | | | | | | | | | | | | | | | | | | | | | | |
| Total Return | | | 6.79 | % | | | 19.95 | % | | | 5.93 | % | | | 5.10 | % | | | 16.07 | % | | | (8.22 | )% |
| | | | | | | | | | | | | | | | | | | | | | | | | |
| Net assets at end of period (000’s) | | $ | 39,078 | | | $ | 35,190 | | | $ | 26,800 | | | $ | 23,697 | | | $ | 21,439 | | | $ | 18,070 | |
| | | | | | | | | | | | | | | | | | | | | | | | | |
Ratio of expenses to average net assets: | | | | | | | | | | | | | | | | | | | | | | | | |
| Before waiver and | | | | | | | | | | | | | | | | | | | | | | | | |
| expense reimbursement | | | 1.59 | % | | | 1.52 | % | | | 1.63 | % | | | 1.72 | % | | | 1.99 | % | | | 2.25 | % |
| After waiver and | | | | | | | | | | | | | | | | | | | | | | | | |
| expense reimbursement | | | 1.70 | % | | | 1.67 | % | | | 1.57 | % | | | 1.50 | % | | | 1.47 | % | | | 0.95 | % |
| | | | | | | | | | | | | | | | | | | | | | | | | |
Ratio of net investment | | | | | | | | | | | | | | | | | | | | | | | | |
income (loss) to average net assets: | | | | | | | | | | | | | | | | | | | | | | | | |
| Before expense reimbursement | | | (0.53 | )% | | | 0.02 | % | | | (0.29 | )% | | | 0.12 | % | | | (0.77 | )% | | | (0.94 | )% |
| After expense reimbursement | | | (0.64 | )% | | | (0.13 | )% | | | (0.23 | )% | | | 0.34 | % | | | (0.25 | )% | | | 0.36 | % |
| Portfolio turnover rate | | | 76.8% | | | | 32.2% | | | | 0.9% | | | | 4.0% | | | | 4.5% | (3) | | | 5.1% | (3) |
| (1) | Net investment income (loss) per share is calculated using ending balances prior to consideration of adjustments for permanent book and tax differences. |
| (2) | Net investment income (loss) per share is based on daily average shares outstanding. |
| (3) | Calculated on basis of the Fund as a whole without distinguishing between classes of shares issued. |
| (4) | Effective October 30, 2003, the Trust terminated Class M shares; leaving one class of shares. |
The accompanying notes are an integral part of these financial statements.
DOW JONES ISLAMIC FUND
NOTES TO THE FINANCIAL STATEMENTS
November 30, 2007 (Unaudited)
1. Organization
Allied Asset Advisors Funds (the “Trust”), an open-end management investment company, was organized as a Delaware statutory trust on January 14, 2000. The Trust currently offers one series of shares to investors, the Dow JonesSM Islamic Fund (f/k/a Dow Jones Islamic Index Fund) (the “Fund”), a diversified series of the Trust. Allied Asset Advisors, Inc. (“AAA”or the “Advisor”), a Delaware corporation, serves as investment advisor to the Fund.
The Trust is authorized to issue an unlimited number of shares without par value, of each series. The Trust currently offers one class of shares of the Fund.
The investment objective of the Fund is to seek growth of capital while adhering to Islamic principles. To achieve the investment objective, under normal circumstances, the Fund invests at least 80% of its net assets in domestic and foreign securities included in the Dow Jones Islamic Market IndexesSM, as well as up to 20% of its net assets in securities chosen by the Fund’s investment advisor that meet Islamic principles. Prior to October 1, 2003, the Fund’s investment objective was to match the total return of the Dow Jones Islamic Market USA IndexSM (the “Index”) by investing substantially all of its assets in roughly the same proportions as the stocks were represented in the Index.
2. Significant Accounting Policies
The following is a summary of significant accounting policies consistently followed by the Fund in the preparation of its financial statements. These policies are in conformity with accounting principles generally accepted in the United States of America (“GAAP”).
Use of Estimates: In preparing the financial statements in conformity with accounting principles generally accepted in the United States of America, management is required to make estimates and assumptions that affect the reported amounts of assets and liabilities and disclosure of contingent assets and liabilities as of the date of the financial statements and the reported amounts of increases and decreases in net assets from operations during the reporting period. Actual results could differ from these estimates.
Security Valuation: Investment securities are carried at value determined using the following valuation methods:
| • | Equity securities listed on a U.S. securities exchange or NASDAQ for which market quotations are readily available are valued at the last quoted sale price on the valuation date. |
| • | Options, futures, unlisted U.S. securities and listed U.S. securities not traded on the valuation date for which market quotations are readily available are valued at the most recent quoted bid price. The Fund did not hold any such securities during the six months ended November 30, 2007. |
| • | Securities or other assets for which market quotations are not readily available are valued at fair value as determined in good faith by the Advisor under direction of the Board of Trustees. |
In September 2006, the Financial Accounting Standards Board (“FASB”) issued Statement of Financial Accounting Standards (“SFAS”) No. 157, “Fair Value Measurements.” SFAS No. 157 defines fair value, establishes a framework for measuring fair value in accordance with GAAP, and expands disclosure about fair value measurements. SFAS No. 157 is effective for financial statements issued for fiscal years beginning after November 15, 2007. Management currently is evaluating the implications of SFAS No. 157, and its impact, if any, on the Fund’s financial statements has not yet been determined.
Foreign Securities: Investing in securities of foreign companies and foreign governments involves special risks and consideration not typically associated with investing in U.S. companies and the U.S. government. These risks include revaluation of currencies and future adverse political and economic developments. Moreover, securities of many foreign companies and foreign governments and their markets may be less liquid and their prices more volatile than those of securities of comparable U.S. companies and the U.S. government.
Federal Income Taxes: It is the Fund’s policy to comply with the requirements of the Internal Revenue Code applicable to regulated investment companies and the Fund intends to distribute all of its taxable income and net capital
DOW JONES ISLAMIC FUND
NOTES TO THE FINANCIAL STATEMENTS (Continued)
November 30, 2007 (Unaudited)
gains to shareholders. Therefore, no federal income tax provision is required.
The Fund adopted FASB Interpretation No. 48 “Accounting for Uncertainty in Income Taxes” (“FIN 48”), on November 30, 2007. FIN 48 provides guidance for how uncertain tax positions should be recognized, measured, presented and disclosed in the Fund’s financial statements. FIN 48 requires the evaluation of tax positions taken, or expected to be taken, in the course of preparing the Fund’s tax returns to determine whether the tax positions are “more-likely-than-not” of being sustained by the applicable tax authority. To the extent that a tax benefit of a position is not deemed to meet the more-likely-than-not threshold, the Fund would report an income tax expense in the statement of operations. As of November 30, 2007, FIN 48 did not result in an impact to the Fund’s financial statements.
The Fund intends to utilize provisions of the federal income tax laws which allow it to carry a realized capital loss forward for eight years following the year of the loss and offset such losses against any future realized capital gains. For the year ended May 31, 2007, the Fund utilized a capital loss carryover of $832,960. At May 31, 2007, the Fund had capital loss carryovers as follows:
Net Capital | | Capital Loss |
Loss Carryovers* | | Carryover Expiration |
| $ | 238,349 | | | 5/31/2009 |
| | 146,365 | | | 5/31/2010 |
| | 1,599,476 | | | 5/31/2011 |
| | 1,421,345 | | | 5/31/2012 |
| | 1,986 | | | 5/31/2013 |
| | 165,193 | | | 5/31/2014 |
| $ | 3,572,714 | | | |
| * | Capital gain distributions will resume in the future to the extent gains are realized in excess of the available carryforwards. |
As of May 31, 2007, the components of distributable earnings on a tax basis were as follows:
| Cost of investments | | $ | 30,323,395 | |
| Gross tax unrealized appreciation | | $ | 7,923,675 | |
| Gross tax unrealized depreciation | | | (3,542,441 | ) |
| Net tax unrealized appreciation | | $ | 4,381,234 | |
| Undistributed ordinary income | | | — | |
| Undistributed long-term capital gain | | | — | |
| Total distributable earnings | | $ | — | |
| Other accumulated losses | | | (3,572,714 | ) |
| Total accumulated losses | | $ | 808,520 | |
For the fiscal year ended May 31, 2007 undistributed net investment loss was decreased by $38,019, accumulated net realized losses were decreased by $332, and additional paid-in capital was decreased by $38,351.
The difference between book basis and tax basis unrealized and realized gains and losses is attributable primarily to the tax deferral of return of capital distribution adjustments and the deferral of losses relating to wash sale transactions.
Under current tax laws, losses realized after October 31 may be deferred and treated as occurring on the first business day of the following fiscal year. The Fund had no post-October losses for the fiscal year ended May 31, 2007.
Distributions to Shareholders: The Fund will distribute substantially all of the net investment income and net realized gains that it has realized on the sale of securities. These income and gains distributions will generally be paid once each year, on or before December 31. The character of distributions made during the year from net investment income or net realized gains may differ from the characterization for federal income tax purposes due to differences in the recognition of income, expense or gain items for financial reporting and tax reporting purposes. There were no distributions paid for the six months ended November 30, 2007 or for the year ended May 31, 2007.
Other: Security and shareholder transactions are recorded on the trade date. Realized gains and losses on sales of investments are calculated on the identified cost basis.
DOW JONES ISLAMIC FUND
NOTES TO THE FINANCIAL STATEMENTS (Continued)
November 30, 2007 (Unaudited)
Dividend income and distributions to shareholders are recorded on the ex-dividend date.
3. Investment Advisory Agreement
The Trust has an Investment Advisory Agreement (the “Agreement”) with the Advisor, with whom certain officers and Trustees of the Trust are affiliated, to furnish investment advisory services to the Fund. Under the terms of the Agreement, the Trust, on behalf of the Fund, compensates the Advisor for its management services at the annual rate of 0.75% of the Fund’s daily average net assets.
The Trust has a distribution agreement and a servicing agreement with Quasar Distributors, LLC (the “Distributor”).
Effective October 1, 2006, the Advisor began to waive or reimburse the Fund if the aggregate annual operating expenses exceeded 1.70% of average net assets.
Prior to October 1, 2006, the Advisor began to waive or reimburse the Fund if the aggregate annual operating expenses exceeded 1.60% of average net assets.
Prior to October 1, 2005, the Advisor began to waive or reimburse the Fund if the aggregate annual operating expenses exceeded 1.50% of average net assets for Class K (current class).
Prior to July 1, 2003, if the aggregate annual operating expenses exceeded 0.95% of average net assets for Class K shares, the Advisor waived or reimbursed the Fund for the amount of such excess. Prior to June 30, 2002, if the aggregate annual operating expenses exceeded 0.90% of average net assets for Class K shares, the Advisor waived or reimbursed the Fund for the amount of such excess.
The Advisor may recapture a portion of the amount waived or reimbursed, subject to Board approval, no later than the dates stated below:
For the six months ended November 30, 2007, the Fund had advisory expenses of $136,735 and at November 30, 2007, the Fund had $35,459 payable to the Advisor.
4. Capital Share Transactions
Transactions in shares of the Fund for the six months ended November 30, 2007, were as follows:
| | | Amount | | | Shares | |
| Shares sold | | $ | 2,841,780 | | | | 308,256 | |
| Shares redeemed | | | (1,345,653 | ) | | | (145,792 | ) |
| Net increase | | $ | 1,496,127 | | | | 162,464 | |
Shares Outstanding: | | | | | | | | |
| Beginning of period | | | | | | | 3,978,814 | |
| End of period | | | | | | | 4,141,278 | |
| Transactions in shares of the Fund for the year ended May 31, 2007, were as follows: | | | | | | | | |
| | | Amount | | | Shares | |
| Shares sold | | $ | 4,300,467 | | | | 529,965 | |
| Shares redeemed | | | (1,501,599 | ) | | | (188,422 | ) |
| Net increase | | $ | 2,798,868 | | | | 341,543 | |
Shares Outstanding: | | | | | | | | |
| Beginning of period | | | | | | | 3,637,271 | |
| End of period | | | | | | | 3,978,814 | |
5. Securities Transactions
During the six months ended November 30, 2007, the cost of purchases and proceeds from sales of investment securities, other than short-term investments were $29,433,410 and $27,954,493, respectively. There were no purchases or sales of U.S. government securities for the Fund.
6. Beneficial Ownership
The beneficial ownership, either directly or indirectly, of more than 25% of the voting securities of a fund creates a presumption of control of the fund, under Section 2(a)(9) of the Investment Company Act of 1940. As of November 30, 2007, the North American Islamic Trust (“NAIT”) held 70% of the Fund. NAIT is the parent company of the Advisor.
DOW JONES ISLAMIC FUND
ADDITIONAL INFORMATION
November 30, 2007
Proxy Voting Policies and Procedures (Unaudited)
A description of the policies and procedures that the Fund uses to determine how to vote proxies relating to portfolio securities is available without charge, upon request, by calling (877) 417-6161 or by accessing the Fund’s website at http://www.investaaa.com. Furthermore, you can obtain the description on the SEC’s website at http://www.sec.gov.
Proxy Voting Records for the 12-Month Period Ended June 30, 2007 (Unaudited)
Information regarding how the Fund voted proxies relating to portfolio securities during the most recent 12-month period ended June 30 is available without charge, upon request, by calling (877) 417-6161. Furthermore, you can obtain the Fund’s proxy voting records on the SEC’s website at http://www.sec.gov.
Availability of Quarterly Portfolio Schedule (Unaudited)
The Fund files its complete schedule of portfolio holdings with the SEC for the first and third quarters of each fiscal year on Form N-Q. The filing will be available, upon request, by calling (877) 417-6161. Furthermore, you will be able to obtain a copy of the filing on the SEC’s website at http://www.sec.gov beginning with the filing for the period ended August 31, 2004. The Fund’s Forms N-Q may also be reviewed and copied at the SEC’s Public Reference Room in Washington, DC, and information on the operation of the Public Reference Room may be obtained by calling (800) SEC-0330.
(This Page Intentionally Left Blank.)
INVESTMENT ADVISOR
Allied Asset Advisors, Inc.
Burr Ridge, Illinois
DISTRIBUTOR
Quasar Distributors, LLC
Milwaukee, Wisconsin
INDEPENDENT REGISTERED
PUBLIC ACCOUNTING FIRM
Cohen Fund Audit Services, Ltd.
Westlake, Ohio
ADMINISTRATOR, TRANSFER AGENT,
AND FUND ACCOUNTANT
U.S. Bancorp Fund Services, LLC
Milwaukee, Wisconsin
CUSTODIAN
U.S. Bank, N.A.
Milwaukee, Wisconsin
LEGAL COUNSEL
Bell, Boyd & Lloyd, LLP
Chicago, Illinois
This report has been prepared for shareholders and may be distributed to others only if preceded or accompanied by a current prospectus.
Item 2. Code of Ethics.
Not applicable for semi-annual reports.
Item 3. Audit Committee Financial Expert.
Not applicable for semi-annual reports.
Item 4. Principal Accountant Fees and Services.
Not applicable for semi-annual reports.
Item 5. Audit Committee of Listed Registrants.
Not applicable to open-end investment companies.
Item 6. Schedule of Investments.
Schedule of Investments is included as part of the report to shareholders filed under Item 1 of this Form.
Item 7. Disclosure of Proxy Voting Policies and Procedures for Closed-End Management Investment Companies.
Not applicable to open-end investment companies.
Item 8. Portfolio Managers of Closed-End Management Investment Companies.
Not applicable to open-end investment companies.
Item 9. Purchases of Equity Securities by Closed-End Management Investment Company and Affiliated Purchasers.
Not applicable to open-end investment companies..
Item 10. Submission of Matters to a Vote of Security Holders.
There have been no material changes to the procedures by which shareholders may recommend nominees to the Registrant’s board of directors/trustees.
Item 11. Controls and Procedures.
| (a) | The Registrant’s President/Chief Executive Officer and Treasurer/Chief Financial Officer have reviewed the Registrant's disclosure controls and procedures (as defined in Rule 30a-3(c) under the Investment Company Act of 1940 (the “Act”)) as of a date within 90 days of the filing of this report, as required by Rule 30a-3(b) under the Act and Rules 13a-15(b) or 15d-15(b) under the Securities Exchange Act of 1934. Based on their review, such officers have concluded that the disclosure controls and procedures are effective in ensuring that information required to be disclosed in this report is appropriately recorded, processed, summarized and reported and made known to them by others within the Registrant and by the Registrant’s service provider. |
| (b) | There were no significant changes in the Registrant's internal control over financial reporting (as defined in Rule 30a-3(d) under the Act) that occurred during the second fiscal quarter of the period covered by this report that has materially affected, or is reasonably likely to materially affect, the Registrant's internal control over financial reporting. |
Item 12. Exhibits.
(a) | (1) Any code of ethics or amendment thereto, that is subject of the disclosure required by Item 2, to the extent that the Registrant intends to satisfy Item 2 requirements through filing an exhibit. Not Applicable. |
(2) Certifications pursuant to Section 302 of the Sarbanes-Oxley Act of 2002. Filed herewith.
(3) Any written solicitation to purchase securities under Rule 23c-1 under the Act sent or given during the period covered by the report by or on behalf of the Registrant to 10 or more persons. Not applicable to open-end investment companies.
(b) | Certification pursuant to Section 906 of the Sarbanes-Oxley Act of 2002. Furnished herewith. |
SIGNATURES
Pursuant to the requirements of the Securities Exchange Act of 1934 and the Investment Company Act of 1940, the Registrant has duly caused this report to be signed on its behalf by the undersigned, thereunto duly authorized.
Allied Asset Advisors Funds
By /s/Bassam Osman
Bassam Osman, President
Date February 6, 2008
Pursuant to the requirements of the Securities Exchange Act of 1934 and the Investment Company Act of 1940, this report has been signed below by the following persons on behalf of the Registrant and in the capacities and on the dates indicated.
By /s/Bassam Osman
Bassam Osman, President
Date February 6, 2008
By /s/Mohammad Basheeruddin
Mohammad Basheeruddin, Treasurer
Date February 7, 2008