UNITED STATES
SECURITIES AND EXCHANGE COMMISSION
Washington, D.C. 20549
FORM N-CSR
CERTIFIED SHAREHOLDER REPORT OF REGISTERED
MANAGEMENT INVESTMENT COMPANIES
Investment Company Act file number 811-09821
Allied Asset Advisors Funds
(Exact name of registrant as specified in charter)
715 Enterprise Drive, Suite 100
Oak Brook, IL 60523
(Address of principal executive offices) (Zip code)
Bassam Osman
Allied Asset Advisors Funds
715 Enterprise Drive, Suite 100
Oak Brook, IL 60523
(Name and address of agent for service)
(877) 417-6161
Registrant's telephone number, including area code
Date of fiscal year end: May 31, 2017
Date of reporting period: November 30, 2016
Item 1. Reports to Stockholders.
Semi-Annual Report
November 30, 2016
(Unaudited)
Iman Fund
IMAN FUND
January 26, 2017
Dear Shareholder,
Assalamu Alaykum (Greetings of Peace),
We are pleased to report that Iman Fund (the Fund) did quite well in the six month period ending on November 30, 2016. The Fund returned 6.19% in that period while the Dow Jones Islamic Market USA Index (IMUS) went up 3.96% and the Dow Jones Islamic Market World Index (DJIM) increased by 1.68%. The Fund outperformed the blended return of these two indexes which went up by 2.82%, the Standard & Poor’s 500 Index which was up 6.01%, the Morningstar U.S. Large-Growth which increased by 2.82%, and the Lipper Multi-Cap Growth Funds which went up by 3.31% in the same period (Lipper classifies Iman Fund in that category.)
No one can persistently predict the short-term movement of the stock market, however stock investing over many years has rewarded investors well. Regardless of what’s transpiring in the macro-environment, Iman Fund takes a bottom-up approach, building our portfolio one company at a time. We are confident that our approach will continue to serve investors well.
We thank you for placing your trust in Iman Fund and look forward to work hard to prove worthy of your trust.
Very Truly Yours,
Bassam Osman, President
Past performance does not guarantee future results.
The above discussion and analysis of the Fund reflect the opinions of the Adviser as of January 2017, are subject to change and any forecasts made cannot be guaranteed and should not be considered investment advice.
Mutual Fund investing involves risk; principal loss is possible. The Fund invests in foreign securities which involve greater volatility and political, economic and currency risks and differences in accounting methods. Historically, the Adviser believes that the Islamic restrictions placed on the Fund have not adversely affected the Fund; however, it is possible that these restrictions may result in the Fund not performing as well as mutual funds not subject to such restrictions. Investments in smaller companies involve additional risk, such as limited liquidity and greater volatility.
The Dow Jones Islamic Market USA Index is a diversified compilation of U.S. equity securities considered by Dow Jones to be in compliance with Islamic principles. The Dow Jones Islamic Market World Index measures the global universe of investable equities considered by Dow Jones to be in compliance with Islamic principles. The S&P 500 Index is a broad based unmanaged index of 500 stocks, which is widely recognized as representative of the equity market in general. You cannot invest directly in an index.
The Morningstar U.S. Large-Growth Classification portfolios invest primarily in big U.S. companies that are projected to grow faster than other large-cap stocks. Stocks in the top 70% of the capitalization of the U.S. equity market are defined as large cap. Growth is defined based on fast growth (high growth rates for earnings, sales, book value, and cash flow) and high valuations (high price ratios and low dividend yields). Most of these portfolios focus on companies in rapidly expanding industries.
The Lipper Multi-Cap Growth Funds Classification includes funds that, by portfolio practice, invest in a variety of market capitalization ranges without concentrating 75% of their equity assets in any one market capitalization range over an extended period of time.
Fund holdings and sector allocations are subject to change and should not be considered a recommendation to buy or sell any security. For a complete list of Fund holdings, please refer to the Schedule of Investments included in this report.
IMAN FUND
EXPENSE EXAMPLE
November 30, 2016 (Unaudited)
As a shareholder of the Fund, you incur two types of costs: (1) transaction costs and (2) ongoing costs, including management fees and other Fund expenses. This Example is intended to help you understand your ongoing costs (in dollars) of investing in the Fund and to compare these costs with the ongoing costs of investing in other mutual funds. The Example is based on an investment of $1,000 invested at the beginning of the period and held for the entire period (6/1/2016 - 11/30/2016).
Actual Expenses
The first line of the table below provides information about actual account values and actual expenses. Although the Fund charges no sales load or transaction fees, you will be assessed fees for outgoing wire transfers, returned checks and stop payment orders at prevailing rates charged by U.S. Bancorp Fund Services, LLC, the Fund’s transfer agent. If you request a redemption be made by wire transfer, currently a $15.00 fee is charged by the Fund’s transfer agent. IRA accounts will be charged a $15.00 annual maintenance fee. The example below includes, but is not limited to, management fees, fund accounting, custody and transfer agent fees. However, the example below does not include portfolio trading commissions and related expenses, and other extraordinary expenses as determined under generally accepted accounting principles. You may use the information in this line, together with the amount you invested, to estimate the expenses that you paid over the period. Simply divide your account value by $1,000 (for example, an $8,600 account value divided by $1,000 = 8.6), then multiply the result by the number in the first line under the heading entitled “Expenses Paid During Period” to estimate the expenses you paid on your account during this period.
Hypothetical Example for Comparison Purposes
The second line of the table below provides information about hypothetical account values and hypothetical expenses based on the Fund’s actual expense ratio and an assumed rate of return of 5% per year before expenses, which is not the Fund’s actual return. The hypothetical account values and expenses may not be used to estimate the actual ending account balance or expenses you paid for the period. You may use this information to compare the ongoing costs of investing in the Fund and other funds. To do so, compare this 5% hypothetical example with the 5% hypothetical examples that appear in the shareholder reports of the other funds. Please note that the expenses shown in the table are meant to highlight your ongoing costs only and do not reflect any transactional costs, such as sales charges (loads), redemption fees, or exchange fees. Therefore, the second line of the table is useful in comparing ongoing costs only, and will not help you determine the relative total costs of owning different funds. In addition, if these transactional costs were included, your costs would have been higher. Please note that Iman Fund does not have any sales charge (loads), redemption fees, or exchange fees.
| | Beginning | Ending | Expenses Paid |
| | Account Value | Account Value | During Period |
| | 6/1/16 | 11/30/16 | 6/1/16 - 11/30/16* |
| Actual | $1,000.00 | $1,061.90 | $7.06 |
| Hypothetical (5% return before expenses) | 1,000.00 | 1,018.22 | 6.91 |
| * | Expenses are equal to the Fund’s annualized expense ratio of 1.37% multiplied by the average account value over the period multiplied by 183/365 (to reflect the one-half year period). |
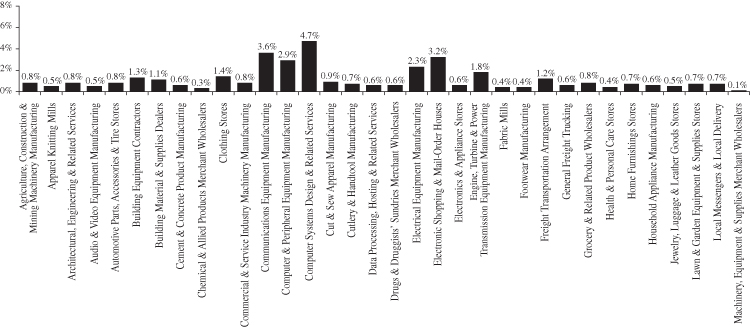
IMAN FUND
ALLOCATION OF PORTFOLIO ASSETS
(Calculated as a percentage of net assets)
November 30, 2016 (Unaudited)
IMAN FUND
Total Rate of Return
For the Period November 30, 2006 to November 30, 2016
(Unaudited)
This chart assumes an initial investment of $10,000 made on November 30, 2006 and held through November 30, 2016.
Performance data quoted represents past performance and does not guarantee future results. The investment return and principal value of an investment will fluctuate so that an investor’s shares, when redeemed, may be worth more or less than their original cost. Current performance of the Fund may be lower or higher than the performance quoted. Performance data current to the recent month end may be obtained by visiting www.investaaa.com.
Indices mentioned are unmanaged and used to measure stock markets. You cannot invest directly in an index.
The graph and table do not reflect the deduction of taxes that a shareholder would pay on Fund distributions or redemptions of Fund shares.
| | Six | One | Five | Ten |
| Average Annual Total Return as of November 30, 2016 | Months | Year | Years | Years |
| Iman Fund | 6.19% | 7.17% | 11.97% | 6.19% |
| Blended Dow Jones Islamic Market USA Index*/ | | | | |
| Dow Jones Islamic Market World Index** | 2.82% | 4.03% | 10.42% | 6.00% |
| * | The Dow Jones Islamic Market USA Index is a diversified compilation of U.S. equity securities considered by Dow Jones to be in compliance with Islamic principles. The index is constructed from stocks in the Dow Jones Indexes (DJGI) family. Dow Jones believes that these stocks are accessible to investors and are well traded. The DJGI methodology removes issues that are not suitable for global investing. Prior to July 31, 2013, the performance of the Dow Jones Islamic Market USA Index did not include the reinvestment of dividends. |
| ** | The Dow Jones Islamic Market World Index is a compilation of 56 country-level benchmark indexes considered by Dow Jones to be in compliance with Islamic principles. The index provides a definitive standard for measuring stock market performance for Islamic investors on a global basis, in accordance with Dow Jones Indexes’s established index methodology. Prior to April 30, 2008, the performance of the Dow Jones Islamic Market World Index did not include the reinvestment of dividends. |
IMAN FUND
SCHEDULE OF INVESTMENTS
November 30, 2016 (Unaudited)
(Classifications are based on the North American Industry Classification System)
| Number of | | | | | |
| Shares | | | | Value | |
| | |
| COMMON STOCKS - 97.2% | |
| | | | | | |
| | | AGRICULTURE, | | | |
| | | CONSTRUCTION & | | | |
| | | MINING MACHINERY | | | |
| | | MANUFACTURING - 0.8% | | | |
| | 10,800 | | The Toro Co. | | $ | 571,644 | |
| | | | | | | | |
| | | | APPAREL KNITTING MILLS - 0.5% | | | | |
| | 6,200 | | Columbia Sportswear Co. | | | 352,594 | |
| | | | | | | | |
| | | | ARCHITECTURAL, ENGINEERING | | | | |
| | | | & RELATED SERVICES - 0.8% | | | | |
| | 30,400 | | Callon Petroleum Co. (a) | | | 536,256 | |
| | | | | | | | |
| | | | AUDIO & VIDEO EQUIPMENT | | | | |
| | | | MANUFACTURING - 0.5% | | | | |
| | 8,200 | | Dolby Laboratories, Inc. - Class A | | | 378,430 | |
| | | | | | | | |
| | | | AUTOMOTIVE PARTS, | | | | |
| | | | ACCESSORIES & TIRE | | | | |
| | | | STORES - 0.8% | | | | |
| | 3,300 | | Advance Auto Parts, Inc. | | | 560,076 | |
| | | | | | | | |
| | | | BUILDING EQUIPMENT | | | | |
| | | | CONTRACTORS - 1.3% | | | | |
| | 13,600 | | EMCOR Group Inc. | | | 943,432 | |
| | | | | | | | |
| | | | BUILDING MATERIAL & | | | | |
| | | | SUPPLIES DEALERS - 1.1% | | | | |
| | 6,300 | | The Home Depot, Inc. | | | 815,220 | |
| | | | | | | | |
| | | | CEMENT & CONCRETE | | | | |
| | | | PRODUCT | | | | |
| | | | MANUFACTURING - 0.6% | | | | |
| | 4,400 | | Eagle Materials Inc. | | | 427,680 | |
| | | | | | | | |
| | | | CHEMICAL & ALLIED | | | | |
| | | | PRODUCTS MERCHANT | | | | |
| | | | WHOLESALERS - 0.3% | | | | |
| | 800 | | Acuity Brands, Inc. | | | 201,128 | |
| | | | | | | | |
| | | | CLOTHING STORES - 1.4% | | | | |
| | 3,800 | | The Children’s Place, Inc. | | | 394,630 | |
| | 19,000 | | Express, Inc. (a) | | | 253,840 | |
| | 4,600 | | Ross Stores, Inc. | | | 310,914 | |
| | | | | | | 959,384 | |
| | | | COMMERCIAL & SERVICE | | | | |
| | | | INDUSTRY MACHINERY | | | | |
| | | | MANUFACTURING - 0.8% | | | | |
| | 4,400 | | The Middleby Corp. (a) | | | 602,712 | |
| | | | | | | | |
| | | | COMMUNICATIONS | | | | |
| | | | EQUIPMENT | | | | |
| | | | MANUFACTURING - 3.6% | | | | |
| | 11,100 | | ADTRAN, Inc. | | | 225,885 | |
| | 6,600 | | NETGEAR, Inc. (a) | | | 354,420 | |
| | 24,000 | | QUALCOMM, Inc. | | | 1,635,120 | |
| | 24,300 | | RADWARE Ltd. (a)(b) | | | 325,863 | |
| | | | | | | 2,541,288 | |
| | | | | | | | |
| | | | COMPUTER & PERIPHERAL | | | | |
| | | | EQUIPMENT | | | | |
| | | | MANUFACTURING - 2.9% | | | | |
| | 18,800 | | Apple Inc. | | | 2,077,776 | |
| | | | | | | | |
| | | | COMPUTER SYSTEMS | | | | |
| | | | DESIGN & RELATED | | | | |
| | | | SERVICES - 4.7% | | | | |
| | 11,100 | | Accenture PLC - Class A (b) | | | 1,325,673 | |
| | 2,900 | | athenahealth, Inc. (a) | | | 274,340 | |
| | 5,130 | | Baidu, Inc. - ADR (a)(b) | | | 856,453 | |
| | 15,700 | | Cadence Design Systems, Inc. (a) | | | 412,596 | |
| | 2,900 | | Cerner Corp. (a) | | | 144,362 | |
| | 9,900 | | Convergys Corp. | | | 256,113 | |
| | 5,000 | | Perficient, Inc. (a) | | | 90,000 | |
| | | | | | | 3,359,537 | |
| | | | | | | | |
| | | | CUT & SEW APPAREL | | | | |
| | | | MANUFACTURING - 0.9% | | | | |
| | 11,700 | | lululemon athletica Inc. (a) | | | 666,783 | |
| | | | | | | | |
| | | | CUTLERY & HANDTOOL | | | | |
| | | | MANUFACTURING - 0.7% | | | | |
| | 3,050 | | Snap-on Incorporated | | | 509,960 | |
| | | | | | | | |
| | | | DATA PROCESSING, HOSTING | | | | |
| | | | & RELATED SERVICES - 0.6% | | | | |
| | 800 | | Automatic Data Processing, Inc. | | | 76,816 | |
| | 1,860 | | CoStar Group Inc. (a) | | | 355,465 | |
| | | | | | | 432,281 | |
The accompanying notes are an integral part of these financial statements.
IMAN FUND
SCHEDULE OF INVESTMENTS (Continued)
November 30, 2016 (Unaudited)
(Classifications are based on the North American Industry Classification System)
| Number of | | | | | |
| Shares | | | | Value | |
| | |
| COMMON STOCKS - 97.2% (Continued) | |
| | | | | | |
| | | DRUGS & DRUGGISTS’ | | | |
| | | SUNDRIES MERCHANT | | | |
| | | WHOLESALERS - 0.6% | | | |
| | 5,500 | | The Procter & Gamble Co. | | $ | 453,530 | |
| | | | | | | | |
| | | | ELECTRICAL EQUIPMENT | | | | |
| | | | MANUFACTURING - 2.3% | | | | |
| | 59,000 | | ABB Ltd. - ADR (b) | | | 1,205,370 | |
| | 1,500 | | AMETEK, Inc. | | | 71,025 | |
| | 20,400 | | Babcock & Wilcox | | | | |
| | | | Enterprises, Inc. (a) | | | 325,176 | |
| | | | | | | 1,601,571 | |
| | | | | | | | |
| | | | ELECTRONIC SHOPPING & | | | | |
| | | | MAIL-ORDER HOUSES - 3.2% | | | | |
| | 2,730 | | Amazon.com, Inc. (a) | | | 2,049,056 | |
| | 4,000 | | Copart, Inc. (a) | | | 218,880 | |
| | | | | | | 2,267,936 | |
| | | | | | | | |
| | | | ELECTRONICS & APPLIANCE | | | | |
| | | | STORES - 0.6% | | | | |
| | 9,900 | | Best Buy Co., Inc. | | | 452,430 | |
| | | | | | | | |
| | | | ENGINE, TURBINE & POWER | | | | |
| | | | TRANSMISSION EQUIPMENT | | | | |
| | | | MANUFACTURING - 1.8% | | | | |
| | 11,500 | | Brunswick Corp. | | | 576,380 | |
| | 5,000 | | Cummins, Inc. | | | 708,900 | |
| | | | | | | 1,285,280 | |
| | | | | | | | |
| | | | FABRIC MILLS - 0.4% | | | | |
| | 9,236 | | Culp, Inc. | | | 311,715 | |
| | | | | | | | |
| | | | FOOTWEAR | | | | |
| | | | MANUFACTURING - 0.4% | | | | |
| | 5,200 | | NIKE, Inc. - Class B | | | 260,364 | |
| | | | | | | | |
| | | | FREIGHT TRANSPORTATION | | | | |
| | | | ARRANGEMENT - 1.2% | | | | |
| | 900 | | C.H. Robinson Worldwide, Inc. | | | 67,365 | |
| | 15,200 | | Expeditors International | | | | |
| | | | of Washington, Inc. | | | 801,648 | |
| | | | | | | 869,013 | |
| | | | GENERAL FREIGHT | | | | |
| | | | TRUCKING - 0.6% | | | | |
| | 4,600 | | Old Dominion Freight Line, Inc. (a) | | | 401,580 | |
| | | | | | | | |
| | | | GROCERY & RELATED | | | | |
| | | | PRODUCT WHOLESALERS - 0.8% | | | | |
| | 13,600 | | Unilever PLC - ADR (b) | | | 543,728 | |
| | | | | | | | |
| | | | HEALTH & PERSONAL CARE | | | | |
| | | | STORES - 0.4% | | | | |
| | 12,700 | | Vitamin Shoppe, Inc. (a) | | | 315,595 | |
| | | | | | | | |
| | | | HOME FURNISHINGS | | | | |
| | | | STORES - 0.7% | | | | |
| | 32,200 | | Kirkland’s, Inc. (a) | | | 473,018 | |
| | | | | | | | |
| | | | HOUSEHOLD APPLIANCE | | | | |
| | | | MANUFACTURING - 0.6% | | | | |
| | 7,900 | | iRobot Corp. (a) | | | 450,300 | |
| | | | | | | | |
| | | | JEWELRY, LUGGAGE & | | | | |
| | | | LEATHER GOODS STORES - 0.5% | | | | |
| | 4,200 | | Tiffany & Co. | | | 346,416 | |
| | | | | | | | |
| | | | LAWN & GARDEN EQUIPMENT | | | | |
| | | | & SUPPLIES STORES - 0.7% | | | | |
| | 5,600 | | MSC Industrial Direct | | | | |
| | | | Co., Inc. - Class A | | | 500,304 | |
| | | | | | | | |
| | | | LOCAL MESSENGERS & | | | | |
| | | | LOCAL DELIVERY - 0.7% | | | | |
| | 4,500 | | United Parcel Service, | | | | |
| | | | Inc. (UPS) - Class B | | | 521,640 | |
| | | | | | | | |
| | | | MACHINERY, EQUIPMENT & | | | | |
| | | | SUPPLIES MERCHANT | | | | |
| | | | WHOLESALERS - 0.1% | | | | |
| | 230 | | W.W. Grainger, Inc. | | | 53,031 | |
| | | | | | | | |
| | | | MANAGEMENT, SCIENTIFIC & | | | | |
| | | | TECHNICAL CONSULTING | | | | |
| | | | SERVICES - 1.3% | | | | |
| | 5,900 | | Korn/Ferry International | | | 149,742 | |
| | 5,300 | | MAXIMUS, Inc. | | | 293,037 | |
| | 6,700 | | salesforce.com, Inc. (a) | | | 482,400 | |
| | | | | | | 925,179 | |
The accompanying notes are an integral part of these financial statements.
IMAN FUND
SCHEDULE OF INVESTMENTS (Continued)
November 30, 2016 (Unaudited)
(Classifications are based on the North American Industry Classification System)
| Number of | | | | | |
| Shares | | | | Value | |
| | |
| COMMON STOCKS - 97.2% (Continued) | |
| | | | | | |
| | | MANUFACTURING & | | | |
| | | REPRODUCING MAGNETIC & | | | |
| | | OPTICAL MEDIA - 0.4% | | | |
| | 10,400 | | National Instruments Corp. | | $ | 306,488 | |
| | | | | | | | |
| | | | MEDICAL EQUIPMENT | | | | |
| | | | & SUPPLIES | | | | |
| | | | MANUFACTURING - 6.3% | | | | |
| | 5,300 | | 3M Co. | | | 910,222 | |
| | 14,400 | | Baxter International Inc. | | | 638,928 | |
| | 1,660 | | C.R. Bard, Inc. | | | 349,513 | |
| | 11,500 | | Dentsply Sirona Inc. | | | 669,070 | |
| | 2,600 | | Edwards Lifesciences, Corp. (a) | | | 215,410 | |
| | 640 | | Intuitive Surgical, Inc. (a) | | | 411,994 | |
| | 3,900 | | Nevro Corp. (a) | | | 296,517 | |
| | 800 | | Stryker Corp. | | | 90,928 | |
| | 6,000 | | Teleflex Inc. | | | 887,580 | |
| | | | | | | 4,470,162 | |
| | | | | | | | |
| | | | METAL ORE MINING - 0.8% | | | | |
| | 9,600 | | Franco-Nevada Corp. (b) | | | 556,032 | |
| | | | | | | | |
| | | | MOTOR VEHICLE & | | | | |
| | | | MOTOR VEHICLE PARTS | | | | |
| | | | & SUPPLIES MERCHANT | | | | |
| | | | WHOLESALERS - 0.5% | | | | |
| | 1,250 | | O’Reilly Automotive, Inc. (a) | | | 343,125 | |
| | | | | | | | |
| | | | MOTOR VEHICLE BODY | | | | |
| | | | & TRAILER | | | | |
| | | | MANUFACTURING - 1.1% | | | | |
| | 40,900 | | Gentex Corp. | | | 756,241 | |
| | | | | | | | |
| | | | MOTOR VEHICLE | | | | |
| | | | MANUFACTURING - 0.5% | | | | |
| | 1,990 | | Tesla Motors, Inc. (a) | | | 376,906 | |
| | | | | | | | |
| | | | MOTOR VEHICLE PARTS | | | | |
| | | | MANUFACTURING - 1.4% | | | | |
| | 7,400 | | Honeywell International, Inc. | | | 843,156 | |
| | 3,300 | | Sun Hydraulics Corp. | | | 131,142 | |
| | | | | | | 974,298 | |
| | | | | | | | |
| | | | NAVIGATIONAL, MEASURING, | | | | |
| | | | ELECTROMEDICAL & | | | | |
| | | | CONTROL INSTRUMENTS | | | | |
| | | | MANUFACTURING - 2.2% | | | | |
| | 4,700 | | Agilent Technologies, Inc. | | | 206,706 | |
| | 5,000 | | Coherent, Inc. (a) | | | 652,500 | |
| | 570 | | Illumina, Inc. (a) | | | 75,890 | |
| | 6,900 | | MTS Systems Corp. | | | 371,565 | |
| | 6,000 | | NxStage Medical, Inc. (a) | | | 148,320 | |
| | 900 | | Varian Medical Systems, Inc. (a) | | | 80,847 | |
| | | | | | | 1,535,828 | |
| | | | | | | | |
| | | | NEWSPAPER, PERIODICAL, | | | | |
| | | | BOOK & DIRECTORY | | | | |
| | | | PUBLISHERS - 2.1% | | | | |
| | 84,486 | | RELX PLC - ADR (b) | | | 1,464,987 | |
| | | | | | | | |
| | | | OFFICE ADMINISTRATIVE | | | | |
| | | | SERVICES - 0.5% | | | | |
| | 3,700 | | Gartner, Inc. (a) | | | 380,434 | |
| | | | | | | | |
| | | | OFFICE FURNITURE | | | | |
| | | | (INCLUDING FIXTURES) | | | | |
| | | | MANUFACTURING - 0.8% | | | | |
| | 21,300 | | La-Z-Boy Incorporated | | | 569,775 | |
| | | | | | | | |
| | | | OIL & GAS EXTRACTION - 2.3% | | | | |
| | 3,700 | | Diamondback Energy Inc (a) | | | 399,045 | |
| | 3,300 | | EOG Resources, Inc. | | | 338,316 | |
| | 12,900 | | Occidental Petroleum Corp. | | | 920,544 | |
| | | | | | | 1,657,905 | |
| | | | | | | | |
| | | | OTHER ELECTRICAL | | | | |
| | | | EQUIPMENT & COMPONENT | | | | |
| | | | MANUFACTURING - 0.1% | | | | |
| | 900 | | Hubbell Incorporated | | | 101,052 | |
| | | | | | | | |
| | | | OTHER FINANCIAL | | | | |
| | | | INVESTMENT ACTIVITIES - 0.2% | | | | |
| | 2,091 | | Adient plc - ADR (a)(b) | | | 111,997 | |
| | | | | | | | |
| | | | OTHER GENERAL | | | | |
| | | | MERCHANDISE STORES - 0.6% | | | | |
| | 5,100 | | Dollar General Corporation | | | 394,332 | |
The accompanying notes are an integral part of these financial statements.
IMAN FUND
SCHEDULE OF INVESTMENTS (Continued)
November 30, 2016 (Unaudited)
(Classifications are based on the North American Industry Classification System)
| Number of | | | | | |
| Shares | | | | Value | |
| | |
| COMMON STOCKS - 97.2% (Continued) | |
| | | | | | |
| | | OTHER GENERAL | | | |
| | | PURPOSE MACHINERY | | | |
| | | MANUFACTURING - 0.2% | | | |
| | 2,100 | | Graco, Inc. | | $ | 170,583 | |
| | | | | | | | |
| | | | OTHER INFORMATION | | | | |
| | | | SERVICES - 4.9% | | | | |
| | 1,750 | | Alphabet Inc. - Class A (a) | | | 1,357,790 | |
| | 1,320 | | Alphabet Inc. - Class C (a) | | | 1,000,613 | |
| | 9,500 | | Facebook Inc. - Class A (a) | | | 1,124,990 | |
| | | | | | | 3,483,393 | |
| | | | | | | | |
| | | | OTHER LEATHER & ALLIED | | | | |
| | | | PRODUCT MANUFACTURING - 0.6% | | | | |
| | 11,700 | | Coach, Inc. | | | 425,763 | |
| | | | | | | | |
| | | | PAINT, COATING & ADHESIVE | | | | |
| | | | MANUFACTURING - 0.7% | | | | |
| | 5,100 | | PPG Industries, Inc. | | | 489,243 | |
| | | | | | | | |
| | | | PETROLEUM & COAL PRODUCTS | | | | |
| | | | MANUFACTURING - 3.1% | | | | |
| | 20,500 | | Exxon Mobil Corp. | | | 1,789,650 | |
| | 7,300 | | Valero Energy Corp. | | | 449,388 | |
| | | | | | | 2,239,038 | |
| | | | | | | | |
| | | | PHARMACEUTICAL & MEDICINE | | | | |
| | | | MANUFACTURING - 10.4% | | | | |
| | 8,300 | | Abbott Laboratories | | | 315,981 | |
| | 12,000 | | Alkermes PLC (a)(b) | | | 681,960 | |
| | 750 | | Allergan plc (a)(b) | | | 145,725 | |
| | 9,800 | | Alnylam Pharmaceuticals, Inc. (a) | | | 429,926 | |
| | 6,800 | | Bristol-Myers Squibb Co. | | | 383,792 | |
| | 2,400 | | IDEXX Laboratories, Inc. (a) | | | 282,360 | |
| | 4,400 | | Ionis Pharmaceuticals, Inc. (a) | | | 192,544 | |
| | 16,200 | | Johnson & Johnson (b) | | | 1,803,060 | |
| | 18,400 | | Merck & Co., Inc. | | | 1,125,896 | |
| | 30,400 | | Nektar Therapeutics (a) | | | 373,464 | |
| | 13,600 | | Novartis AG - ADR (b) | | | 935,136 | |
| | 300 | | Regeneron Pharmaceuticals, Inc. (a) | | | 113,772 | |
| | 6,800 | | Seattle Genetics, Inc. (a) | | | 440,708 | |
| | 2,300 | | Vertex Pharmaceuticals Inc. (a) | | | 187,703 | |
| | | | | | | 7,412,027 | |
| | | | | | | | |
| | | | PROFESSIONAL & | | | | |
| | | | COMMERCIAL EQUIPMENT | | | | |
| | | | & SUPPLIES MERCHANT | | | | |
| | | | WHOLESALERS - 0.8% | | | | |
| | 4,000 | | Henry Schein, Inc. (a) | | | 595,840 | |
| | | | | | | | |
| | | | RUBBER PRODUCT | | | | |
| | | | MANUFACTURING - 0.9% | | | | |
| | 5,600 | | Carlisle Companies Incorporated | | | 628,152 | |
| | | | | | | | |
| | | | SCHEDULED AIR | | | | |
| | | | TRANSPORTATION - 1.0% | | | | |
| | 15,400 | | Southwest Airlines Co. | | | 717,794 | |
| | | | | | | | |
| | | | SCIENTIFIC RESEARCH & | | | | |
| | | | DEVELOPMENT SERVICES - 1.0% | | | | |
| | 2,050 | | Biogen Idec Inc. (a) | | | 602,844 | |
| | 1,100 | | Incyte Corp. (a) | | | 112,519 | |
| | | | | | | 715,363 | |
| | | | | | | | |
| | | | SEMICONDUCTOR & OTHER | | | | |
| | | | ELECTRONIC COMPONENT | | | | |
| | | | MANUFACTURING - 6.9% | | | | |
| | 7,200 | | Amphenol Corp. - Class A | | | 491,472 | |
| | 1,100 | | Analog Devices, Inc. | | | 81,664 | |
| | 31,000 | | Applied Materials, Inc. | | | 998,200 | |
| | 5,683 | | Cavium, Inc. (a) | | | 324,101 | |
| | 24,600 | | Intel Corp. | | | 853,620 | |
| | 22,200 | | Intersil Corp. - Class A | | | 491,730 | |
| | 12,500 | | Jabil Circuit, Inc. | | | 264,375 | |
| | 14,800 | | Johnson Controls International plc | | | 665,704 | |
| | 8,700 | | Texas Instruments Inc. | | | 643,191 | |
| | 2,000 | | Xilinx, Inc. | | | 107,960 | |
| | | | | | | 4,922,017 | |
| | | | | | | | |
| | | | SOAP, CLEANING COMPOUND | | | | |
| | | | & TOILET PREPARATION | | | | |
| | | | MANUFACTURING - 0.2% | | | | |
| | 3,200 | | Church & Dwight Co, Inc. | | | 140,128 | |
| | | | | | | | |
| | | | SOFTWARE PUBLISHERS - 6.3% | | | | |
| | 6,000 | | ANSYS, Inc. (a) | | | 564,180 | |
| | 1,400 | | Intuit Inc. | | | 159,152 | |
| | 13,600 | | Mentor Graphics Corp. | | | 497,080 | |
| | 20,800 | | Microsoft Corp. | | | 1,253,408 | |
The accompanying notes are an integral part of these financial statements.
IMAN FUND
SCHEDULE OF INVESTMENTS (Continued)
November 30, 2016 (Unaudited)
(Classifications are based on the North American Industry Classification System)
| Number of | | | | | |
| Shares | | | | Value | |
| | |
| COMMON STOCKS - 97.2% (Continued) | |
| | | | | | |
| | | SOFTWARE | | | |
| | | PUBLISHERS - 6.3% (Continued) | | | |
| | 11,600 | | PTC, Inc. (a) | | $ | 565,036 | |
| | 5,200 | | Red Hat, Inc. (a) | | | 411,372 | |
| | 10,600 | | Synopsys, Inc. (a) | | | 641,088 | |
| | 2,900 | | Tyler Technologies, Inc. (a) | | | 431,810 | |
| | | | | | | 4,523,126 | |
| | | | | | | | |
| | | | TRAVEL ARRANGEMENT & | | | | |
| | | | RESERVATION SERVICES - 0.6% | | | | |
| | 280 | | The Priceline Group, Inc. (a) | | | 421,030 | |
| | | | | | | | |
| | | | WHOLESALE ELECTRONIC | | | | |
| | | | MARKETS & AGENTS | | | | |
| | | | & BROKERS - 0.6% | | | | |
| | 4,500 | | Genuine Parts Co. | | | 433,035 | |
| | | | TOTAL COMMON STOCKS | | | | |
| | | | (Cost $60,926,982) | | | 69,284,905 | |
| | |
| PREFERRED STOCK - 2.6% | |
| | | | | | | | |
| | | | WIRED TELECOMMUNICATIONS | | | | |
| | | | CARRIERS - 2.6% | | | | |
| | 139,800 | | Telefonica Brasil S.A. (b) | | | 1,824,390 | |
| | | | TOTAL PREFERRED STOCK | | | | |
| | | | (Cost $1,693,788) | | | 1,824,390 | |
| | | | Total Investments | | | | |
| | | | (Cost $62,620,770) - 99.8% | | | 71,109,295 | |
| | | | Other Assets in | | | | |
| | | | Excess of Liabilities - 0.2% | | | 167,596 | |
| | | | TOTAL NET ASSETS - 100.0% | | $ | 71,276,891 | |
Percentages are stated as a percent of net assets.
| ADR – American Depositary Receipt |
| (a) | Non Income Producing |
| (b) | Foreign Issued Securities |
The accompanying notes are an integral part of these financial statements.
IMAN FUND
STATEMENT OF ASSETS AND LIABILITIES
November 30, 2016 (Unaudited)
| Assets: | | | |
| Investments, at value (cost $62,620,770) | | $ | 71,109,295 | |
| Cash | | | 140,971 | |
| Receivable for investments sold | | | 734,781 | |
| Receivable for capital shares sold | | | 62,350 | |
| Dividends receivable | | | 168,605 | |
| Other assets | | | 15,022 | |
| Total Assets | | | 72,231,024 | |
| | | | | |
| Liabilities: | | | | |
| Payable for investments purchased | | | 803,662 | |
| Payable for capital shares redeemed | | | 750 | |
| Payable to Advisor (Note 3) | | | 57,258 | |
| Payable for professional fees | | | 41,237 | |
| Payable for Trustee fees | | | 1,140 | |
| Payable to Custodian | | | 1,439 | |
| Payable for reports to shareholders | | | 1,285 | |
| Accrued expenses and other liabilities | | | 47,362 | |
| Total Liabilities | | | 954,133 | |
| Net Assets | | $ | 71,276,891 | |
| | | | | |
| Net assets consist of: | | | | |
| Paid-in capital | | $ | 56,501,212 | |
| Accumulated net investment income | | | 123,191 | |
| Accumulated net realized gain on investments | | | 6,163,963 | |
| Net unrealized appreciation on investments | | | 8,488,525 | |
| Net Assets | | $ | 71,276,891 | |
| | | | | |
| Shares of beneficial interest outstanding | | | | |
| (unlimited number of shares authorized, no par value) | | | 6,020,226 | |
| Net asset value, redemption price and offering price per share | | $ | 11.84 | |
The accompanying notes are an integral part of these financial statements.
IMAN FUND
STATEMENT OF OPERATIONS
For the Six Months Ended November 30, 2016 (Unaudited)
| Investment income: | | | |
| Dividend income (Net of foreign withholding tax of $4,045) | | $ | 579,442 | |
| Total investment income | | | 579,442 | |
| | | | | |
| Expenses: | | | | |
| Advisory fees (Note 3) | | | 340,702 | |
| Administration fees | | | 32,105 | |
| Transfer agent fees and expenses | | | 30,168 | |
| Fund accounting fees | | | 17,107 | |
| Legal fees | | | 14,812 | |
| Federal and state registration fees | | | 11,693 | |
| Audit fees | | | 6,764 | |
| Trustees’ fees and related expenses | | | 5,140 | |
| Custody fees | | | 3,467 | |
| Reports to shareholders | | | 3,003 | |
| Other expenses | | | 664 | |
| Total expenses | | | 465,625 | |
| Net investment income | | | 113,817 | |
| | | | | |
| Realized and unrealized gain on investments: | | | | |
| Net realized gain from security transactions | | | 3,228,473 | |
| Change in net unrealized appreciation/depreciation on investments | | | 696,801 | |
| Realized and unrealized gain on investments | | | 3,925,274 | |
| Net increase in net assets from operations | | $ | 4,039,091 | |
The accompanying notes are an integral part of these financial statements.
IMAN FUND
STATEMENTS OF CHANGES IN NET ASSETS
| | | Six Months Ended | | | | |
| | | November 30, 2016 | | | Year Ended | |
| | | (Unaudited) | | | May 31, 2016 | |
| From operations: | | | | | | |
| Net investment income | | $ | 113,817 | | | $ | 18,210 | |
| Net realized gain on investments | | | 3,228,473 | | | | 2,974,184 | |
| Change in net unrealized appreciation/depreciation on investments | | | 696,801 | | | | (1,766,045 | ) |
| Net increase in net assets from operations | | | 4,039,091 | | | | 1,226,349 | |
| | | | | | | | | |
| From distributions: | | | | | | | | |
| Net realized gain on investments | | | — | | | | (2,930,010 | ) |
| Net decrease in net assets resulting | | | | | | | | |
| from distributions paid | | | — | | | | (2,930,010 | ) |
| | | | | | | | | |
| From capital share transactions: | | | | | | | | |
| Proceeds from sale of shares | | | 9,404,032 | | | | 8,464,219 | |
| Net asset value of shares issued in reinvestment | | | | | | | | |
| of distributions to shareholders | | | — | | | | 2,914,842 | |
| Payments for shares redeemed | | | (3,233,466 | ) | | | (17,048,574 | ) |
| Net increase (decrease) in net assets | | | | | | | | |
| from capital share transactions | | | 6,170,566 | | | | (5,669,513 | ) |
| | | | | | | | | |
| Total increase (decrease) in net assets | | | 10,209,657 | | | | (7,373,174 | ) |
| | | | | | | | | |
| Net assets: | | | | | | | | |
| Beginning of period | | | 61,067,234 | | | | 68,440,408 | |
| End of period (includes accumulated net investment | | | | | | | | |
| income of $123,191 and $9,374, respectively) | | $ | 71,276,891 | | | $ | 61,067,234 | |
The accompanying notes are an integral part of these financial statements.
IMAN FUND
FINANCIAL HIGHLIGHTS
Per Share Data for a Share Outstanding Throughout Each Period
| | | Six Months | | | | | | | | | | | | | | | | |
| | | Ended | | | | | | | | | | | | | | | | |
| | | November 30, | | | | |
| | | 2016 | | | Year Ended May 31, | |
| | | (Unaudited) | | | 2016 | | | 2015 | | | 2014 | | | 2013 | | | 2012 | |
| Net asset value, beginning of period | | $ | 11.15 | | | $ | 11.40 | | | $ | 11.59 | | | $ | 9.99 | | | $ | 8.35 | | | $ | 8.97 | |
| Income (loss) from | | | | | | | | | | | | | | | | | | | | | | | | |
| investment operations: | | | | | | | | | | | | | | | | | | | | | | | | |
Net investment income (loss)(1) | | | 0.02 | | | | 0.00 | (2) | | | (0.00 | )(2) | | | (0.01 | ) | | | (0.03 | ) | | | (0.05 | ) |
| Net realized and unrealized | | | | | | | | | | | | | | | | | | | | | | | | |
| gains (losses) on investments | | | 0.67 | | | | 0.22 | | | | 1.13 | | | | 2.02 | | | | 1.67 | | | | (0.57 | ) |
| Total from investment operations | | | 0.69 | | | | 0.22 | | | | 1.13 | | | | 2.01 | | | | 1.64 | | | | (0.62 | ) |
| Less distributions paid: | | | | | | | | | | | | | | | | | | | | | | | | |
| From net realized gain on investments | | | — | | | | (0.47 | ) | | | (1.32 | ) | | | (0.41 | ) | | | — | | | | — | |
| Total distributions paid | | | — | | | | (0.47 | ) | | | (1.32 | ) | | | (0.41 | ) | | | — | | | | — | |
| | | | | | | | | | | | | | | | | | | | | | | | | |
| Net asset value, end of period | | $ | 11.84 | | | $ | 11.15 | | | $ | 11.40 | | | $ | 11.59 | | | $ | 9.99 | | | $ | 8.35 | |
| | | | | | | | | | | | | | | | | | | | | | | | | |
| Total return | | | 6.19 | %(3) | | | 1.99 | % | | | 10.22 | % | | | 20.30 | % | | | 19.64 | % | | | (6.91 | )% |
| | | | | | | | | | | | | | | | | | | | | | | | | |
| Net assets at end of period (000’s) | | $ | 71,277 | | | $ | 61,067 | | | $ | 68,440 | | | $ | 59,221 | | | $ | 45,207 | | | $ | 36,123 | |
| | | | | | | | | | | | | | | | | | | | | | | | | |
| Ratio of expenses to average net assets | | | 1.37 | %(4) | | | 1.39 | % | | | 1.42 | % | | | 1.48 | % | | | 1.59 | % | | | 1.74 | % |
| | | | | | | | | | | | | | | | | | | | | | | | | |
| Ratio of net investment income (loss) | | | | | | | | | | | | | | | | | | | | | | | | |
| to average net assets | | | 0.33 | %(4) | | | 0.03 | % | | | (0.02 | )% | | | (0.09 | )% | | | (0.36 | )% | | | (0.65 | )% |
| | | | | | | | | | | | | | | | | | | | | | | | | |
| Portfolio turnover rate | | | 28.7 | %(3) | | | 70.6 | % | | | 72.0 | % | | | 71.7 | % | | | 109.5 | % | | | 96.9 | % |
| (1) | Net investment income (loss) per share is calculated using ending balances prior to consideration of adjustments for permanent book and tax differences. |
| (2) | Less than one cent per share. |
| (3) | Not Annualized. |
| (4) | Annualized. |
The accompanying notes are an integral part of these financial statements.
IMAN FUND
NOTES TO THE FINANCIAL STATEMENTS
November 30, 2016 (Unaudited)
Allied Asset Advisors Funds (the “Trust”), an open-end management investment company, was organized as a Delaware statutory trust on January 14, 2000. The Trust currently offers one series of shares to investors, the Iman Fund (the “Fund”), a diversified series of the Trust. Allied Asset Advisors, Inc. (“AAA” or the “Adviser”), a Delaware corporation, serves as investment adviser to the Fund.
The Trust is authorized to issue an unlimited number of shares without par value, of each series. The Trust currently offers one class of shares of the Fund.
The investment objective of the Fund is to seek growth of capital while adhering to Islamic principles. To achieve its investment objective, the Fund seeks investments that meet Islamic principles whose prices the Fund’s Adviser anticipates will increase over the long term. Under normal circumstances, the Fund invests its net assets in domestic and foreign securities chosen by the Adviser in accordance with Islamic principles. Islamic principles generally preclude investments in certain businesses (e.g., alcohol, pornography and gambling) and investments in interest bearing debt obligations. Any uninvested cash will be held in non-interest bearing deposits or invested in a manner following Islamic principles.
The Fund is an investment company and, accordingly, follows the investment company accounting and reporting guidance of the Financial Accounting Standards Board (“FASB”) Accounting Standards Codification Topic 946 Financial Services – Investment Companies.
| 2. | Significant Accounting Policies |
The following is a summary of significant accounting policies consistently followed by the Fund in the preparation of its financial statements. These policies are in conformity with accounting principles generally accepted in the United States of America (“GAAP”).
Use of Estimates: In preparing the financial statements in conformity with GAAP, management is required to make estimates and assumptions that affect the reported amounts of assets and liabilities and disclosure of contingent assets and liabilities as of the date of the financial statements and the reported amounts of increases and decreases in net assets from operations during the reporting period. Actual results could differ from these estimates.
Security Valuation: Investment securities are carried at fair value determined using the following valuation methods:
| • | Equity securities listed on a U.S. securities exchange or NASDAQ for which market quotations are readily available are valued at the last quoted sale price on the valuation date. |
| | |
| • | Options, futures, unlisted U.S. securities and listed U.S. securities not traded on the valuation date for which market quotations are readily available are valued at the most recent quoted bid price. The Fund did not hold any such securities during the six months ended November 30, 2016. |
| | |
| • | Securities or other assets for which market quotations are not readily available are valued at fair value as determined in good faith by the Adviser under direction of the Board of Trustees. |
The Fund has adopted fair valuation accounting standards which establish an authoritative definition of fair value and a three-tier hierarchy to distinguish between (1) inputs that reflect the assumptions market participants would use in pricing an asset or liability developed based on market data obtained from sources independent of the reporting entity (observable inputs) and (2) inputs that reflect the reporting entity’s own assumptions about the assumptions market participants would use in pricing an asset or liability developed based on the best information available in the circumstances (unobservable inputs) and to establish classification of fair value measurements for disclosure purposes.
Summary of Fair Value Exposure at November 30, 2016
The Trust has performed an analysis of all existing investments to determine the significance and character of all inputs to their fair value determination. Various inputs are used in determining the value of the Fund’s investments. These inputs are summarized in the three broad levels listed below:
| Level 1 - | Quoted prices in active markets for identical securities. |
IMAN FUND
NOTES TO THE FINANCIAL STATEMENTS (Continued)
November 30, 2016 (Unaudited)
| Level 2 - | Other significant observable inputs (including quoted prices for similar securities in active markets, quoted prices for identical or similar instruments in markets that are not active, model-derived valuations in which all significant inputs and significant value drivers are observable in active markets, interest rates, prepayment speeds, credit risk, etc.) |
| | |
| Level 3 - | Significant unobservable inputs (including the Fund’s own assumptions in determining the fair value of investments) |
Inputs that are used in determining a fair value of an investment may include price information, credit data, volatility statistics and other factors. These inputs can be either observable or unobservable. The availability of observable inputs can vary between investments and is affected by various factors such as the type of investment or similar investments in the marketplace. The inputs will be considered by the Adviser, along with any other relevant factors in the calculation of an investment’s fair value. The Fund uses prices and inputs that are current as of the measurement date, which may include periods of market dislocations. During these periods, the availability of prices and inputs may be reduced for many investments. This condition could cause an investment to be reclassified between the various levels within the hierarchy.
Investments falling into the Level 3 category are primarily supported by quoted prices from brokers and dealers participating in the market for those investments. However, these may be classified as Level 3 investments due to lack of market transparency and corroboration to support these quoted prices. Additionally, valuation models may be used as the pricing source for any remaining investments classified as Level 3. These models rely on one or more significant unobservable inputs and/or significant assumptions by the Adviser. Inputs used in valuations may include, but are not limited to, financial statement analysis, capital account balances, discount rates and estimated cash flows, and comparable company data.
The inputs or methodology used for valuing securities are not an indication of the risk associated with investing in those securities.
The following is a summary of the inputs used to value the Fund’s net assets as of November 30, 2016:
| | | Level 1 | | | Level 2 | | | Level 3 | | | Total | |
| Common Stocks | | $ | 69,284,905 | | | $ | — | | | $ | — | | | $ | 69,284,905 | |
| Preferred Stock | | | 1,824,390 | | | | — | | | | — | | | | 1,824,390 | |
| Total* | | $ | 71,109,295 | | | $ | — | | | $ | — | | | $ | 71,109,295 | |
| * | Additional information regarding the industry and/or geographical classification of these investments is disclosed in the Schedule of Investments. |
There were no transfers into or out of Level 1, Level 2 or Level 3 fair value measurements during the reporting period for the Fund, as compared to their classification from the most recent annual report. It is the Fund’s policy to consider transfers into or out of Level 1, Level 2 or Level 3 as of the end of the reporting period.
Foreign Securities: Investing in securities of foreign companies and foreign governments involves special risks and consideration not typically associated with investing in U.S. companies and the U.S. government. These risks include revaluation of currencies and future adverse political and economic developments. Moreover, securities of many foreign companies and foreign governments and their markets may be less liquid and their prices more volatile than those of securities of comparable U.S. companies and the U.S. government. The Fund does not invest in securities of U.S. or foreign governments.
Federal Income Taxes: It is the Fund’s policy to comply with the requirements of the Internal Revenue Code applicable to regulated investment companies, and the Fund intends to distribute all of its taxable income and net capital gains to shareholders. Therefore, no federal income tax provision is required.
As of and during the year ended May 31, 2016, the Fund did not have a liability for any unrecognized tax benefits. The Fund recognizes interest and penalties, if any, related to unrecognized tax benefits as other expenses in the Statement of Operations. During the year, the Fund did not incur any interest or penalties. The statute of limitations on the Fund’s tax returns remains open for the years ended May 31, 2013 through May 31, 2016.
IMAN FUND
NOTES TO THE FINANCIAL STATEMENTS (Continued)
November 30, 2016 (Unaudited)
As of May 31, 2016, the components of distributable earnings on a tax basis were as follows:
| Cost of investments | | $ | 52,902,922 | |
| Gross tax unrealized appreciation | | $ | 9,799,982 | |
| Gross tax unrealized depreciation | | | (2,018,058 | ) |
| Net tax unrealized appreciation | | $ | 7,781,924 | |
| Undistributed ordinary income | | | 832,696 | |
| Undistributed long-term capital gain | | | 2,121,968 | |
| Total distributable earnings | | $ | 2,954,664 | |
| Other accumulated losses | | | — | |
| Total accumulated gain | | $ | 10,736,588 | |
The difference between book basis and tax basis unrealized and realized gains and losses is attributable primarily to the tax deferral of losses relating to wash sale transactions and mark-to-market on PFICs.
Under current tax laws, losses realized after October 31 may be deferred and treated as occurring on the first business day of the following fiscal year. For the fiscal year ended May 31, 2016, the Fund did not defer, on a tax basis, any post-October losses.
Distributions to Shareholders: The Fund will distribute substantially all of the net investment income and net realized gains that it has realized on the sale of securities. These income and gains distributions will generally be paid once each year, on or before December 31. The character of distributions made during the year from net investment income or net realized gains may differ from the characterization for federal income tax purposes due to differences in the recognition of income, expense or gain items for financial reporting and tax reporting purposes.
The tax character of distributions paid were as follows:
| | | Six Months Ended | | | Year Ended | |
| | | November 30, 2016 | | | May 31, 2016 | |
| Ordinary Income | | $ | — | | | $ | 623,010 | |
| Long-term capital gains | | $ | — | | | $ | 2,307,000 | |
Dividend income and distributions to shareholders are recorded on the ex-dividend date. The Fund may periodically make reclassifications among certain of its capital accounts to reflect the tax character of permanent book/tax differences related to the components of the Fund’s net assets. These reclassifications have no impact on the net assets or net asset value of the Fund.
Other: Investment transactions and shareholder transactions are accounted for on the trade date. Net realized gains and losses on securities are computed on the basis of specific security lot identification. Withholding taxes on foreign dividends have been provided for in accordance with the Fund’s understanding of the applicable country’s tax rules and rates.
In August 2014, the FASB issued ASU 2014-15 — Presentation of Financial Statements — Going Concern (Subtopic 205-40). The pronouncement determines management’s responsibility regarding assessment of the Fund’s ability to continue as a going concern, even if the Fund’s liquidation is not imminent. Currently, no similar guidance exists. Under this guidance, during each period in which financial statements are prepared, management needs to evaluate whether there are conditions or events that, in the aggregate, raise substantial doubt about the Fund’s ability to continue as a going concern within one year after the date the financial statements are issued. Substantial doubt exists if these conditions or events indicate that the Fund will be unable to meet its obligations as they become due. If such conditions or events exist, management should develop a plan to mitigate or alleviate these conditions or events. Regardless of management’s plan to mitigate, certain disclosures must be made in the financial statements. ASU 2014-15 is effective for annual periods ending after December 15, 2016, however, early adoption is permitted. Management does not believe that the update will have an impact on the Fund’s financial statements, but it may require additional disclosures.
Subsequent Events: In preparing these financial statements, management has performed an evaluation of subsequent events after November 30, 2016 through the date the financial statements were issued and determined that there were no significant subsequent events that would require adjustment to or additional disclosure in these financial statements.
IMAN FUND
NOTES TO THE FINANCIAL STATEMENTS (Continued)
November 30, 2016 (Unaudited)
| 3. | Investment Advisory and Other Agreements |
The Trust has an Investment Advisory Agreement (the “Agreement”) with the Adviser, with whom certain officers and a Trustee of the Trust are affiliated, to furnish investment advisory services to the Fund. Under the terms of the Agreement, the Trust, on behalf of the Fund, compensates the Adviser for its management services at the annual rate of 1.00% of the Fund’s daily average net assets.
For the six months ended November 30, 2016, the Fund had advisory expenses of $340,702 and as of November 30, 2016, the Fund had $57,258 payable to the Adviser.
The Trust has a distribution agreement and a servicing agreement with Quasar Distributors, LLC (the “Distributor”). Fees for such distribution services are paid to the Distributor by the Adviser.
| 4. | Capital Share Transactions |
Capital Share Transactions of the Fund for the six months ended November 30, 2016, were as follows:
| | | Amount | | | Shares | |
| Shares sold | | $ | 9,404,032 | | | | 823,175 | |
| Shares redeemed | | | (3,233,466 | ) | | | (279,308 | ) |
| Net increase | | $ | 6,170,566 | | | | 543,867 | |
| | | | | | | | | |
| Shares Outstanding | | | | | | | | |
| Beginning of period | | | | | | | 5,476,359 | |
| End of period | | | | | | | 6,020,226 | |
Capital Share Transactions of the Fund for the year ended May 31, 2016, were as follows:
| | | Amount | | | Shares | |
| Shares sold | | $ | 8,464,219 | | | | 766,430 | |
| Shares reinvested | | | 2,914,842 | | | | 264,986 | |
| Shares redeemed | | | (17,048,574 | ) | | | (1,560,494 | ) |
| Net decrease | | $ | (5,669,513 | ) | | | (529,078 | ) |
| | | | | | | | | |
| Shares Outstanding | | | | | | | | |
| Beginning of period | | | | | | | 6,005,437 | |
| End of period | | | | | | | 5,476,359 | |
| 5. | Securities Transactions |
During the six months ended November 30, 2016, the cost of purchases and proceeds from sales of investment securities, other than short-term investments, were $26,330,316 and $19,416,111, respectively. There were no purchases or sales of U.S. government securities for the Fund.
The beneficial ownership, either directly or indirectly, of more than 25% of the voting securities of a fund creates a presumption of control of the fund, under Section 2(a)(9) of the Investment Company Act of 1940. As of November 30, 2016, the North American Islamic Trust (“NAIT”) held 55.92% of the Fund. NAIT is the parent company of the Adviser.
IMAN FUND
ADDITIONAL INFORMATION
November 30, 2016 (Unaudited)
Proxy Voting Policies and Procedures (Unaudited)
A description of the policies and procedures that the Fund uses to determine how to vote proxies relating to portfolio securities is available without charge, upon request, by calling (877) 417-6161 or by accessing the Fund’s website at http://www.investaaa.com. Furthermore, you can obtain the description on the SEC’s website at http://www.sec.gov.
Proxy Voting Record (Unaudited)
Information regarding how the Fund voted proxies relating to portfolio securities during the most recent 12-month period ended June 30 is available without charge, upon request, by calling (877) 417-6161. Furthermore, you can obtain the Fund’s proxy voting records on the SEC’s website at http://www.sec.gov.
Availability of Quarterly Portfolio Schedule (Unaudited)
The Fund files its complete schedule of portfolio holdings with the SEC for the first and third quarters of each fiscal year on Form N-Q. The filing will be available, upon request, by calling (877) 417-6161. Furthermore, you will be able to obtain a copy of the filing on the SEC’s website at http://www.sec.gov. The Fund’s Forms N-Q may also be reviewed and copied at the SEC’s Public Reference Room in Washington, DC, and information on the operation of the Public Reference Room may be obtained by calling (800) SEC-0330.
PRIVACY POLICY
In the course of servicing your account, we collect the following nonpublic personal information about you:
| | • | Information we receive from you on or in applications or other forms, correspondence, or conversations, including, but not limited to, your name, address, phone number, social security number, assets, income and date of birth; and |
| | | |
| | • | Information about your transactions with us, our affiliates, or others, including, but not limited to, your account number and balance, parties to transactions, cost basis information, and other financial information. |
| | | |
| | • | Information collected from our website (including from the use of “cookies”) |
We do not disclose any nonpublic personal information about our current or former shareholders to nonaffiliated third parties, except as permitted by law. For example, we are permitted by law to disclose all of the information we collect, as described above, to our transfer agent to process your transactions. Furthermore, we restrict access to your nonpublic personal information to those persons who require such information to provide products or services to you. We maintain physical, electronic, and procedural safeguards that comply with industry standards to guard your nonpublic personal information.
In the event that you hold shares of the Fund through a financial intermediary, including, but not limited to, a broker-dealer, bank, or trust company, the privacy policy of your financial intermediary would govern how your financial intermediary shares nonpublic personal information with nonaffiliated third parties.
(This Page Intentionally Left Blank.)
INVESTMENT ADVISER
Allied Asset Advisors, Inc.
Oak Brook, Illinois
DISTRIBUTOR
Quasar Distributors, LLC
Milwaukee, Wisconsin
INDEPENDENT REGISTERED
PUBLIC ACCOUNTING FIRM
Cohen & Company, Ltd.
Cleveland, Ohio
ADMINISTRATOR, TRANSFER AGENT,
AND FUND ACCOUNTANT
U.S. Bancorp Fund Services, LLC
Milwaukee, Wisconsin
CUSTODIAN
U.S. Bank, N.A.
Milwaukee, Wisconsin
LEGAL COUNSEL
Latham & Watkins
Chicago, Illinois
This report has been prepared for shareholders and may be distributed to others only if preceded or accompanied by a current prospectus. Read the Prospectus carefully before you invest or send money. The Prospectus contains important information about the Fund, including charges and expenses. The principal value of your investment will fluctuate, and your shares may be worth less than your original cost. Quasar Distributors, LLC is the Distributor for the Fund.