Exhibit 99.1 Investor Day November 28, 2018 RPM International Inc. 11/28/18 1Exhibit 99.1 Investor Day November 28, 2018 RPM International Inc. 11/28/18 1
Forward-Looking Statements & Regulation G This presentation contains “Forward-Looking Statements” as defined in the Private Securities Litigation Reform Act of 1995. Actual results may differ materially from expectations and are subject to certain risks and uncertainties such as those described in RPM’s periodic reports and statements filed with the Securities and Exchange Commission and available through the company’s website, www.rpminc.com. We do not undertake any obligation to publicly update or revise any forward-looking statements to reflect future events, information or circumstances that arise after the date of this presentation. This presentation includes certain company data that do not directly conform to generally accepted accounting principles, or GAAP, and certain company data that has been restated for improved clarity, understanding and comparability, or pro forma. All non-GAAP data in this presentation are indicated by footnote. Tables reconciling such data with GAAP measures are available through our website, www.rpminc.com under Investor Information/Presentations. 11/28/18 2Forward-Looking Statements & Regulation G This presentation contains “Forward-Looking Statements” as defined in the Private Securities Litigation Reform Act of 1995. Actual results may differ materially from expectations and are subject to certain risks and uncertainties such as those described in RPM’s periodic reports and statements filed with the Securities and Exchange Commission and available through the company’s website, www.rpminc.com. We do not undertake any obligation to publicly update or revise any forward-looking statements to reflect future events, information or circumstances that arise after the date of this presentation. This presentation includes certain company data that do not directly conform to generally accepted accounting principles, or GAAP, and certain company data that has been restated for improved clarity, understanding and comparability, or pro forma. All non-GAAP data in this presentation are indicated by footnote. Tables reconciling such data with GAAP measures are available through our website, www.rpminc.com under Investor Information/Presentations. 11/28/18 2

WHERE WE’VE BEEN 11/28/18 3WHERE WE’VE BEEN 11/28/18 3

“Hire the best people you can find. Create an atmosphere that will keep them. Then let them do their jobs.” Frank C. Sullivan, 1947 11/28/18 4“Hire the best people you can find. Create an atmosphere that will keep them. Then let them do their jobs.” Frank C. Sullivan, 1947 11/28/18 4
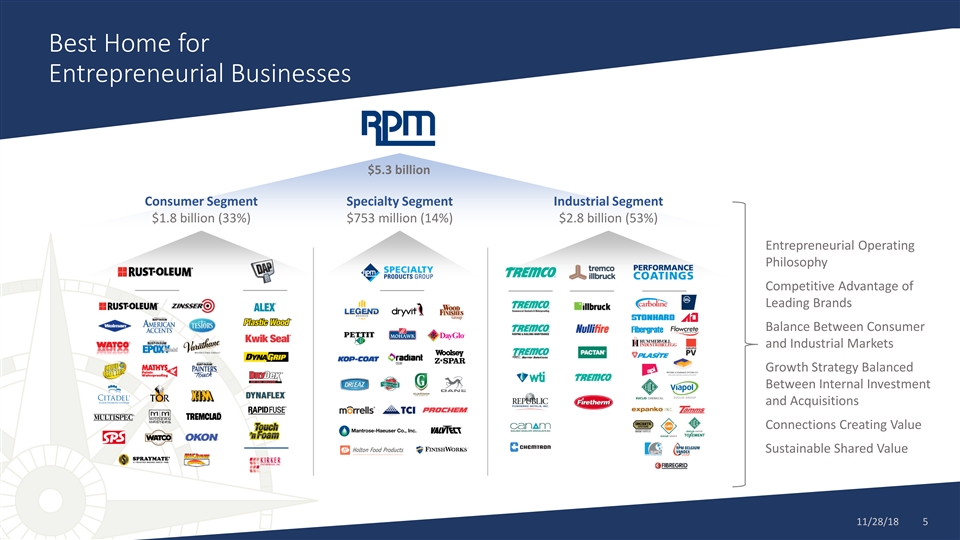
Best Home for Entrepreneurial Businesses $5.3 billion Consumer Segment Specialty Segment Industrial Segment $1.8 billion (33%) $753 million (14%) $2.8 billion (53%) Entrepreneurial Operating Philosophy Competitive Advantage of Leading Brands Balance Between Consumer and Industrial Markets Growth Strategy Balanced Between Internal Investment and Acquisitions Connections Creating Value Sustainable Shared Value 11/28/18 5Best Home for Entrepreneurial Businesses $5.3 billion Consumer Segment Specialty Segment Industrial Segment $1.8 billion (33%) $753 million (14%) $2.8 billion (53%) Entrepreneurial Operating Philosophy Competitive Advantage of Leading Brands Balance Between Consumer and Industrial Markets Growth Strategy Balanced Between Internal Investment and Acquisitions Connections Creating Value Sustainable Shared Value 11/28/18 5
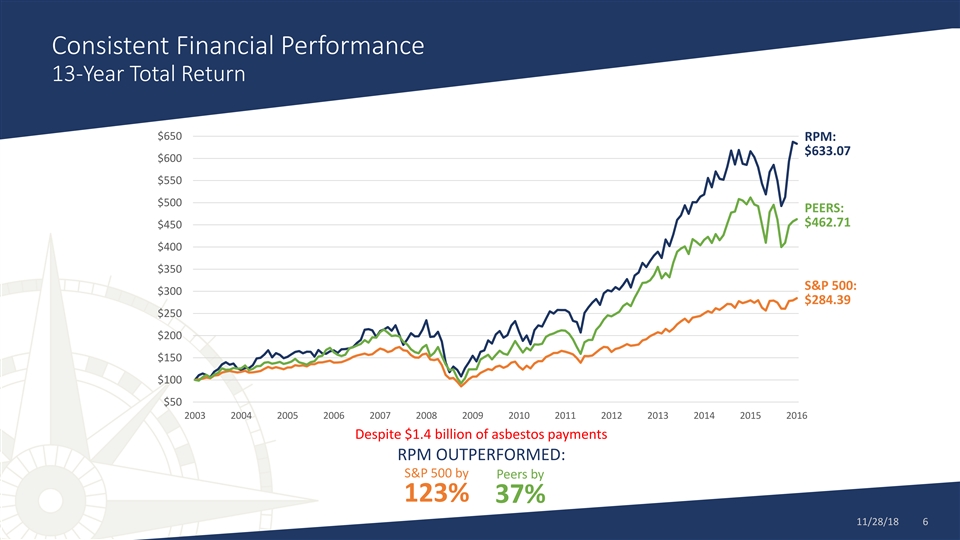
Consistent Financial Performance 13-Year Total Return $650 RPM: $633.07 $600 $550 $500 PEERS: $462.71 $450 $400 $350 S&P 500: $300 $284.39 $250 $200 $150 $100 $50 2003 2004 2005 2006 2007 2008 2009 2010 2011 2012 2013 2014 2015 2016 Despite $1.4 billion of asbestos payments RPM OUTPERFORMED: S&P 500 by Peers by 123% 37% 11/28/18 6Consistent Financial Performance 13-Year Total Return $650 RPM: $633.07 $600 $550 $500 PEERS: $462.71 $450 $400 $350 S&P 500: $300 $284.39 $250 $200 $150 $100 $50 2003 2004 2005 2006 2007 2008 2009 2010 2011 2012 2013 2014 2015 2016 Despite $1.4 billion of asbestos payments RPM OUTPERFORMED: S&P 500 by Peers by 123% 37% 11/28/18 6

Several Factors Adversely Affected FY15-FY17 Performance FX Headwinds $800 Million Two Deep and and Global Heavy in Asbestos Uncharacteristically Prolonged Industry Resolution Poor-Performing Challenging Recession Slowed Payments Acquisitions Raw Material Internal Growth (Over 3 ½ Years) (Kirker and Synta) Cost/Availability Environment 11/28/18 7Several Factors Adversely Affected FY15-FY17 Performance FX Headwinds $800 Million Two Deep and and Global Heavy in Asbestos Uncharacteristically Prolonged Industry Resolution Poor-Performing Challenging Recession Slowed Payments Acquisitions Raw Material Internal Growth (Over 3 ½ Years) (Kirker and Synta) Cost/Availability Environment 11/28/18 7
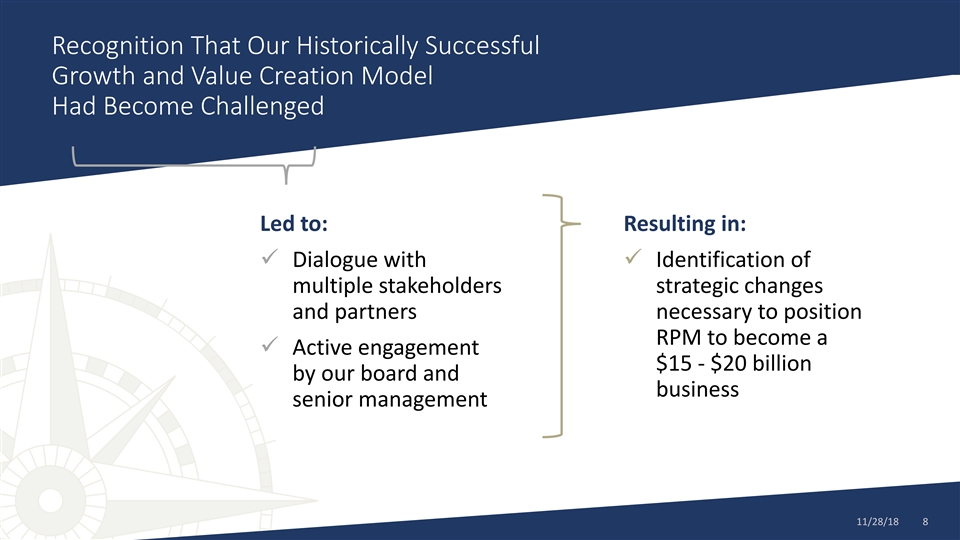
Recognition That Our Historically Successful Growth and Value Creation Model Had Become Challenged Led to: Resulting in: ✓ Dialogue with ✓ Identification of multiple stakeholders strategic changes and partners necessary to position RPM to become a ✓ Active engagement $15 - $20 billion by our board and business senior management 11/28/18 8Recognition That Our Historically Successful Growth and Value Creation Model Had Become Challenged Led to: Resulting in: ✓ Dialogue with ✓ Identification of multiple stakeholders strategic changes and partners necessary to position RPM to become a ✓ Active engagement $15 - $20 billion by our board and business senior management 11/28/18 8

WHERE WE’RE GOING 11/28/18 9WHERE WE’RE GOING 11/28/18 9
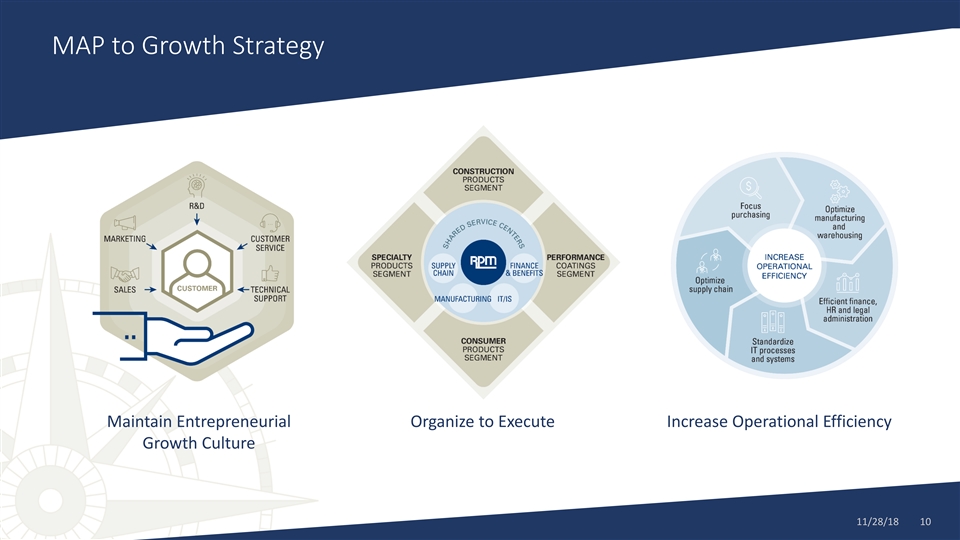
MAP to Growth Strategy Maintain Entrepreneurial Organize to Execute Increase Operational Efficiency Growth Culture 11/28/18 10MAP to Growth Strategy Maintain Entrepreneurial Organize to Execute Increase Operational Efficiency Growth Culture 11/28/18 10
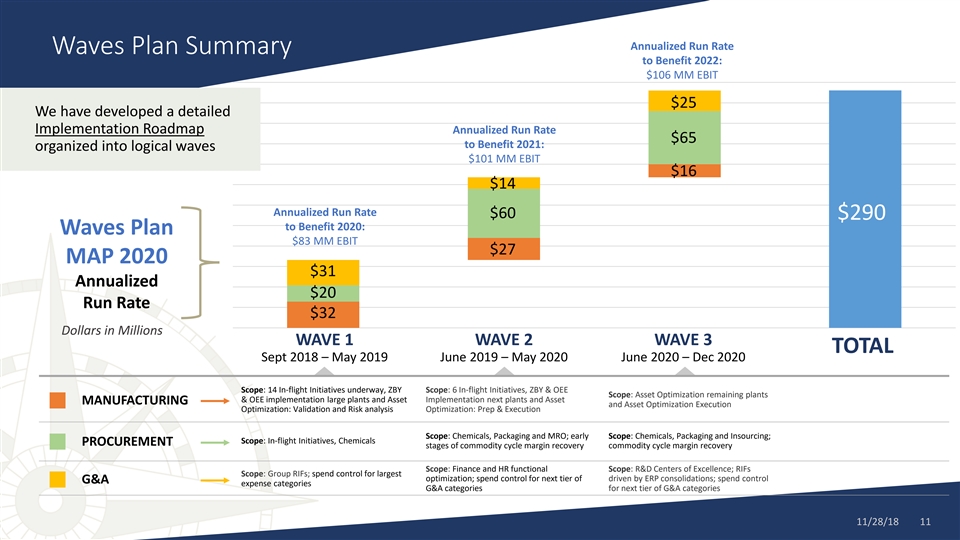
Annualized Run Rate Waves Plan Summary to Benefit 2022: $106 MM EBIT $25 We have developed a detailed Implementation Roadmap Annualized Run Rate $65 to Benefit 2021: organized into logical waves $101 MM EBIT $16 $14 Annualized Run Rate $60 $290 to Benefit 2020: Waves Plan $83 MM EBIT $27 MAP 2020 $31 Annualized $20 Run Rate $32 Dollars in Millions WAVE 1 WAVE 2 WAVE 3 TOTAL Sept 2018 – May 2019 June 2019 – May 2020 June 2020 – Dec 2020 Scope: 14 In-flight Initiatives underway, ZBY Scope: 6 In-flight Initiatives, ZBY & OEE Scope: Asset Optimization remaining plants & OEE implementation large plants and Asset Implementation next plants and Asset MANUFACTURING and Asset Optimization Execution Optimization: Validation and Risk analysis Optimization: Prep & Execution Scope: Chemicals, Packaging and MRO; early Scope: Chemicals, Packaging and Insourcing; Scope: In-flight Initiatives, Chemicals PROCUREMENT stages of commodity cycle margin recovery commodity cycle margin recovery Scope: Finance and HR functional Scope: R&D Centers of Excellence; RIFs Scope: Group RIFs; spend control for largest optimization; spend control for next tier of driven by ERP consolidations; spend control G&A expense categories G&A categories for next tier of G&A categories 11/28/18 11Annualized Run Rate Waves Plan Summary to Benefit 2022: $106 MM EBIT $25 We have developed a detailed Implementation Roadmap Annualized Run Rate $65 to Benefit 2021: organized into logical waves $101 MM EBIT $16 $14 Annualized Run Rate $60 $290 to Benefit 2020: Waves Plan $83 MM EBIT $27 MAP 2020 $31 Annualized $20 Run Rate $32 Dollars in Millions WAVE 1 WAVE 2 WAVE 3 TOTAL Sept 2018 – May 2019 June 2019 – May 2020 June 2020 – Dec 2020 Scope: 14 In-flight Initiatives underway, ZBY Scope: 6 In-flight Initiatives, ZBY & OEE Scope: Asset Optimization remaining plants & OEE implementation large plants and Asset Implementation next plants and Asset MANUFACTURING and Asset Optimization Execution Optimization: Validation and Risk analysis Optimization: Prep & Execution Scope: Chemicals, Packaging and MRO; early Scope: Chemicals, Packaging and Insourcing; Scope: In-flight Initiatives, Chemicals PROCUREMENT stages of commodity cycle margin recovery commodity cycle margin recovery Scope: Finance and HR functional Scope: R&D Centers of Excellence; RIFs Scope: Group RIFs; spend control for largest optimization; spend control for next tier of driven by ERP consolidations; spend control G&A expense categories G&A categories for next tier of G&A categories 11/28/18 11
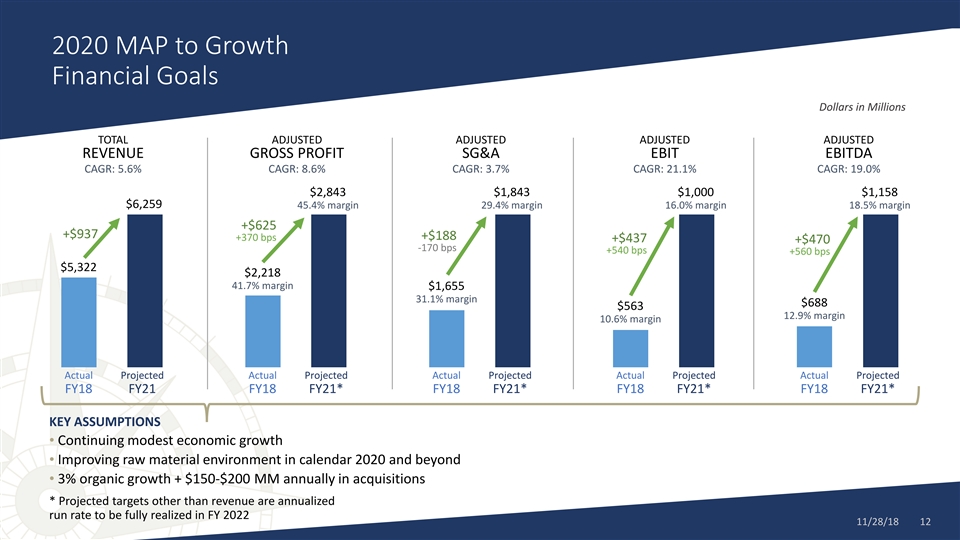
2020 MAP to Growth Financial Goals Dollars in Millions TOTAL ADJUSTED ADJUSTED ADJUSTED ADJUSTED REVENUE GROSS PROFIT SG&A EBIT EBITDA CAGR: 5.6% CAGR: 8.6% CAGR: 3.7% CAGR: 21.1% CAGR: 19.0% $2,843 $1,843 $1,000 $1,158 $6,259 45.4% margin 29.4% margin 16.0% margin 18.5% margin +$625 +$937 +$188 +370 bps +$437 +$470 -170 bps +540 bps +560 bps $5,322 $2,218 41.7% margin $1,655 31.1% margin $688 $563 12.9% margin 10.6% margin Actual Projected Actual Projected Actual Projected Actual Projected Actual Projected FY18 FY21 FY18 FY21* FY18 FY21* FY18 FY21* FY18 FY21* KEY ASSUMPTIONS • Continuing modest economic growth • Improving raw material environment in calendar 2020 and beyond 3% organic growth + $150-$200 MM annually in acquisitions • * Projected targets other than revenue are annualized run rate to be fully realized in FY 2022 11/28/18 122020 MAP to Growth Financial Goals Dollars in Millions TOTAL ADJUSTED ADJUSTED ADJUSTED ADJUSTED REVENUE GROSS PROFIT SG&A EBIT EBITDA CAGR: 5.6% CAGR: 8.6% CAGR: 3.7% CAGR: 21.1% CAGR: 19.0% $2,843 $1,843 $1,000 $1,158 $6,259 45.4% margin 29.4% margin 16.0% margin 18.5% margin +$625 +$937 +$188 +370 bps +$437 +$470 -170 bps +540 bps +560 bps $5,322 $2,218 41.7% margin $1,655 31.1% margin $688 $563 12.9% margin 10.6% margin Actual Projected Actual Projected Actual Projected Actual Projected Actual Projected FY18 FY21 FY18 FY21* FY18 FY21* FY18 FY21* FY18 FY21* KEY ASSUMPTIONS • Continuing modest economic growth • Improving raw material environment in calendar 2020 and beyond 3% organic growth + $150-$200 MM annually in acquisitions • * Projected targets other than revenue are annualized run rate to be fully realized in FY 2022 11/28/18 12
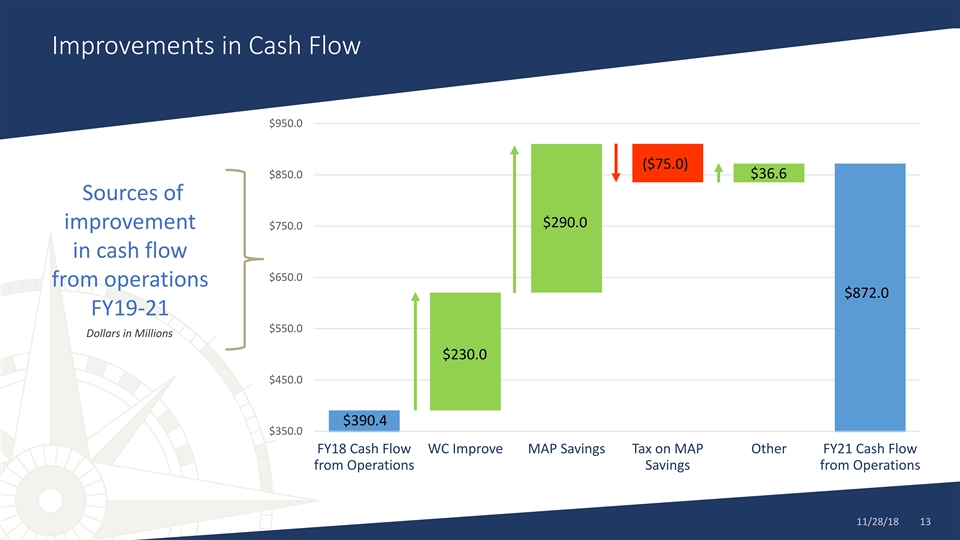
Improvements in Cash Flow $950.0 ($75.0) $850.0 $36.6 Sources of $290.0 improvement $750.0 in cash flow $650.0 from operations $872.0 FY19-21 $550.0 Dollars in Millions $230.0 $450.0 $390.4 $350.0 FY18 Cash Flow WC Improve MAP Savings Tax on MAP Other FY21 Cash Flow from Operations Savings from Operations 11/28/18 13Improvements in Cash Flow $950.0 ($75.0) $850.0 $36.6 Sources of $290.0 improvement $750.0 in cash flow $650.0 from operations $872.0 FY19-21 $550.0 Dollars in Millions $230.0 $450.0 $390.4 $350.0 FY18 Cash Flow WC Improve MAP Savings Tax on MAP Other FY21 Cash Flow from Operations Savings from Operations 11/28/18 13
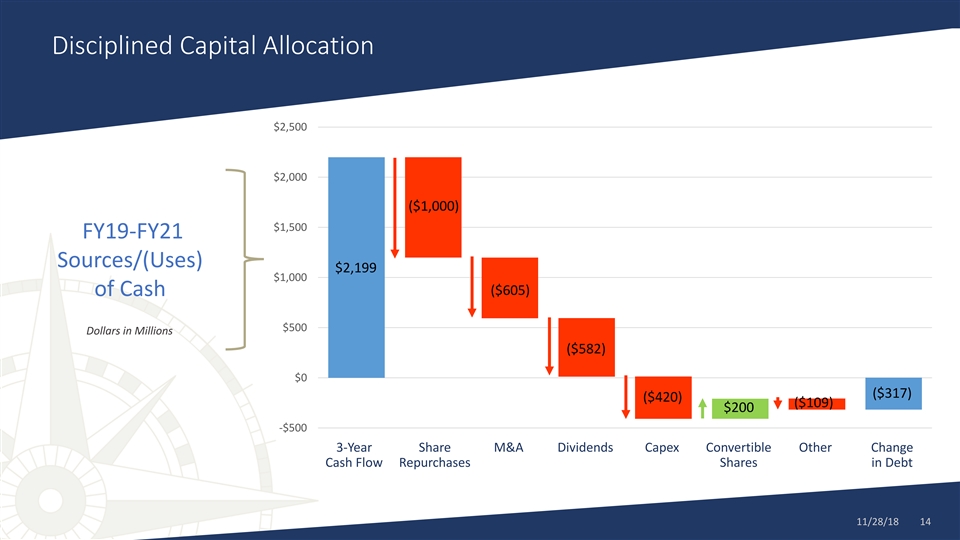
Disciplined Capital Allocation $2,500 $2,000 ($1,000) $1,500 FY19-FY21 Sources/(Uses) $2,199 $1,000 ($605) of Cash $500 Dollars in Millions ($582) $0 ($317) ($420) ($109) $200 -$500 3-Year Share M&A Dividends Capex Convertible Other Change Cash Flow Repurchases Shares in Debt 11/28/18 14Disciplined Capital Allocation $2,500 $2,000 ($1,000) $1,500 FY19-FY21 Sources/(Uses) $2,199 $1,000 ($605) of Cash $500 Dollars in Millions ($582) $0 ($317) ($420) ($109) $200 -$500 3-Year Share M&A Dividends Capex Convertible Other Change Cash Flow Repurchases Shares in Debt 11/28/18 14

2020 MAP to Growth PURPOSE VISION To position RPM for sustained, profitable growth To transform RPM into a more connected and creating superior value for its customers, efficient company focused on operational excellence entrepreneurs, associates and shareholders. and continuous improvement, while maintaining the strengths of its entrepreneurial culture. GOALS By May 31, 2021, RPM is targeting improvements to: • $6.25 bb Revenues • $1.0 bb EBIT on an annualized run rate • $1.5 bb Return of Capital Maintain Entrepreneurial Organize to Execute Increase Operational Efficiency Growth Culture 11/28/18 152020 MAP to Growth PURPOSE VISION To position RPM for sustained, profitable growth To transform RPM into a more connected and creating superior value for its customers, efficient company focused on operational excellence entrepreneurs, associates and shareholders. and continuous improvement, while maintaining the strengths of its entrepreneurial culture. GOALS By May 31, 2021, RPM is targeting improvements to: • $6.25 bb Revenues • $1.0 bb EBIT on an annualized run rate • $1.5 bb Return of Capital Maintain Entrepreneurial Organize to Execute Increase Operational Efficiency Growth Culture 11/28/18 15

Click to edit Master title style Operational Improvement Roadmap Click to edit Master subtitle style Stephen J. Knoop Head of Group Restructuring 11/28/18 16Click to edit Master title style Operational Improvement Roadmap Click to edit Master subtitle style Stephen J. Knoop Head of Group Restructuring 11/28/18 16
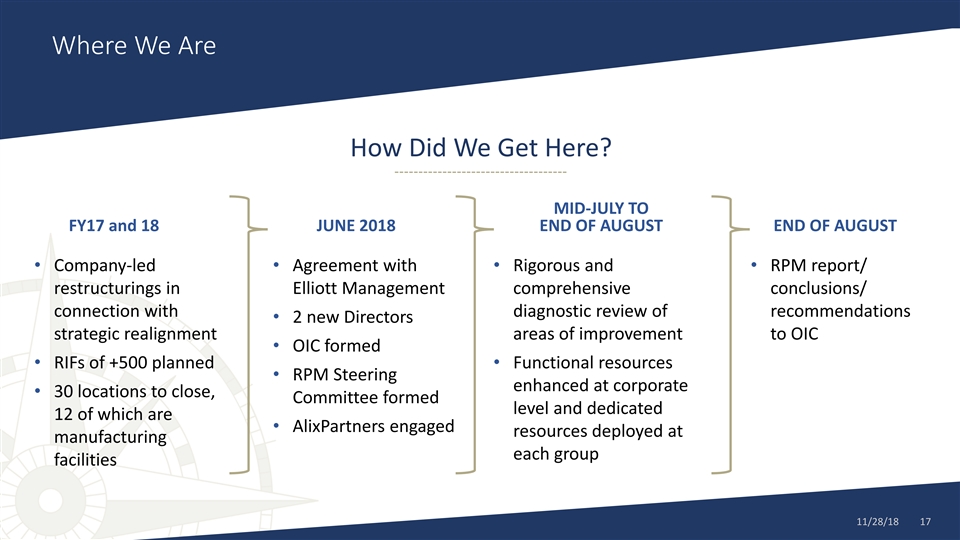
Where We Are How Did We Get Here? MID-JULY TO FY17 and 18 JUNE 2018 END OF AUGUST END OF AUGUST • Company-led • Agreement with • Rigorous and • RPM report/ restructurings in Elliott Management comprehensive conclusions/ connection with diagnostic review of recommendations • 2 new Directors strategic realignment areas of improvement to OIC • OIC formed • RIFs of +500 planned• Functional resources • RPM Steering enhanced at corporate • 30 locations to close, Committee formed level and dedicated 12 of which are • AlixPartners engaged resources deployed at manufacturing each group facilities 11/28/18 17Where We Are How Did We Get Here? MID-JULY TO FY17 and 18 JUNE 2018 END OF AUGUST END OF AUGUST • Company-led • Agreement with • Rigorous and • RPM report/ restructurings in Elliott Management comprehensive conclusions/ connection with diagnostic review of recommendations • 2 new Directors strategic realignment areas of improvement to OIC • OIC formed • RIFs of +500 planned• Functional resources • RPM Steering enhanced at corporate • 30 locations to close, Committee formed level and dedicated 12 of which are • AlixPartners engaged resources deployed at manufacturing each group facilities 11/28/18 17
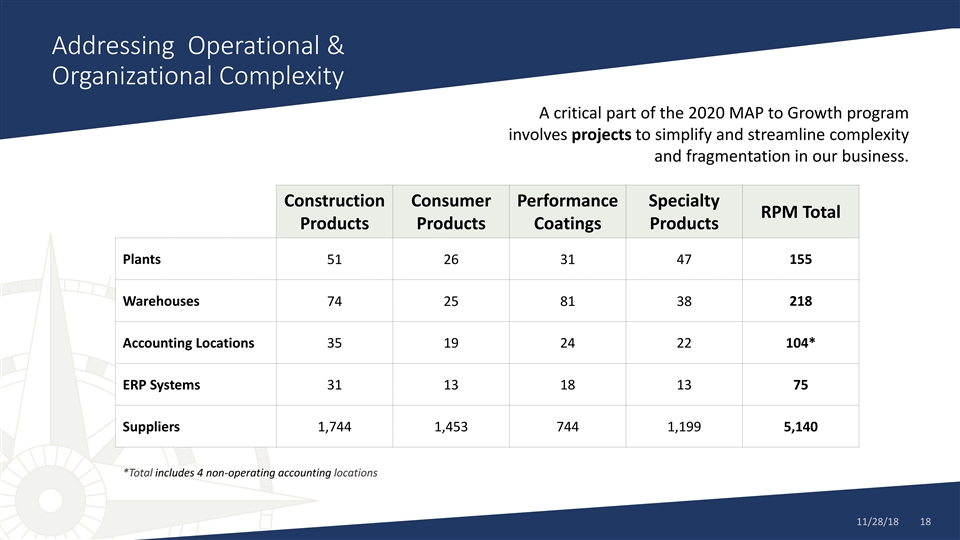
Addressing Operational & Organizational Complexity A critical part of the 2020 MAP to Growth program involves projects to simplify and streamline complexity and fragmentation in our business. Construction Consumer Performance Specialty RPM Total Products Products Coatings Products Plants 51 26 31 47 155 Warehouses 74 25 81 38 218 Accounting Locations 35 19 24 22 104* ERP Systems 31 13 18 13 75 Suppliers 1,744 1,453 744 1,199 5,140 *Total includes 4 non-operating accounting locations 11/28/18 18Addressing Operational & Organizational Complexity A critical part of the 2020 MAP to Growth program involves projects to simplify and streamline complexity and fragmentation in our business. Construction Consumer Performance Specialty RPM Total Products Products Coatings Products Plants 51 26 31 47 155 Warehouses 74 25 81 38 218 Accounting Locations 35 19 24 22 104* ERP Systems 31 13 18 13 75 Suppliers 1,744 1,453 744 1,199 5,140 *Total includes 4 non-operating accounting locations 11/28/18 18
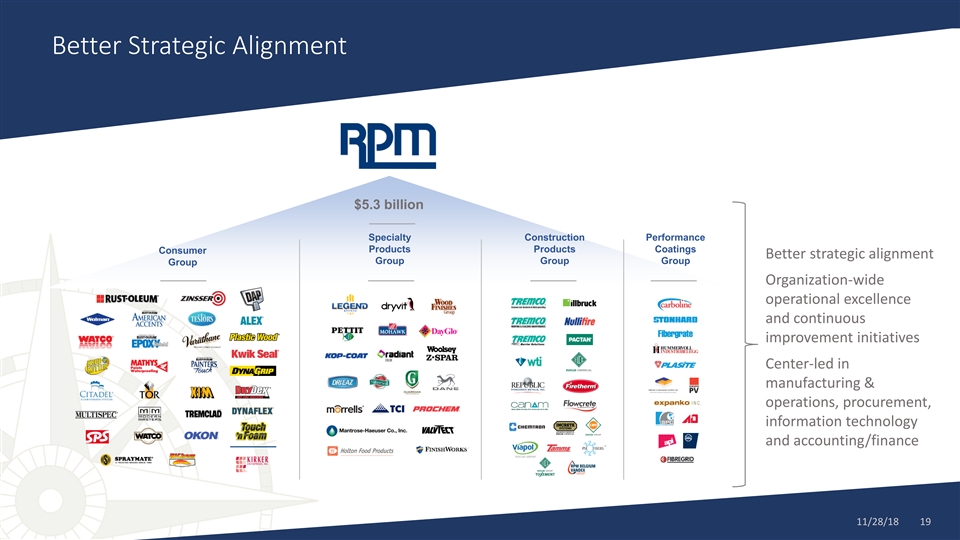
Better Strategic Alignment $5.3 billion Specialty Construction Performance Products Products Coatings Consumer Better strategic alignment Group Group Group Group Organization-wide operational excellence and continuous improvement initiatives Center-led in manufacturing & operations, procurement, information technology and accounting/finance 11/28/18 19Better Strategic Alignment $5.3 billion Specialty Construction Performance Products Products Coatings Consumer Better strategic alignment Group Group Group Group Organization-wide operational excellence and continuous improvement initiatives Center-led in manufacturing & operations, procurement, information technology and accounting/finance 11/28/18 19
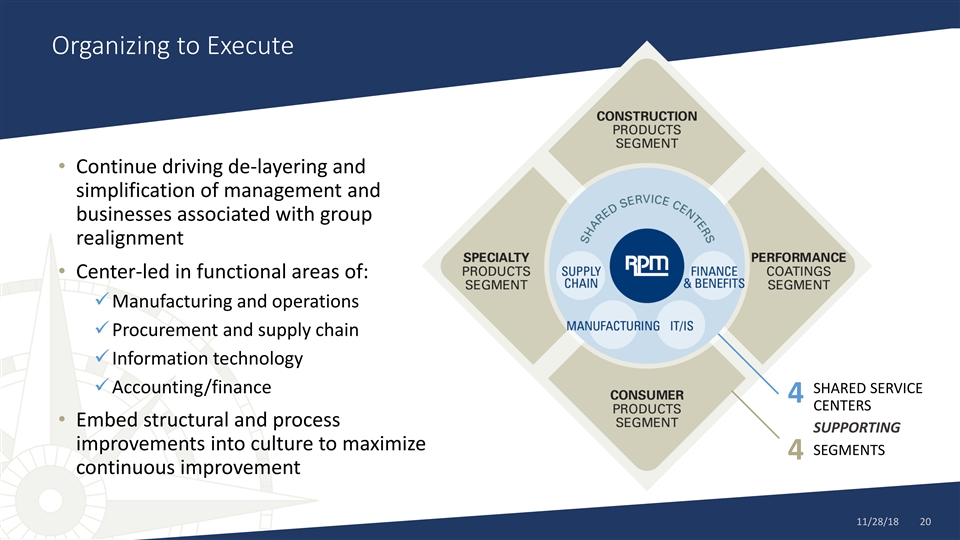
Organizing to Execute • Continue driving de-layering and simplification of management and businesses associated with group realignment • Center-led in functional areas of: ✓Manufacturing and operations ✓Procurement and supply chain ✓Information technology ✓Accounting/finance SHARED SERVICE 4 CENTERS • Embed structural and process SUPPORTING improvements into culture to maximize SEGMENTS 4 continuous improvement 11/28/18 20Organizing to Execute • Continue driving de-layering and simplification of management and businesses associated with group realignment • Center-led in functional areas of: ✓Manufacturing and operations ✓Procurement and supply chain ✓Information technology ✓Accounting/finance SHARED SERVICE 4 CENTERS • Embed structural and process SUPPORTING improvements into culture to maximize SEGMENTS 4 continuous improvement 11/28/18 20

Organizing to Execute Aligning Resources Personnel Enhancements • Steve Knoop, Head of Group Restructuring • Gordy Hyde, VP Operations – focused on building a center-led manufacturing Group elevation organization and competencies of coordinated • Tim Kinser, VP Operations – focused on building a center-led procurement resources organization and competencies • Lonny DiRusso, CIO – focused on ERP migrations and center-led IT strategy • Joe Toula, Finance – focused on center-led finance and administration changes 11/28/18 21Organizing to Execute Aligning Resources Personnel Enhancements • Steve Knoop, Head of Group Restructuring • Gordy Hyde, VP Operations – focused on building a center-led manufacturing Group elevation organization and competencies of coordinated • Tim Kinser, VP Operations – focused on building a center-led procurement resources organization and competencies • Lonny DiRusso, CIO – focused on ERP migrations and center-led IT strategy • Joe Toula, Finance – focused on center-led finance and administration changes 11/28/18 21
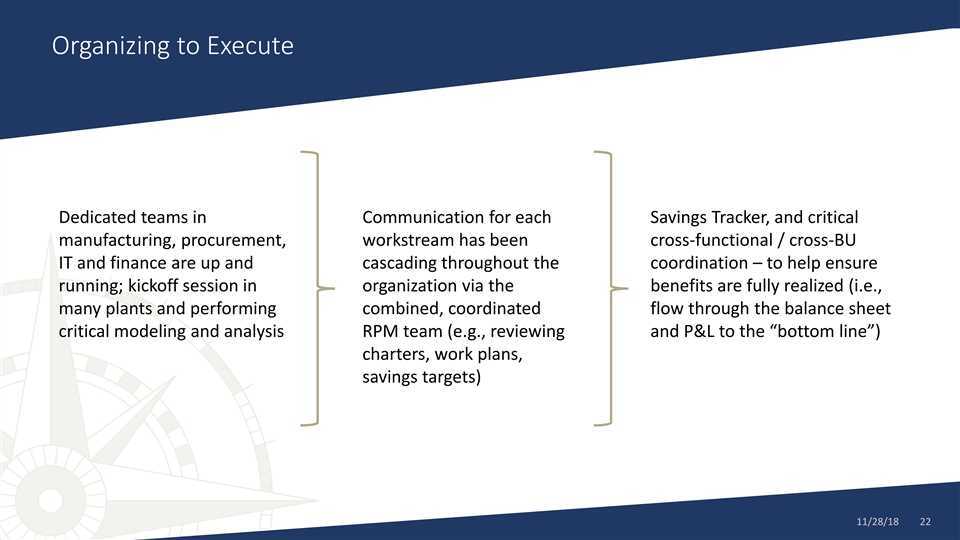
Organizing to Execute Dedicated teams in Communication for each Savings Tracker, and critical manufacturing, procurement, workstream has been cross-functional / cross-BU IT and finance are up and cascading throughout the coordination – to help ensure running; kickoff session in organization via the benefits are fully realized (i.e., many plants and performing combined, coordinated flow through the balance sheet critical modeling and analysis RPM team (e.g., reviewing and P&L to the “bottom line”) charters, work plans, savings targets) 11/28/18 22Organizing to Execute Dedicated teams in Communication for each Savings Tracker, and critical manufacturing, procurement, workstream has been cross-functional / cross-BU IT and finance are up and cascading throughout the coordination – to help ensure running; kickoff session in organization via the benefits are fully realized (i.e., many plants and performing combined, coordinated flow through the balance sheet critical modeling and analysis RPM team (e.g., reviewing and P&L to the “bottom line”) charters, work plans, savings targets) 11/28/18 22
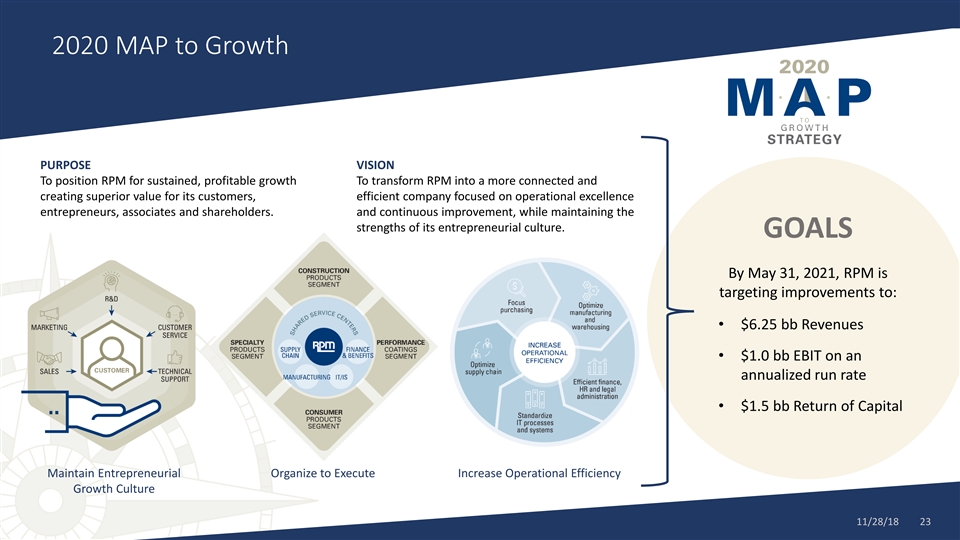
2020 MAP to Growth PURPOSE VISION To position RPM for sustained, profitable growth To transform RPM into a more connected and creating superior value for its customers, efficient company focused on operational excellence entrepreneurs, associates and shareholders. and continuous improvement, while maintaining the strengths of its entrepreneurial culture. GOALS By May 31, 2021, RPM is targeting improvements to: • $6.25 bb Revenues • $1.0 bb EBIT on an annualized run rate • $1.5 bb Return of Capital Maintain Entrepreneurial Organize to Execute Increase Operational Efficiency Growth Culture 11/28/18 232020 MAP to Growth PURPOSE VISION To position RPM for sustained, profitable growth To transform RPM into a more connected and creating superior value for its customers, efficient company focused on operational excellence entrepreneurs, associates and shareholders. and continuous improvement, while maintaining the strengths of its entrepreneurial culture. GOALS By May 31, 2021, RPM is targeting improvements to: • $6.25 bb Revenues • $1.0 bb EBIT on an annualized run rate • $1.5 bb Return of Capital Maintain Entrepreneurial Organize to Execute Increase Operational Efficiency Growth Culture 11/28/18 23

Click to edit Master title style Manufacturing Strategy Overview Click to edit Master subtitle style Gordon M. Hyde Vice President - Operations 11/28/18 24Click to edit Master title style Manufacturing Strategy Overview Click to edit Master subtitle style Gordon M. Hyde Vice President - Operations 11/28/18 24
Manufacturing Present State Present structure is decentralized • Six groups - Organized and incentivized to focus on individual business units • Capacity • Capital allocation • Manufacturing strategies • Recognized inefficiencies and need for margin improvement - Implementing the planned closure of 12 plants and 10 warehouses 11/28/18 25Manufacturing Present State Present structure is decentralized • Six groups - Organized and incentivized to focus on individual business units • Capacity • Capital allocation • Manufacturing strategies • Recognized inefficiencies and need for margin improvement - Implementing the planned closure of 12 plants and 10 warehouses 11/28/18 25
Our Manufacturing Has Prioritized Obsessive Customer Service Over Efficiency – We Can Do Both Opportunities to improve: ✓ Yields with better package fill control and material composition of finished goods KEY FINDINGS ✓ OEE (Overall Equipment Effectiveness) via engineered Rapid Assessment – availability improvement, and focused continuous improvement on performance to reach best-in-class MANUFACTURING rates of 75-85% ✓ Capacity usage and strengthen new product development, service and cost efficiency ✓ Culture by focusing on continuous improvement 11/28/18 26Our Manufacturing Has Prioritized Obsessive Customer Service Over Efficiency – We Can Do Both Opportunities to improve: ✓ Yields with better package fill control and material composition of finished goods KEY FINDINGS ✓ OEE (Overall Equipment Effectiveness) via engineered Rapid Assessment – availability improvement, and focused continuous improvement on performance to reach best-in-class MANUFACTURING rates of 75-85% ✓ Capacity usage and strengthen new product development, service and cost efficiency ✓ Culture by focusing on continuous improvement 11/28/18 26
New Manufacturing Strategy Center-Led ✓ Optimize facility asset base • Fewer and more efficient plants • Where appropriate, serving multiple companies across RPM operations and across groups ✓ Asset allocation in the same context as plant optimization • Human capital • Investment capital 11/28/18 27New Manufacturing Strategy Center-Led ✓ Optimize facility asset base • Fewer and more efficient plants • Where appropriate, serving multiple companies across RPM operations and across groups ✓ Asset allocation in the same context as plant optimization • Human capital • Investment capital 11/28/18 27
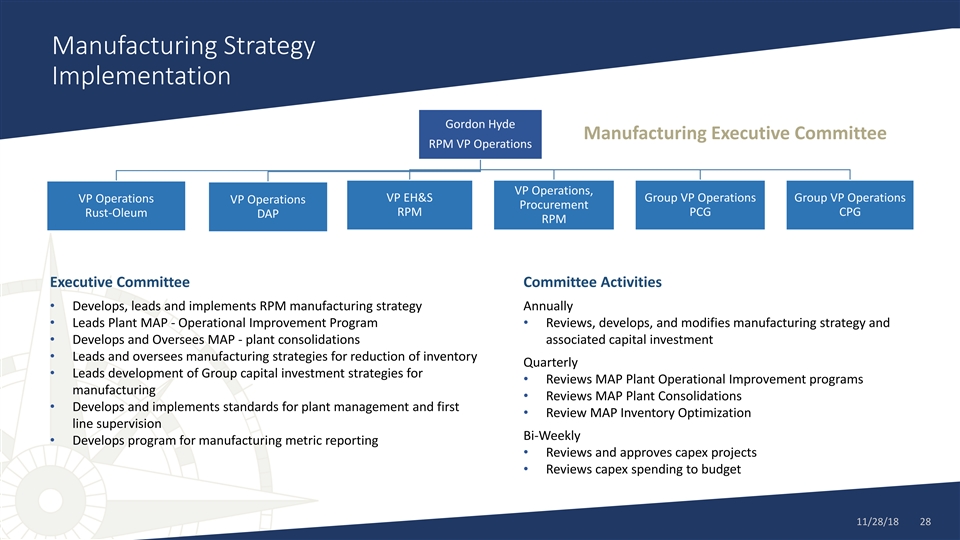
Manufacturing Strategy Implementation Gordon Hyde Manufacturing Executive Committee RPM VP Operations VP Operations, VP EH&S Group VP Operations Group VP Operations VP Operations VP Operations Procurement RPM PCG CPG Rust-Oleum DAP RPM Executive Committee Committee Activities • Develops, leads and implements RPM manufacturing strategy Annually • Leads Plant MAP - Operational Improvement Program• Reviews, develops, and modifies manufacturing strategy and • Develops and Oversees MAP - plant consolidations associated capital investment • Leads and oversees manufacturing strategies for reduction of inventory Quarterly • Leads development of Group capital investment strategies for • Reviews MAP Plant Operational Improvement programs manufacturing • Reviews MAP Plant Consolidations • Develops and implements standards for plant management and first • Review MAP Inventory Optimization line supervision Bi-Weekly • Develops program for manufacturing metric reporting • Reviews and approves capex projects • Reviews capex spending to budget 11/28/18 28Manufacturing Strategy Implementation Gordon Hyde Manufacturing Executive Committee RPM VP Operations VP Operations, VP EH&S Group VP Operations Group VP Operations VP Operations VP Operations Procurement RPM PCG CPG Rust-Oleum DAP RPM Executive Committee Committee Activities • Develops, leads and implements RPM manufacturing strategy Annually • Leads Plant MAP - Operational Improvement Program• Reviews, develops, and modifies manufacturing strategy and • Develops and Oversees MAP - plant consolidations associated capital investment • Leads and oversees manufacturing strategies for reduction of inventory Quarterly • Leads development of Group capital investment strategies for • Reviews MAP Plant Operational Improvement programs manufacturing • Reviews MAP Plant Consolidations • Develops and implements standards for plant management and first • Review MAP Inventory Optimization line supervision Bi-Weekly • Develops program for manufacturing metric reporting • Reviews and approves capex projects • Reviews capex spending to budget 11/28/18 28
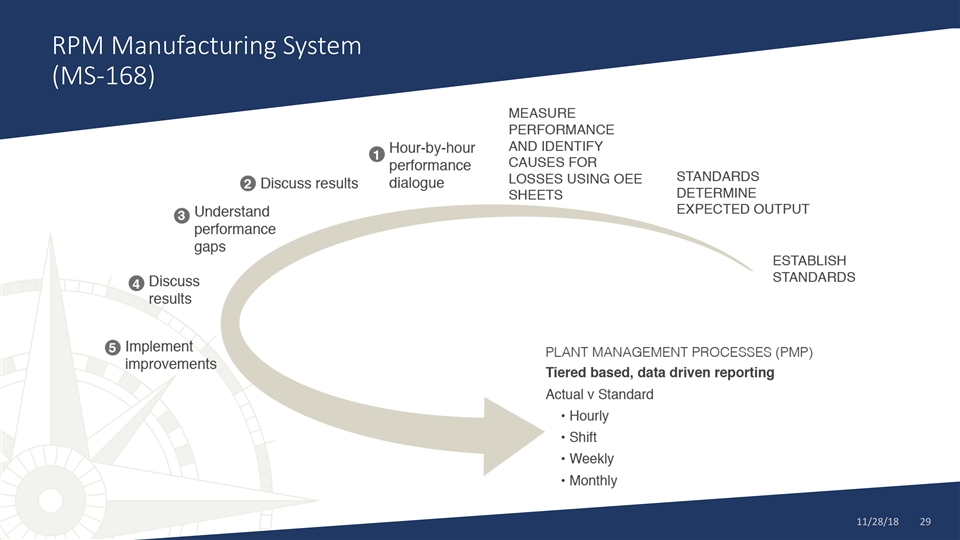
RPM Manufacturing System (MS-168) 11/28/18 29RPM Manufacturing System (MS-168) 11/28/18 29
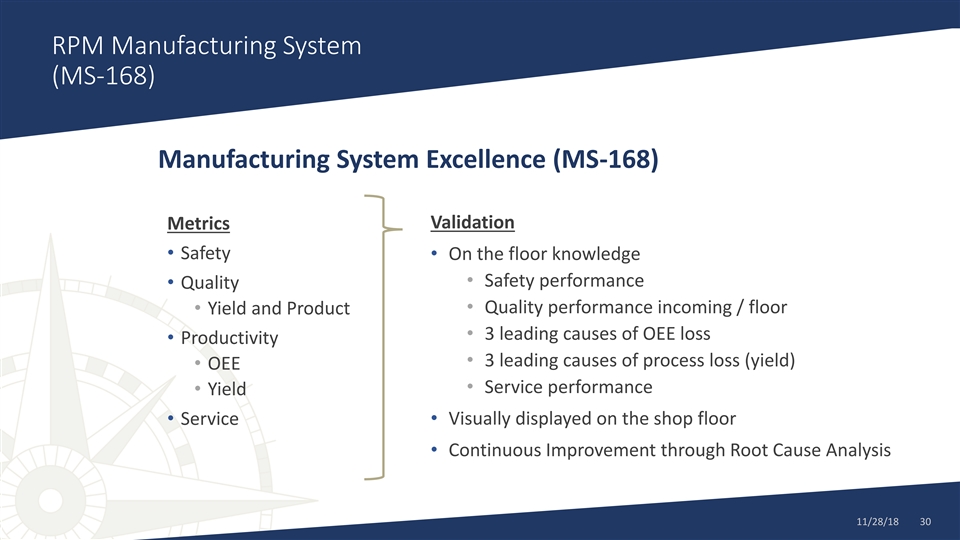
RPM Manufacturing System (MS-168) Manufacturing System Excellence (MS-168) Validation Metrics • Safety • On the floor knowledge • Safety performance • Quality • Quality performance incoming / floor • Yield and Product • 3 leading causes of OEE loss • Productivity • 3 leading causes of process loss (yield) • OEE • Service performance • Yield • Service• Visually displayed on the shop floor • Continuous Improvement through Root Cause Analysis 11/28/18 30RPM Manufacturing System (MS-168) Manufacturing System Excellence (MS-168) Validation Metrics • Safety • On the floor knowledge • Safety performance • Quality • Quality performance incoming / floor • Yield and Product • 3 leading causes of OEE loss • Productivity • 3 leading causes of process loss (yield) • OEE • Service performance • Yield • Service• Visually displayed on the shop floor • Continuous Improvement through Root Cause Analysis 11/28/18 30
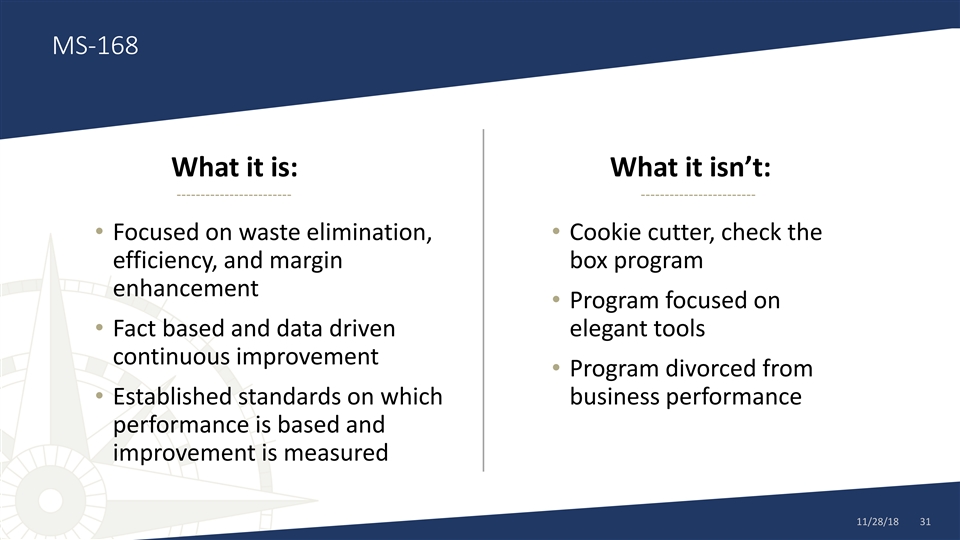
MS-168 What it is: What it isn’t: • Focused on waste elimination, • Cookie cutter, check the efficiency, and margin box program enhancement • Program focused on • Fact based and data driven elegant tools continuous improvement • Program divorced from • Established standards on which business performance performance is based and improvement is measured 11/28/18 31MS-168 What it is: What it isn’t: • Focused on waste elimination, • Cookie cutter, check the efficiency, and margin box program enhancement • Program focused on • Fact based and data driven elegant tools continuous improvement • Program divorced from • Established standards on which business performance performance is based and improvement is measured 11/28/18 31
Manufacturing – MAP 2020 Three tactics for Implementation 1. Zero Based Yield (ZBY) and OEE (Overall Equipment Effectiveness) 11/28/18 32Manufacturing – MAP 2020 Three tactics for Implementation 1. Zero Based Yield (ZBY) and OEE (Overall Equipment Effectiveness) 11/28/18 32
Manufacturing – MAP 2020 Three tactics for Implementation 1. Zero Based Yield (ZBY) and OEE (Overall Equipment Effectiveness) ✓ RPM Manufacturing System (MS-168) 11/28/18 33Manufacturing – MAP 2020 Three tactics for Implementation 1. Zero Based Yield (ZBY) and OEE (Overall Equipment Effectiveness) ✓ RPM Manufacturing System (MS-168) 11/28/18 33
Manufacturing – MAP 2020 Three tactics for Implementation 1. Zero Based Yield (ZBY) and OEE (Overall Equipment Effectiveness) ✓ RPM Manufacturing System (MS-168) 2. Asset Optimization 11/28/18 34Manufacturing – MAP 2020 Three tactics for Implementation 1. Zero Based Yield (ZBY) and OEE (Overall Equipment Effectiveness) ✓ RPM Manufacturing System (MS-168) 2. Asset Optimization 11/28/18 34
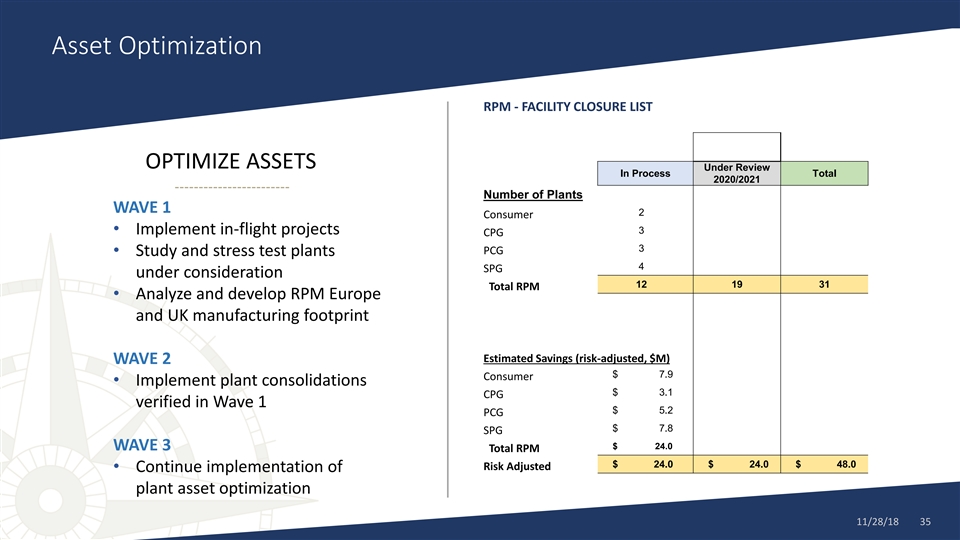
Asset Optimization RPM - FACILITY CLOSURE LIST OPTIMIZE ASSETS Under Review In Process Total 2020/2021 Number of Plants WAVE 1 2 Consumer • Implement in-flight projects 3 CPG 3 PCG • Study and stress test plants 4 SPG under consideration 12 19 31 Total RPM • Analyze and develop RPM Europe and UK manufacturing footprint Estimated Savings (risk-adjusted, $M) WAVE 2 $ 7.9 Consumer • Implement plant consolidations $ 3.1 CPG verified in Wave 1 $ 5.2 PCG $ 7.8 SPG $ 24.0 WAVE 3 Total RPM $ 24.0 $ 24.0 $ 48.0 Risk Adjusted • Continue implementation of plant asset optimization 11/28/18 35Asset Optimization RPM - FACILITY CLOSURE LIST OPTIMIZE ASSETS Under Review In Process Total 2020/2021 Number of Plants WAVE 1 2 Consumer • Implement in-flight projects 3 CPG 3 PCG • Study and stress test plants 4 SPG under consideration 12 19 31 Total RPM • Analyze and develop RPM Europe and UK manufacturing footprint Estimated Savings (risk-adjusted, $M) WAVE 2 $ 7.9 Consumer • Implement plant consolidations $ 3.1 CPG verified in Wave 1 $ 5.2 PCG $ 7.8 SPG $ 24.0 WAVE 3 Total RPM $ 24.0 $ 24.0 $ 48.0 Risk Adjusted • Continue implementation of plant asset optimization 11/28/18 35
Manufacturing – MAP 2020 Three tactics for Implementation 1. Zero Based Yield (ZBY) and OEE (Overall Equipment Effectiveness) ✓ RPM Manufacturing System (MS-168) 2. Asset Optimization 3. Inventory Reduction 11/28/18 36Manufacturing – MAP 2020 Three tactics for Implementation 1. Zero Based Yield (ZBY) and OEE (Overall Equipment Effectiveness) ✓ RPM Manufacturing System (MS-168) 2. Asset Optimization 3. Inventory Reduction 11/28/18 36
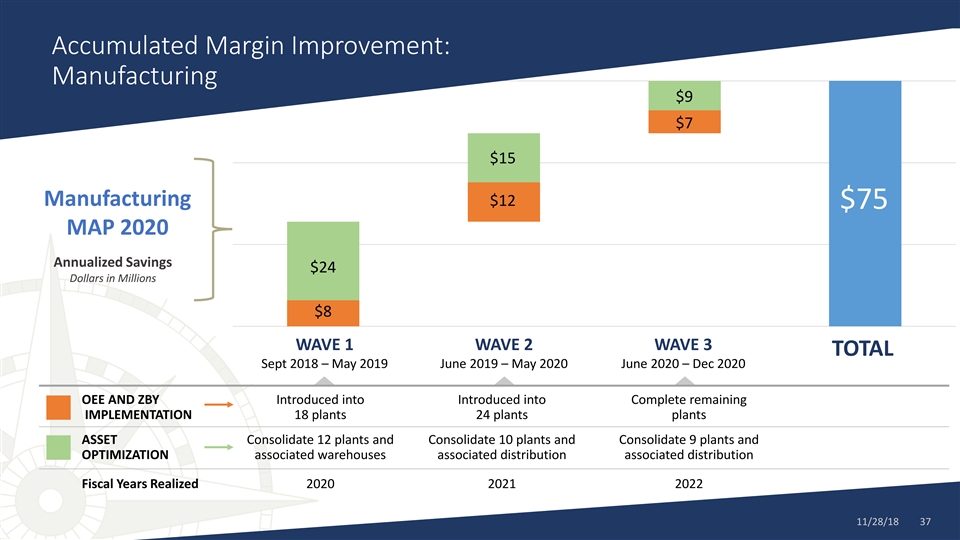
Accumulated Margin Improvement: Manufacturing $9 $7 $15 Manufacturing $12 $75 MAP 2020 Annualized Savings $24 Dollars in Millions $8 WAVE 1 WAVE 2 WAVE 3 TOTAL Sept 2018 – May 2019 June 2019 – May 2020 June 2020 – Dec 2020 OEE AND ZBY Introduced into Introduced into Complete remaining IMPLEMENTATION 18 plants 24 plants plants ASSET Consolidate 12 plants and Consolidate 10 plants and Consolidate 9 plants and OPTIMIZATION associated warehouses associated distribution associated distribution Fiscal Years Realized 2020 2021 2022 11/28/18 37Accumulated Margin Improvement: Manufacturing $9 $7 $15 Manufacturing $12 $75 MAP 2020 Annualized Savings $24 Dollars in Millions $8 WAVE 1 WAVE 2 WAVE 3 TOTAL Sept 2018 – May 2019 June 2019 – May 2020 June 2020 – Dec 2020 OEE AND ZBY Introduced into Introduced into Complete remaining IMPLEMENTATION 18 plants 24 plants plants ASSET Consolidate 12 plants and Consolidate 10 plants and Consolidate 9 plants and OPTIMIZATION associated warehouses associated distribution associated distribution Fiscal Years Realized 2020 2021 2022 11/28/18 37

Click to edit Master title style Procurement Strategy Overview Click to edit Master subtitle style Timothy R. Kinser Vice President - Operations 11/28/18 38Click to edit Master title style Procurement Strategy Overview Click to edit Master subtitle style Timothy R. Kinser Vice President - Operations 11/28/18 38
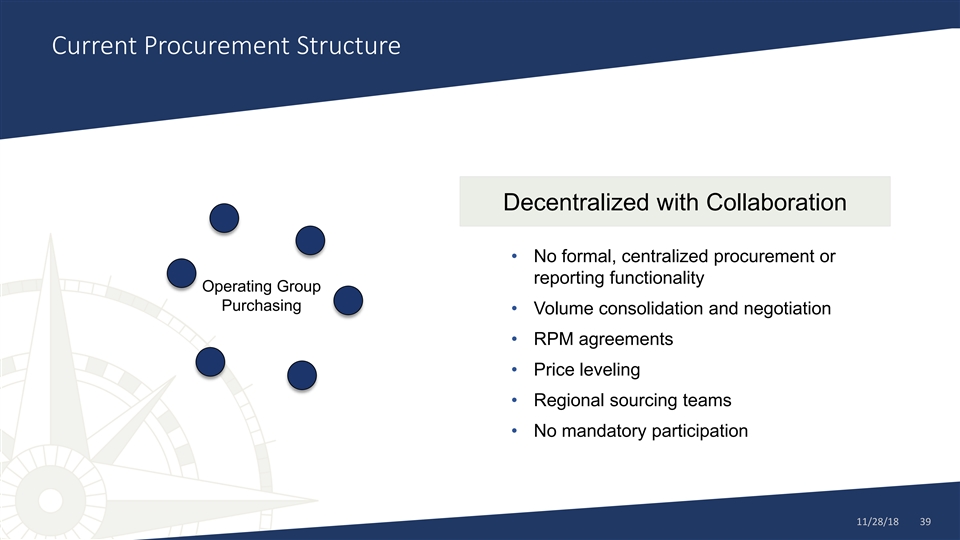
Current Procurement Structure Decentralized with Collaboration • No formal, centralized procurement or reporting functionality Operating Group Purchasing • Volume consolidation and negotiation • RPM agreements • Price leveling • Regional sourcing teams • No mandatory participation 11/28/18 39Current Procurement Structure Decentralized with Collaboration • No formal, centralized procurement or reporting functionality Operating Group Purchasing • Volume consolidation and negotiation • RPM agreements • Price leveling • Regional sourcing teams • No mandatory participation 11/28/18 39
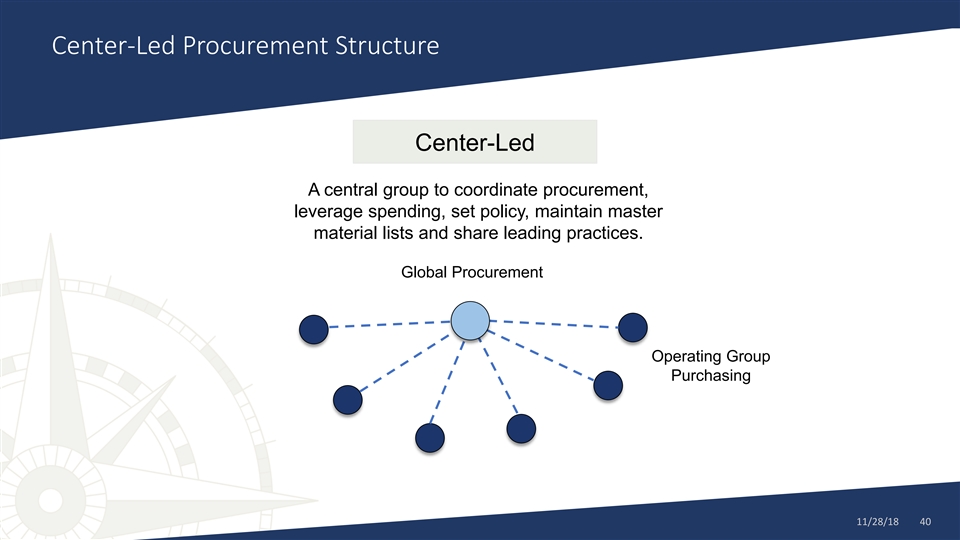
Center-Led Procurement Structure Center-Led A central group to coordinate procurement, leverage spending, set policy, maintain master material lists and share leading practices. Global Procurement Operating Group Purchasing 11/28/18 40Center-Led Procurement Structure Center-Led A central group to coordinate procurement, leverage spending, set policy, maintain master material lists and share leading practices. Global Procurement Operating Group Purchasing 11/28/18 40
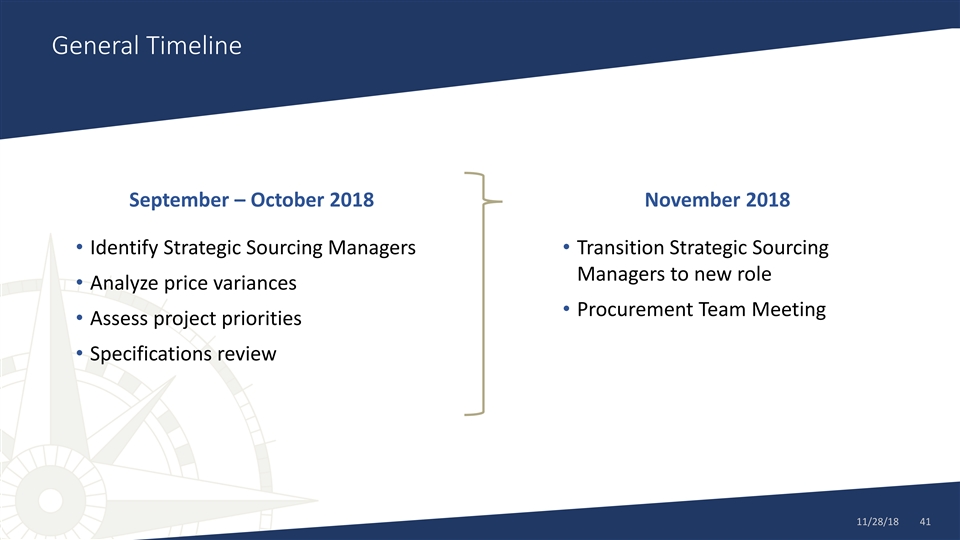
General Timeline September – October 2018 November 2018 • Identify Strategic Sourcing Managers • Transition Strategic Sourcing Managers to new role • Analyze price variances • Procurement Team Meeting • Assess project priorities • Specifications review 11/28/18 41General Timeline September – October 2018 November 2018 • Identify Strategic Sourcing Managers • Transition Strategic Sourcing Managers to new role • Analyze price variances • Procurement Team Meeting • Assess project priorities • Specifications review 11/28/18 41
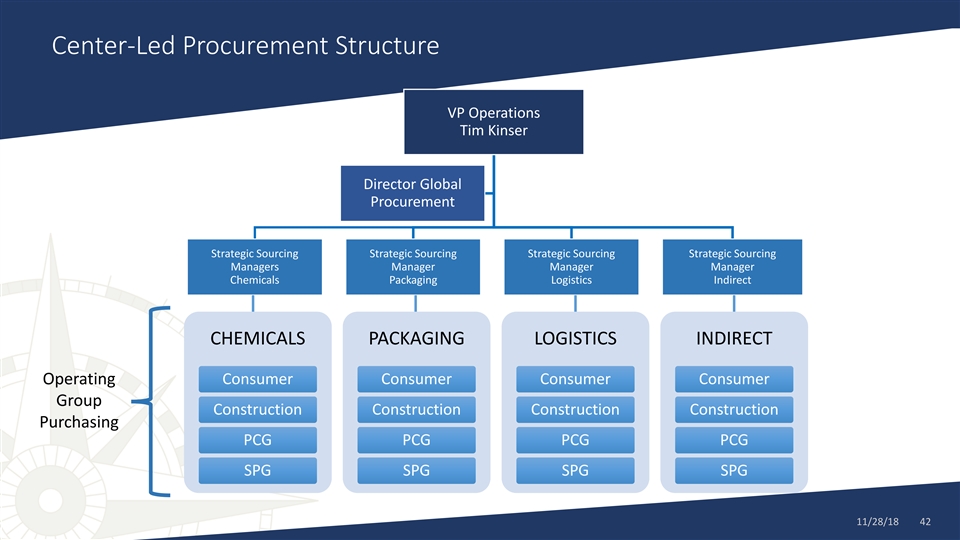
Center-Led Procurement Structure VP Operations Tim Kinser Director Global Procurement Strategic Sourcing Strategic Sourcing Strategic Sourcing Strategic Sourcing Managers Manager Manager Manager Chemicals Packaging Logistics Indirect CHEMICALS PACKAGING LOGISTICS INDIRECT Operating Consumer Consumer Consumer Consumer Group Construction Construction Construction Construction Purchasing PCG PCG PCG PCG SPG SPG SPG SPG 11/28/18 42Center-Led Procurement Structure VP Operations Tim Kinser Director Global Procurement Strategic Sourcing Strategic Sourcing Strategic Sourcing Strategic Sourcing Managers Manager Manager Manager Chemicals Packaging Logistics Indirect CHEMICALS PACKAGING LOGISTICS INDIRECT Operating Consumer Consumer Consumer Consumer Group Construction Construction Construction Construction Purchasing PCG PCG PCG PCG SPG SPG SPG SPG 11/28/18 42
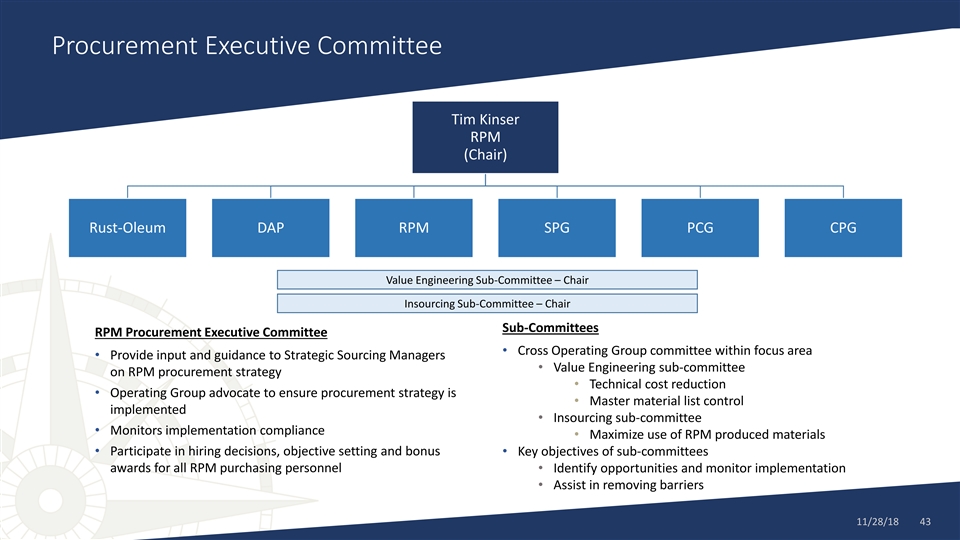
Procurement Executive Committee Tim Kinser RPM (Chair) Rust-Oleum DAP RPM SPG PCG CPG Value Engineering Sub-Committee – Chair Insourcing Sub-Committee – Chair Sub-Committees RPM Procurement Executive Committee • Cross Operating Group committee within focus area • Provide input and guidance to Strategic Sourcing Managers • Value Engineering sub-committee on RPM procurement strategy • Technical cost reduction • Operating Group advocate to ensure procurement strategy is • Master material list control implemented • Insourcing sub-committee • Monitors implementation compliance • Maximize use of RPM produced materials • Participate in hiring decisions, objective setting and bonus • Key objectives of sub-committees awards for all RPM purchasing personnel • Identify opportunities and monitor implementation • Assist in removing barriers 11/28/18 43Procurement Executive Committee Tim Kinser RPM (Chair) Rust-Oleum DAP RPM SPG PCG CPG Value Engineering Sub-Committee – Chair Insourcing Sub-Committee – Chair Sub-Committees RPM Procurement Executive Committee • Cross Operating Group committee within focus area • Provide input and guidance to Strategic Sourcing Managers • Value Engineering sub-committee on RPM procurement strategy • Technical cost reduction • Operating Group advocate to ensure procurement strategy is • Master material list control implemented • Insourcing sub-committee • Monitors implementation compliance • Maximize use of RPM produced materials • Participate in hiring decisions, objective setting and bonus • Key objectives of sub-committees awards for all RPM purchasing personnel • Identify opportunities and monitor implementation • Assist in removing barriers 11/28/18 43
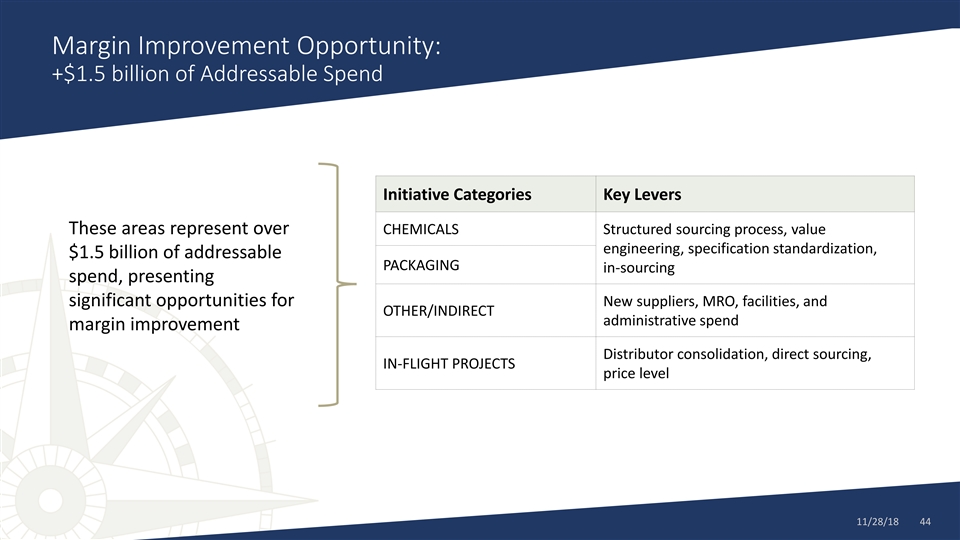
Margin Improvement Opportunity: +$1.5 billion of Addressable Spend Initiative Categories Key Levers These areas represent over CHEMICALS Structured sourcing process, value engineering, specification standardization, $1.5 billion of addressable PACKAGING in-sourcing spend, presenting significant opportunities for New suppliers, MRO, facilities, and OTHER/INDIRECT administrative spend margin improvement Distributor consolidation, direct sourcing, IN-FLIGHT PROJECTS price level 11/28/18 44Margin Improvement Opportunity: +$1.5 billion of Addressable Spend Initiative Categories Key Levers These areas represent over CHEMICALS Structured sourcing process, value engineering, specification standardization, $1.5 billion of addressable PACKAGING in-sourcing spend, presenting significant opportunities for New suppliers, MRO, facilities, and OTHER/INDIRECT administrative spend margin improvement Distributor consolidation, direct sourcing, IN-FLIGHT PROJECTS price level 11/28/18 44
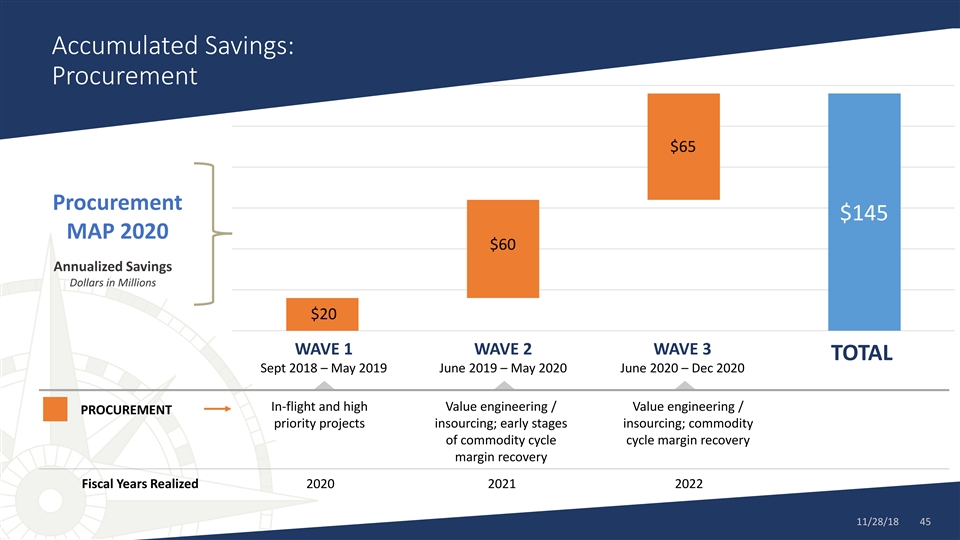
Accumulated Savings: Procurement $65 Procurement $145 MAP 2020 $60 Annualized Savings Dollars in Millions $20 WAVE 1 WAVE 2 WAVE 3 TOTAL Sept 2018 – May 2019 June 2019 – May 2020 June 2020 – Dec 2020 In-flight and high Value engineering / Value engineering / PROCUREMENT priority projects insourcing; early stages insourcing; commodity of commodity cycle cycle margin recovery margin recovery Fiscal Years Realized 2020 2021 2022 11/28/18 45Accumulated Savings: Procurement $65 Procurement $145 MAP 2020 $60 Annualized Savings Dollars in Millions $20 WAVE 1 WAVE 2 WAVE 3 TOTAL Sept 2018 – May 2019 June 2019 – May 2020 June 2020 – Dec 2020 In-flight and high Value engineering / Value engineering / PROCUREMENT priority projects insourcing; early stages insourcing; commodity of commodity cycle cycle margin recovery margin recovery Fiscal Years Realized 2020 2021 2022 11/28/18 45

Click to edit Master title style G&A Strategy Overview Click to edit Master subtitle style Stephen J. Knoop Head of Group Restructuring 11/28/18 46Click to edit Master title style G&A Strategy Overview Click to edit Master subtitle style Stephen J. Knoop Head of Group Restructuring 11/28/18 46
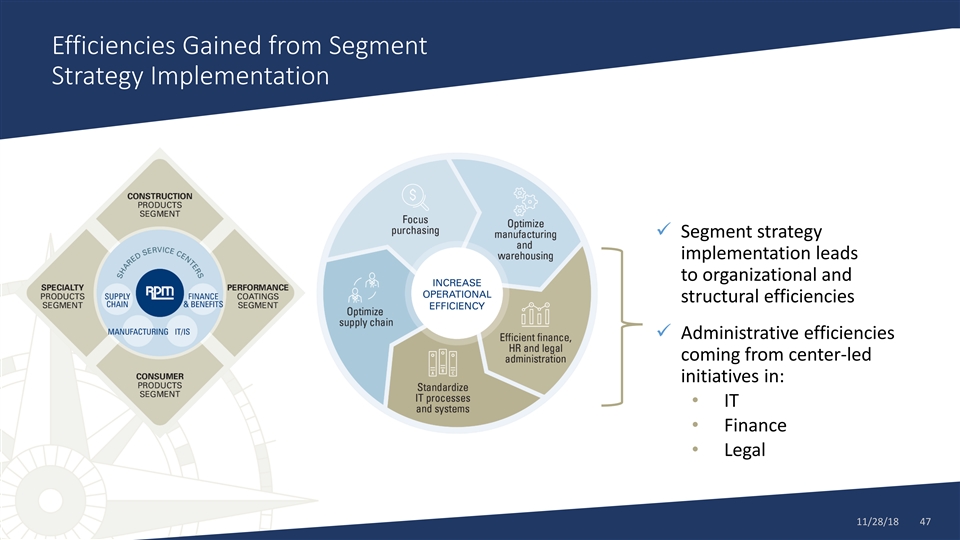
Efficiencies Gained from Segment Strategy Implementation ✓ Segment strategy implementation leads to organizational and structural efficiencies ✓ Administrative efficiencies coming from center-led initiatives in: • IT • Finance • Legal 11/28/18 47Efficiencies Gained from Segment Strategy Implementation ✓ Segment strategy implementation leads to organizational and structural efficiencies ✓ Administrative efficiencies coming from center-led initiatives in: • IT • Finance • Legal 11/28/18 47

Click to edit Master title style Information Technology Overview Click to edit Master subtitle style Lonny R. DiRusso Vice President and Chief Information Officer 11/28/18 48Click to edit Master title style Information Technology Overview Click to edit Master subtitle style Lonny R. DiRusso Vice President and Chief Information Officer 11/28/18 48
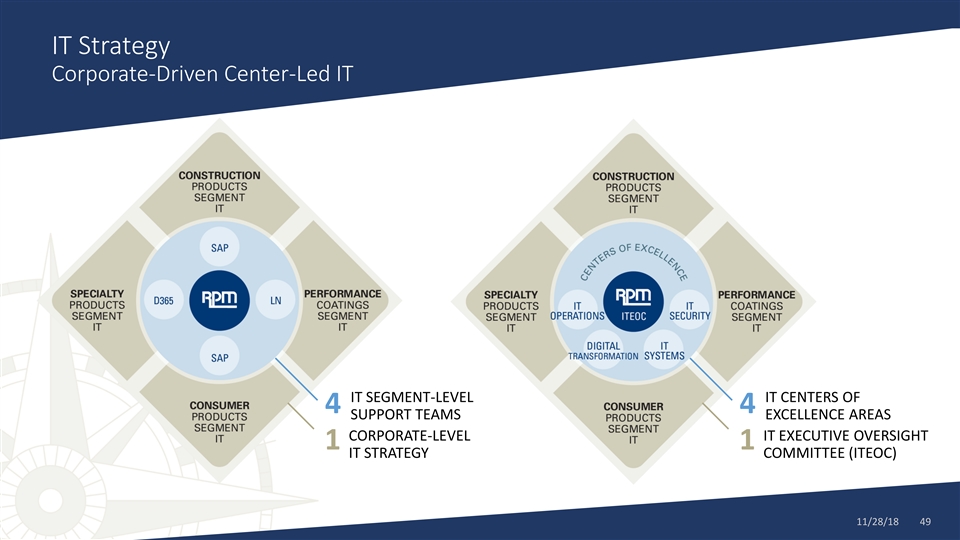
IT Strategy Corporate-Driven Center-Led IT IT SEGMENT-LEVEL IT CENTERS OF 4 4 SUPPORT TEAMS EXCELLENCE AREAS CORPORATE-LEVEL IT EXECUTIVE OVERSIGHT 1 1 IT STRATEGY COMMITTEE (ITEOC) 11/28/18 49IT Strategy Corporate-Driven Center-Led IT IT SEGMENT-LEVEL IT CENTERS OF 4 4 SUPPORT TEAMS EXCELLENCE AREAS CORPORATE-LEVEL IT EXECUTIVE OVERSIGHT 1 1 IT STRATEGY COMMITTEE (ITEOC) 11/28/18 49
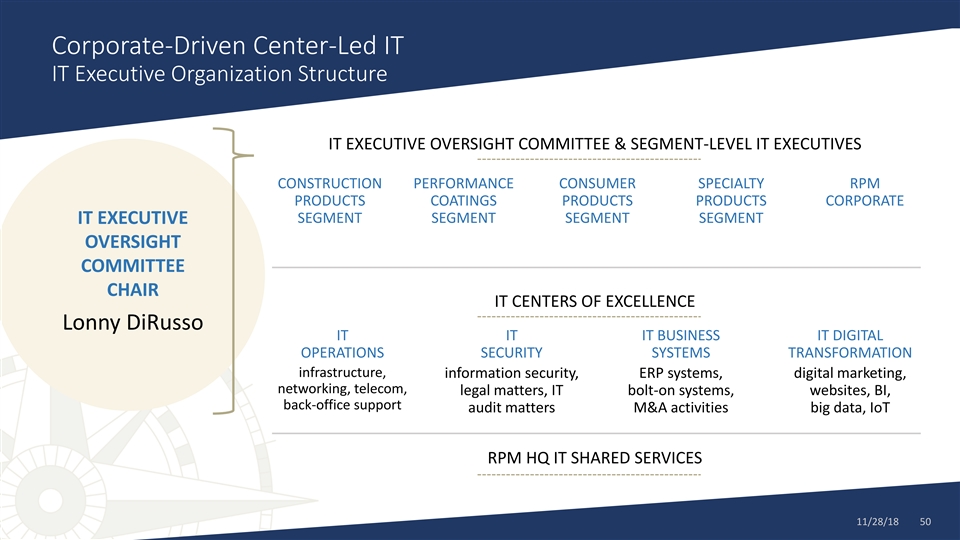
Corporate-Driven Center-Led IT IT Executive Organization Structure IT EXECUTIVE OVERSIGHT COMMITTEE & SEGMENT-LEVEL IT EXECUTIVES CONSTRUCTION PERFORMANCE CONSUMER SPECIALTY RPM PRODUCTS COATINGS PRODUCTS PRODUCTS CORPORATE SEGMENT SEGMENT SEGMENT SEGMENT IT EXECUTIVE OVERSIGHT COMMITTEE CHAIR IT CENTERS OF EXCELLENCE Lonny DiRusso IT IT IT BUSINESS IT DIGITAL OPERATIONS SECURITY SYSTEMS TRANSFORMATION infrastructure, information security, ERP systems, digital marketing, networking, telecom, legal matters, IT bolt-on systems, websites, BI, back-office support audit matters M&A activities big data, IoT RPM HQ IT SHARED SERVICES 11/28/18 50Corporate-Driven Center-Led IT IT Executive Organization Structure IT EXECUTIVE OVERSIGHT COMMITTEE & SEGMENT-LEVEL IT EXECUTIVES CONSTRUCTION PERFORMANCE CONSUMER SPECIALTY RPM PRODUCTS COATINGS PRODUCTS PRODUCTS CORPORATE SEGMENT SEGMENT SEGMENT SEGMENT IT EXECUTIVE OVERSIGHT COMMITTEE CHAIR IT CENTERS OF EXCELLENCE Lonny DiRusso IT IT IT BUSINESS IT DIGITAL OPERATIONS SECURITY SYSTEMS TRANSFORMATION infrastructure, information security, ERP systems, digital marketing, networking, telecom, legal matters, IT bolt-on systems, websites, BI, back-office support audit matters M&A activities big data, IoT RPM HQ IT SHARED SERVICES 11/28/18 50
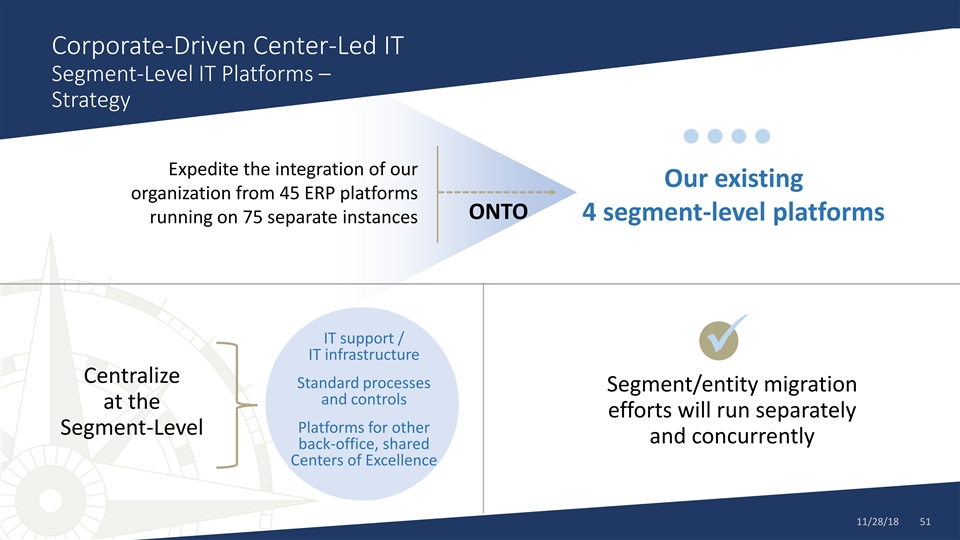
Corporate-Driven Center-Led IT Segment-Level IT Platforms – Strategy Expedite the integration of our Our existing organization from 45 ERP platforms ONTO 4 segment-level platforms running on 75 separate instances IT support / IT infrastructure✓ Centralize Standard processes Segment/entity migration and controls at the efforts will run separately Platforms for other Segment-Level and concurrently back-office, shared Centers of Excellence 11/28/18 51Corporate-Driven Center-Led IT Segment-Level IT Platforms – Strategy Expedite the integration of our Our existing organization from 45 ERP platforms ONTO 4 segment-level platforms running on 75 separate instances IT support / IT infrastructure✓ Centralize Standard processes Segment/entity migration and controls at the efforts will run separately Platforms for other Segment-Level and concurrently back-office, shared Centers of Excellence 11/28/18 51
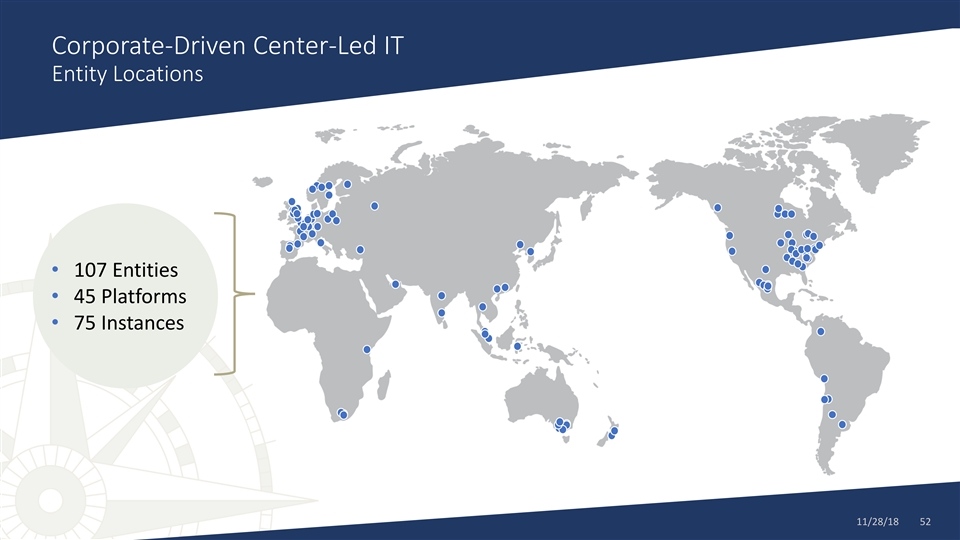
Corporate-Driven Center-Led IT Entity Locations • 107 Entities • 45 Platforms • 75 Instances 11/28/18 52Corporate-Driven Center-Led IT Entity Locations • 107 Entities • 45 Platforms • 75 Instances 11/28/18 52
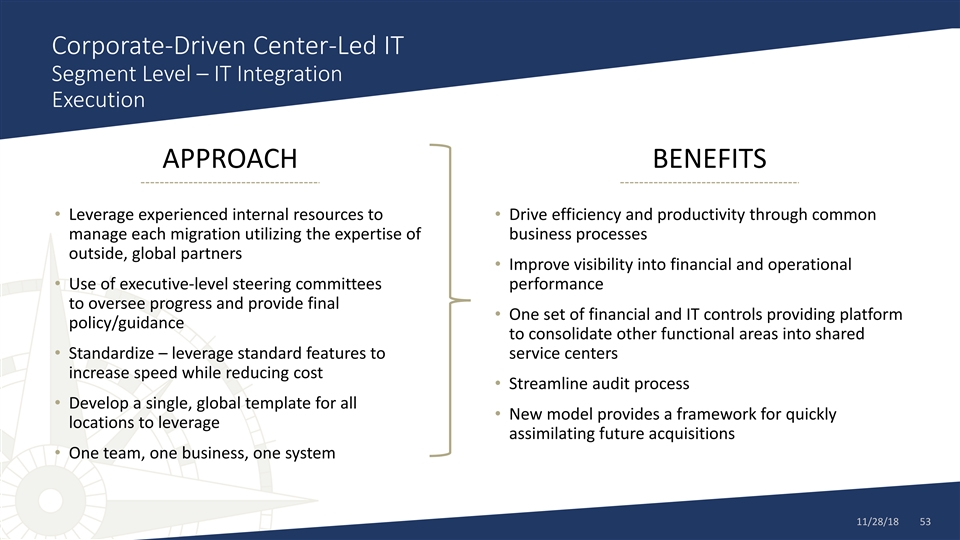
Corporate-Driven Center-Led IT Segment Level – IT Integration Execution APPROACH BENEFITS • Leverage experienced internal resources to • Drive efficiency and productivity through common manage each migration utilizing the expertise of business processes outside, global partners • Improve visibility into financial and operational • Use of executive-level steering committees performance to oversee progress and provide final • One set of financial and IT controls providing platform policy/guidance to consolidate other functional areas into shared • Standardize – leverage standard features to service centers increase speed while reducing cost • Streamline audit process • Develop a single, global template for all • New model provides a framework for quickly locations to leverage assimilating future acquisitions • One team, one business, one system 11/28/18 53Corporate-Driven Center-Led IT Segment Level – IT Integration Execution APPROACH BENEFITS • Leverage experienced internal resources to • Drive efficiency and productivity through common manage each migration utilizing the expertise of business processes outside, global partners • Improve visibility into financial and operational • Use of executive-level steering committees performance to oversee progress and provide final • One set of financial and IT controls providing platform policy/guidance to consolidate other functional areas into shared • Standardize – leverage standard features to service centers increase speed while reducing cost • Streamline audit process • Develop a single, global template for all • New model provides a framework for quickly locations to leverage assimilating future acquisitions • One team, one business, one system 11/28/18 53
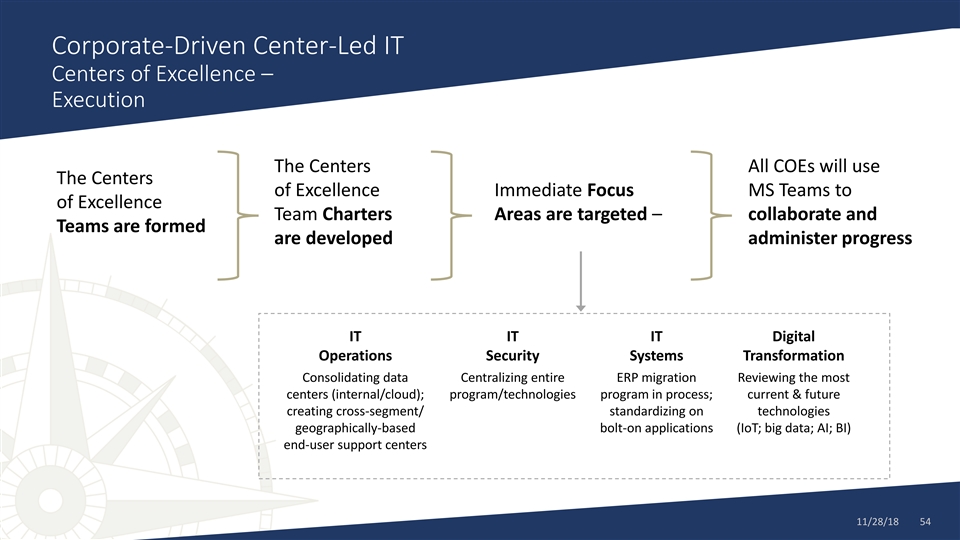
Corporate-Driven Center-Led IT Centers of Excellence – Execution The Centers All COEs will use The Centers of Excellence Immediate Focus MS Teams to of Excellence Team Charters Areas are targeted – collaborate and Teams are formed are developed administer progress IT IT IT Digital Operations Security Systems Transformation Consolidating data Centralizing entire ERP migration Reviewing the most centers (internal/cloud); program/technologies program in process; current & future creating cross-segment/ standardizing on technologies geographically-based bolt-on applications (IoT; big data; AI; BI) end-user support centers 11/28/18 54Corporate-Driven Center-Led IT Centers of Excellence – Execution The Centers All COEs will use The Centers of Excellence Immediate Focus MS Teams to of Excellence Team Charters Areas are targeted – collaborate and Teams are formed are developed administer progress IT IT IT Digital Operations Security Systems Transformation Consolidating data Centralizing entire ERP migration Reviewing the most centers (internal/cloud); program/technologies program in process; current & future creating cross-segment/ standardizing on technologies geographically-based bolt-on applications (IoT; big data; AI; BI) end-user support centers 11/28/18 54

Click to edit Master title style 2020 MAP to Growth SG&A Click to edit Master subtitle style Russell L. Gordon Vice President and Chief Financial Officer 11/28/18 55Click to edit Master title style 2020 MAP to Growth SG&A Click to edit Master subtitle style Russell L. Gordon Vice President and Chief Financial Officer 11/28/18 55
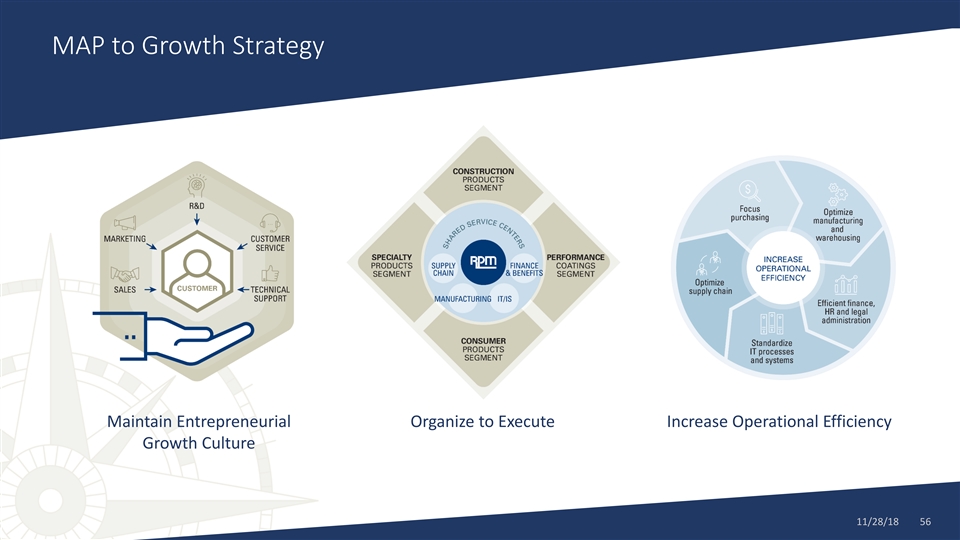
MAP to Growth Strategy Maintain Entrepreneurial Organize to Execute Increase Operational Efficiency Growth Culture 11/28/18 56MAP to Growth Strategy Maintain Entrepreneurial Organize to Execute Increase Operational Efficiency Growth Culture 11/28/18 56
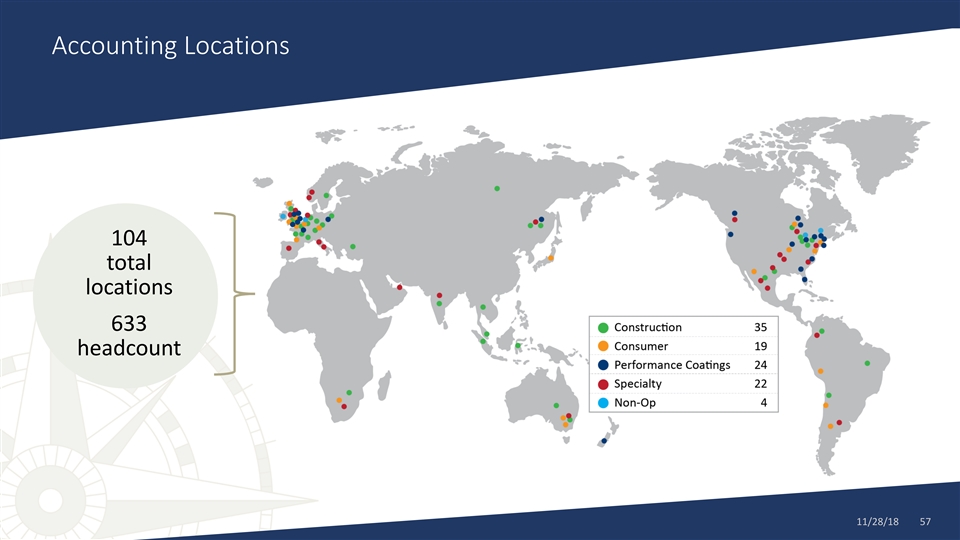
Accounting Locations 104 total locations 633 headcount 11/28/18 57Accounting Locations 104 total locations 633 headcount 11/28/18 57
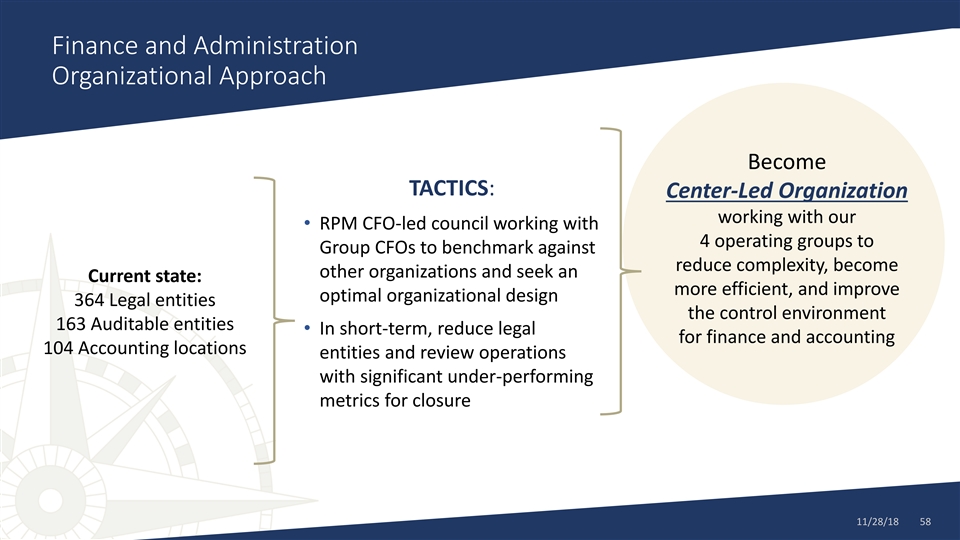
Finance and Administration Organizational Approach Become TACTICS: Center-Led Organization working with our • RPM CFO-led council working with 4 operating groups to Group CFOs to benchmark against reduce complexity, become other organizations and seek an Current state: more efficient, and improve optimal organizational design 364 Legal entities the control environment 163 Auditable entities • In short-term, reduce legal for finance and accounting 104 Accounting locations entities and review operations with significant under-performing metrics for closure 11/28/18 58Finance and Administration Organizational Approach Become TACTICS: Center-Led Organization working with our • RPM CFO-led council working with 4 operating groups to Group CFOs to benchmark against reduce complexity, become other organizations and seek an Current state: more efficient, and improve optimal organizational design 364 Legal entities the control environment 163 Auditable entities • In short-term, reduce legal for finance and accounting 104 Accounting locations entities and review operations with significant under-performing metrics for closure 11/28/18 58
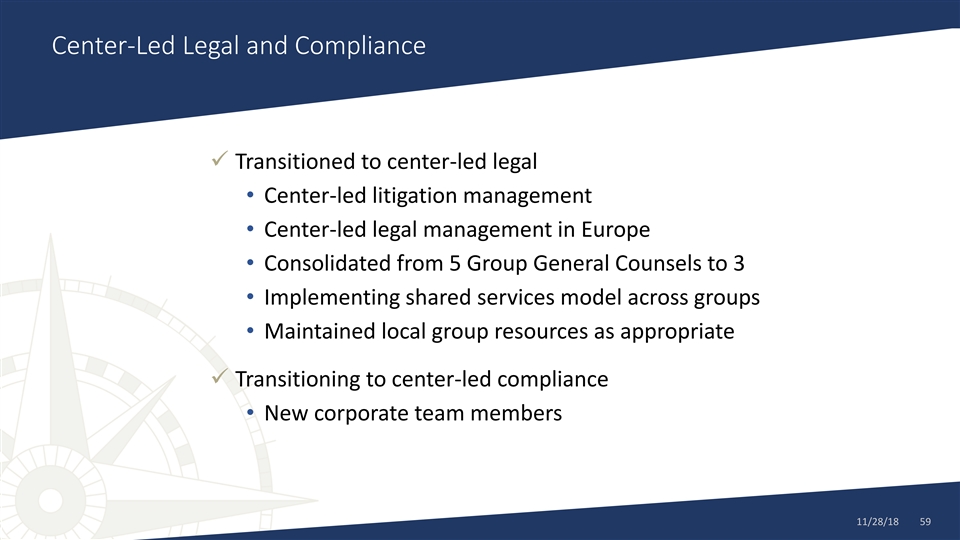
Center-Led Legal and Compliance ✓ Transitioned to center-led legal • Center-led litigation management • Center-led legal management in Europe • Consolidated from 5 Group General Counsels to 3 • Implementing shared services model across groups • Maintained local group resources as appropriate ✓ Transitioning to center-led compliance • New corporate team members 11/28/18 59Center-Led Legal and Compliance ✓ Transitioned to center-led legal • Center-led litigation management • Center-led legal management in Europe • Consolidated from 5 Group General Counsels to 3 • Implementing shared services model across groups • Maintained local group resources as appropriate ✓ Transitioning to center-led compliance • New corporate team members 11/28/18 59
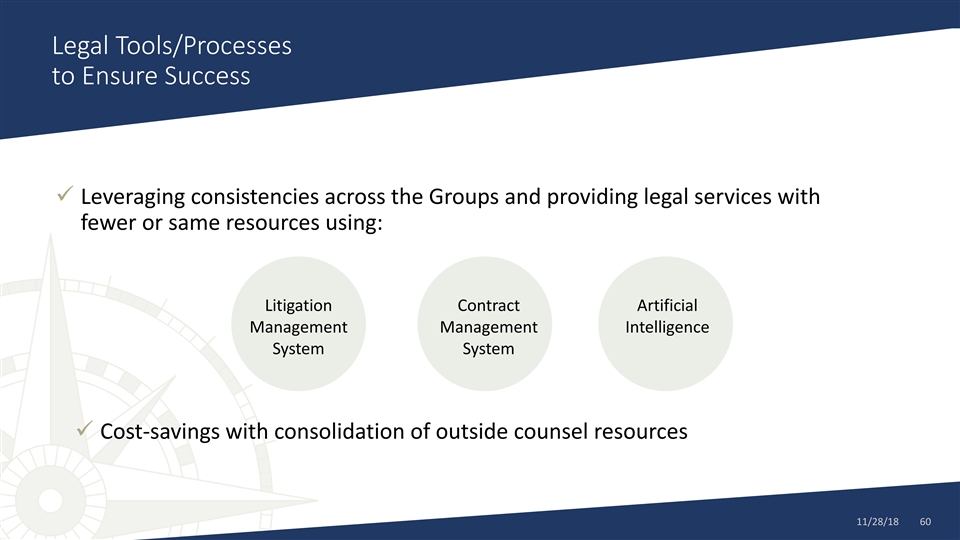
Legal Tools/Processes to Ensure Success ✓ Leveraging consistencies across the Groups and providing legal services with fewer or same resources using: Litigation Contract Artificial Management Management Intelligence System System ✓ Cost-savings with consolidation of outside counsel resources 11/28/18 60Legal Tools/Processes to Ensure Success ✓ Leveraging consistencies across the Groups and providing legal services with fewer or same resources using: Litigation Contract Artificial Management Management Intelligence System System ✓ Cost-savings with consolidation of outside counsel resources 11/28/18 60
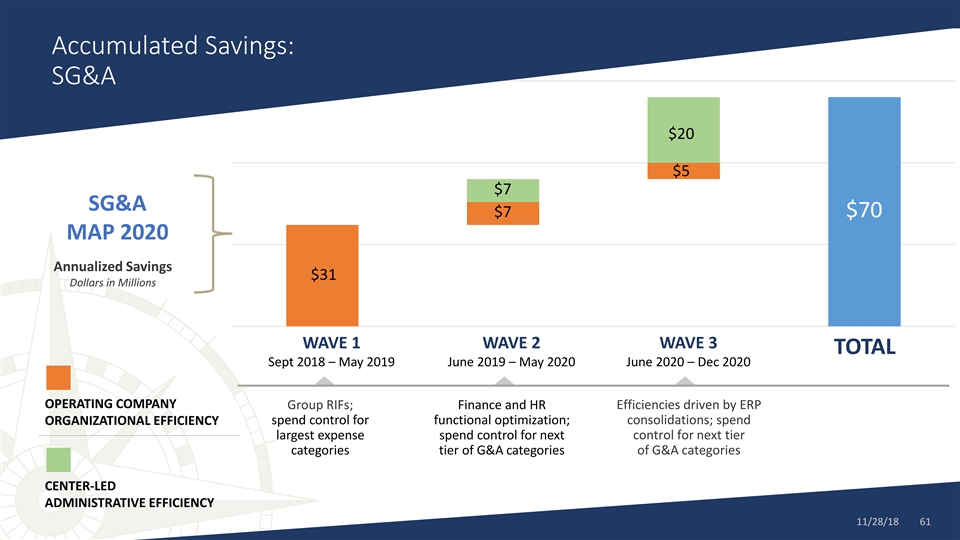
Accumulated Savings: SG&A $20 $5 $7 SG&A $7 $70 MAP 2020 Annualized Savings $31 Dollars in Millions WAVE 1 WAVE 2 WAVE 3 TOTAL Sept 2018 – May 2019 June 2019 – May 2020 June 2020 – Dec 2020 OPERATING COMPANY Group RIFs; Finance and HR Efficiencies driven by ERP spend control for functional optimization; consolidations; spend ORGANIZATIONAL EFFICIENCY largest expense spend control for next control for next tier categories tier of G&A categories of G&A categories CENTER-LED ADMINISTRATIVE EFFICIENCY 11/28/18 61Accumulated Savings: SG&A $20 $5 $7 SG&A $7 $70 MAP 2020 Annualized Savings $31 Dollars in Millions WAVE 1 WAVE 2 WAVE 3 TOTAL Sept 2018 – May 2019 June 2019 – May 2020 June 2020 – Dec 2020 OPERATING COMPANY Group RIFs; Finance and HR Efficiencies driven by ERP spend control for functional optimization; consolidations; spend ORGANIZATIONAL EFFICIENCY largest expense spend control for next control for next tier categories tier of G&A categories of G&A categories CENTER-LED ADMINISTRATIVE EFFICIENCY 11/28/18 61
Summary ✓ As company has grown, we have reached the scale to improve efficiency ✓ Can eliminate redundancies without impacting customer experience ✓ “No stone unturned” in our review ✓ Plans and people in place to execute ✓ Will create better platforms to: • Extend our business via acquisition • Leverage top-line growth to bottom line ✓ Continuous improvement process will be part of our culture after MAP project is completed 11/28/18 62Summary ✓ As company has grown, we have reached the scale to improve efficiency ✓ Can eliminate redundancies without impacting customer experience ✓ “No stone unturned” in our review ✓ Plans and people in place to execute ✓ Will create better platforms to: • Extend our business via acquisition • Leverage top-line growth to bottom line ✓ Continuous improvement process will be part of our culture after MAP project is completed 11/28/18 62
Click to edit Master title style Cash Generation & Capital Allocation Click to edit Master subtitle style Russell L. Gordon Vice President and Chief Financial Officer 11/28/18 63Click to edit Master title style Cash Generation & Capital Allocation Click to edit Master subtitle style Russell L. Gordon Vice President and Chief Financial Officer 11/28/18 63
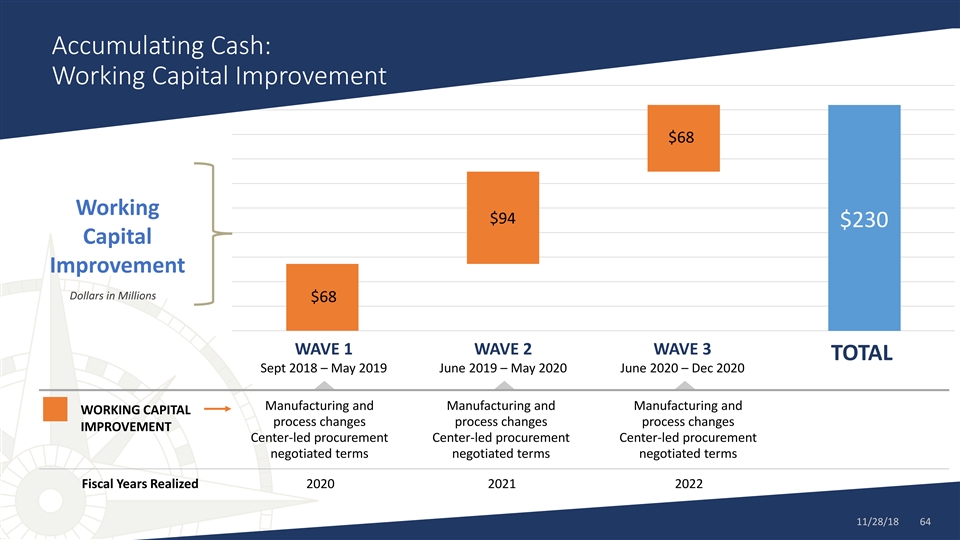
Accumulating Cash: Working Capital Improvement $68 Working $94 $230 Capital Improvement Dollars in Millions $68 WAVE 1 WAVE 2 WAVE 3 TOTAL Sept 2018 – May 2019 June 2019 – May 2020 June 2020 – Dec 2020 Manufacturing and Manufacturing and Manufacturing and WORKING CAPITAL process changes process changes process changes IMPROVEMENT Center-led procurement Center-led procurement Center-led procurement negotiated terms negotiated terms negotiated terms Fiscal Years Realized 2020 2021 2022 11/28/18 64Accumulating Cash: Working Capital Improvement $68 Working $94 $230 Capital Improvement Dollars in Millions $68 WAVE 1 WAVE 2 WAVE 3 TOTAL Sept 2018 – May 2019 June 2019 – May 2020 June 2020 – Dec 2020 Manufacturing and Manufacturing and Manufacturing and WORKING CAPITAL process changes process changes process changes IMPROVEMENT Center-led procurement Center-led procurement Center-led procurement negotiated terms negotiated terms negotiated terms Fiscal Years Realized 2020 2021 2022 11/28/18 64
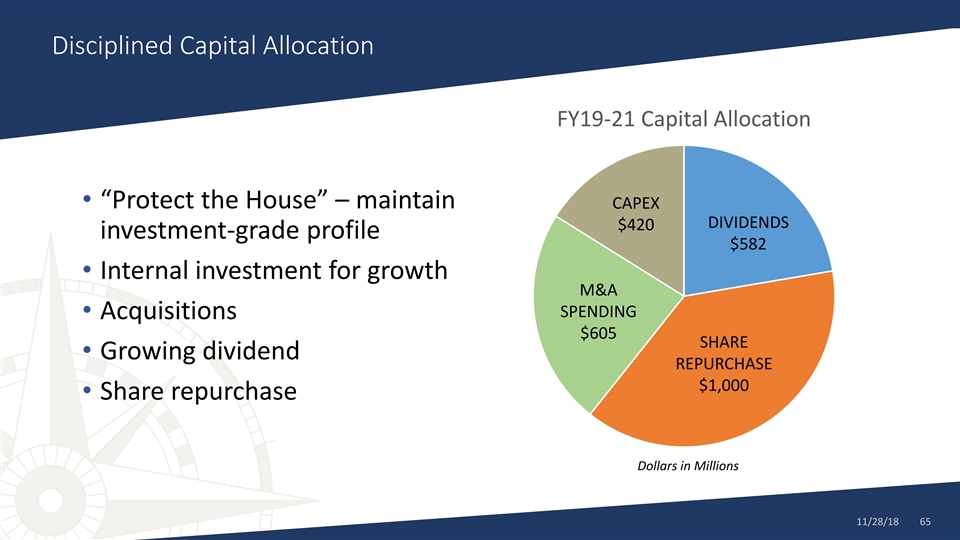
Disciplined Capital Allocation FY19-21 Capital Allocation • “Protect the House” – maintain CAPEX DIVIDENDS $420 investment-grade profile $582 • Internal investment for growth M&A SPENDING • Acquisitions $605 SHARE • Growing dividend REPURCHASE $1,000 • Share repurchase Dollars in Millions 11/28/18 65Disciplined Capital Allocation FY19-21 Capital Allocation • “Protect the House” – maintain CAPEX DIVIDENDS $420 investment-grade profile $582 • Internal investment for growth M&A SPENDING • Acquisitions $605 SHARE • Growing dividend REPURCHASE $1,000 • Share repurchase Dollars in Millions 11/28/18 65

Improvements in Cash Flow $950.0 ($75.0) $850.0 $36.6 Sources of $290.0 improvement $750.0 in cash flow $650.0 from operations $872.0 FY19-21 $550.0 Dollars in Millions $230.0 $450.0 $390.4 $350.0 FY18 Cash Flow WC Improve MAP Savings Tax on MAP Other FY21 Cash Flow from Operations Savings from Operations 11/28/18 66Improvements in Cash Flow $950.0 ($75.0) $850.0 $36.6 Sources of $290.0 improvement $750.0 in cash flow $650.0 from operations $872.0 FY19-21 $550.0 Dollars in Millions $230.0 $450.0 $390.4 $350.0 FY18 Cash Flow WC Improve MAP Savings Tax on MAP Other FY21 Cash Flow from Operations Savings from Operations 11/28/18 66

Cash Flow from Operations $2,500 $2,000 ($1,000) $1,500 FY19-FY21 Sources/(Uses) $2,199 $1,000 ($605) of Cash $500 Dollars in Millions ($582) $0 ($317) ($420) ($109) $200 -$500 3-Year Share M&A Dividends Capex Convertible Other Change Cash Flow Repurchases Shares in Debt 11/28/18 67Cash Flow from Operations $2,500 $2,000 ($1,000) $1,500 FY19-FY21 Sources/(Uses) $2,199 $1,000 ($605) of Cash $500 Dollars in Millions ($582) $0 ($317) ($420) ($109) $200 -$500 3-Year Share M&A Dividends Capex Convertible Other Change Cash Flow Repurchases Shares in Debt 11/28/18 67
Click to edit Master title style 2020 MAP to Growth Summary Click to edit Master subtitle style Frank C. Sullivan Chairman and CEO and Stephen J. Knoop Head of Group Restructuring 11/28/18 68Click to edit Master title style 2020 MAP to Growth Summary Click to edit Master subtitle style Frank C. Sullivan Chairman and CEO and Stephen J. Knoop Head of Group Restructuring 11/28/18 68

Annualized Run Rate Waves Plan Summary to Benefit 2022: $106 MM EBIT $25 We have developed a detailed Implementation Roadmap Annualized Run Rate $65 to Benefit 2021: organized into logical waves $101 MM EBIT $16 $14 Annualized Run Rate $60 $290 to Benefit 2020: Waves Plan $83 MM EBIT $27 MAP 2020 $31 Annualized $20 Run Rate $32 Dollars in Millions WAVE 1 WAVE 2 WAVE 3 TOTAL Sept 2018 – May 2019 June 2019 – May 2020 June 2020 – Dec 2020 Scope: 14 In-flight Initiatives underway, ZBY Scope: 6 In-flight Initiatives, ZBY & OEE Scope: Asset Optimization remaining plants & OEE implementation large plants and Asset Implementation next plants and Asset MANUFACTURING and Asset Optimization Execution Optimization: Validation and Risk analysis Optimization: Prep & Execution Scope: Chemicals, Packaging and MRO; early Scope: Chemicals, Packaging and Insourcing; Scope: In-flight Initiatives, Chemicals PROCUREMENT stages of commodity cycle margin recovery commodity cycle margin recovery Scope: Finance and HR functional Scope: R&D Centers of Excellence; RIFs Scope: Group RIFs; spend control for largest optimization; spend control for next tier of driven by ERP consolidations; spend control G&A expense categories G&A categories for next tier of G&A categories 11/28/1869Annualized Run Rate Waves Plan Summary to Benefit 2022: $106 MM EBIT $25 We have developed a detailed Implementation Roadmap Annualized Run Rate $65 to Benefit 2021: organized into logical waves $101 MM EBIT $16 $14 Annualized Run Rate $60 $290 to Benefit 2020: Waves Plan $83 MM EBIT $27 MAP 2020 $31 Annualized $20 Run Rate $32 Dollars in Millions WAVE 1 WAVE 2 WAVE 3 TOTAL Sept 2018 – May 2019 June 2019 – May 2020 June 2020 – Dec 2020 Scope: 14 In-flight Initiatives underway, ZBY Scope: 6 In-flight Initiatives, ZBY & OEE Scope: Asset Optimization remaining plants & OEE implementation large plants and Asset Implementation next plants and Asset MANUFACTURING and Asset Optimization Execution Optimization: Validation and Risk analysis Optimization: Prep & Execution Scope: Chemicals, Packaging and MRO; early Scope: Chemicals, Packaging and Insourcing; Scope: In-flight Initiatives, Chemicals PROCUREMENT stages of commodity cycle margin recovery commodity cycle margin recovery Scope: Finance and HR functional Scope: R&D Centers of Excellence; RIFs Scope: Group RIFs; spend control for largest optimization; spend control for next tier of driven by ERP consolidations; spend control G&A expense categories G&A categories for next tier of G&A categories 11/28/1869
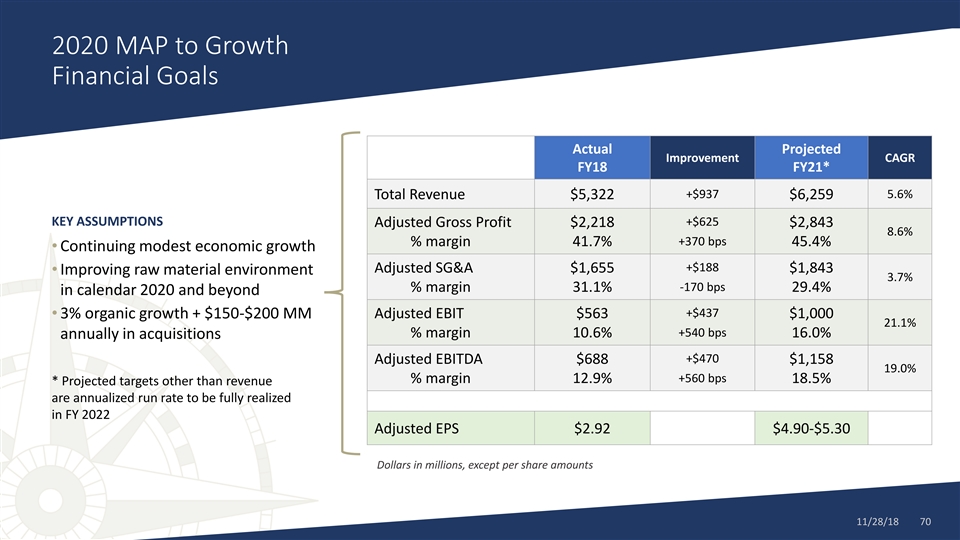
2020 MAP to Growth Financial Goals Actual Projected Improvement CAGR FY18 FY21* +$937 5.6% Total Revenue $5,322 $6,259 KEY ASSUMPTIONS +$625 Adjusted Gross Profit $2,218 $2,843 8.6% +370 bps % margin 41.7% 45.4% • Continuing modest economic growth +$188 Adjusted SG&A $1,655 $1,843 • Improving raw material environment 3.7% -170 bps % margin 31.1% 29.4% in calendar 2020 and beyond +$437 Adjusted EBIT $563 $1,000 • 3% organic growth + $150-$200 MM 21.1% +540 bps % margin 10.6% 16.0% annually in acquisitions +$470 Adjusted EBITDA $688 $1,158 19.0% +560 bps % margin 12.9% 18.5% * Projected targets other than revenue are annualized run rate to be fully realized in FY 2022 Adjusted EPS $2.92 $4.90-$5.30 Dollars in millions, except per share amounts 11/28/18 702020 MAP to Growth Financial Goals Actual Projected Improvement CAGR FY18 FY21* +$937 5.6% Total Revenue $5,322 $6,259 KEY ASSUMPTIONS +$625 Adjusted Gross Profit $2,218 $2,843 8.6% +370 bps % margin 41.7% 45.4% • Continuing modest economic growth +$188 Adjusted SG&A $1,655 $1,843 • Improving raw material environment 3.7% -170 bps % margin 31.1% 29.4% in calendar 2020 and beyond +$437 Adjusted EBIT $563 $1,000 • 3% organic growth + $150-$200 MM 21.1% +540 bps % margin 10.6% 16.0% annually in acquisitions +$470 Adjusted EBITDA $688 $1,158 19.0% +560 bps % margin 12.9% 18.5% * Projected targets other than revenue are annualized run rate to be fully realized in FY 2022 Adjusted EPS $2.92 $4.90-$5.30 Dollars in millions, except per share amounts 11/28/18 70
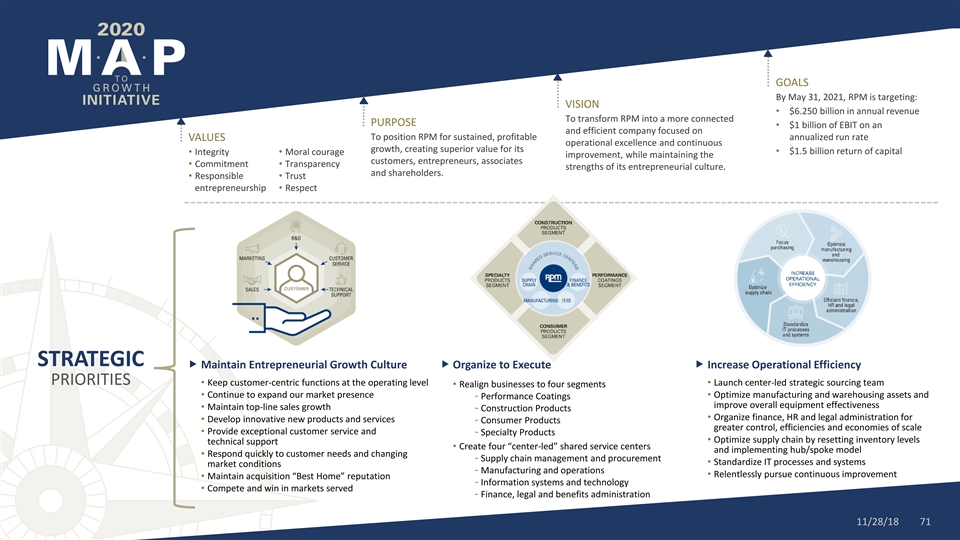
GOALS By May 31, 2021, RPM is targeting: VISION • $6.250 billion in annual revenue To transform RPM into a more connected PURPOSE • $1 billion of EBIT on an and efficient company focused on To position RPM for sustained, profitable annualized run rate VALUES operational excellence and continuous growth, creating superior value for its • $1.5 billion return of capital • Integrity• Moral courage improvement, while maintaining the customers, entrepreneurs, associates • Commitment• Transparency strengths of its entrepreneurial culture. and shareholders. • Responsible • Trust entrepreneurship• Respect STRATEGIC Maintain Entrepreneurial Growth Culture Organize to Execute Increase Operational Efficiency PRIORITIES • Keep customer-centric functions at the operating level• Launch center-led strategic sourcing team • Realign businesses to four segments • Continue to expand our market presence• Optimize manufacturing and warehousing assets and - Performance Coatings improve overall equipment effectiveness • Maintain top-line sales growth - Construction Products • Organize finance, HR and legal administration for • Develop innovative new products and services - Consumer Products greater control, efficiencies and economies of scale • Provide exceptional customer service and - Specialty Products • Optimize supply chain by resetting inventory levels technical support • Create four “center-led” shared service centers and implementing hub/spoke model • Respond quickly to customer needs and changing - Supply chain management and procurement • Standardize IT processes and systems market conditions - Manufacturing and operations • Relentlessly pursue continuous improvement • Maintain acquisition “Best Home” reputation - Information systems and technology • Compete and win in markets served - Finance, legal and benefits administration 11/28/18 71GOALS By May 31, 2021, RPM is targeting: VISION • $6.250 billion in annual revenue To transform RPM into a more connected PURPOSE • $1 billion of EBIT on an and efficient company focused on To position RPM for sustained, profitable annualized run rate VALUES operational excellence and continuous growth, creating superior value for its • $1.5 billion return of capital • Integrity• Moral courage improvement, while maintaining the customers, entrepreneurs, associates • Commitment• Transparency strengths of its entrepreneurial culture. and shareholders. • Responsible • Trust entrepreneurship• Respect STRATEGIC Maintain Entrepreneurial Growth Culture Organize to Execute Increase Operational Efficiency PRIORITIES • Keep customer-centric functions at the operating level• Launch center-led strategic sourcing team • Realign businesses to four segments • Continue to expand our market presence• Optimize manufacturing and warehousing assets and - Performance Coatings improve overall equipment effectiveness • Maintain top-line sales growth - Construction Products • Organize finance, HR and legal administration for • Develop innovative new products and services - Consumer Products greater control, efficiencies and economies of scale • Provide exceptional customer service and - Specialty Products • Optimize supply chain by resetting inventory levels technical support • Create four “center-led” shared service centers and implementing hub/spoke model • Respond quickly to customer needs and changing - Supply chain management and procurement • Standardize IT processes and systems market conditions - Manufacturing and operations • Relentlessly pursue continuous improvement • Maintain acquisition “Best Home” reputation - Information systems and technology • Compete and win in markets served - Finance, legal and benefits administration 11/28/18 71