Fiscal 2019 Third Quarter Supplemental Information April 4, 2019 RPM International Inc. Exhibit 99.2

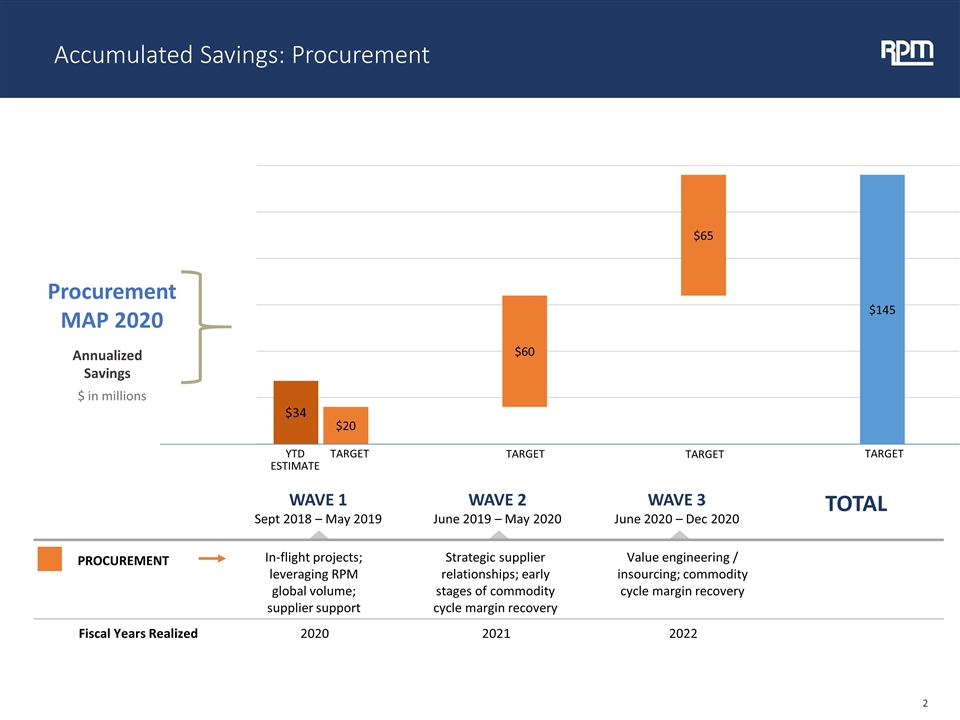
Accumulated Savings: Procurement WAVE 1 Sept 2018 – May 2019 WAVE 2 June 2019 – May 2020 WAVE 3 June 2020 – Dec 2020 TOTAL In-flight projects; leveraging RPM global volume; supplier support Procurement MAP 2020 PROCUREMENT Strategic supplier relationships; early stages of commodity cycle margin recovery Value engineering / insourcing; commodity cycle margin recovery Annualized Savings 2020 Fiscal Years Realized 2021 2022 $ in millions TARGET YTD ESTIMATE TARGET TARGET TARGET

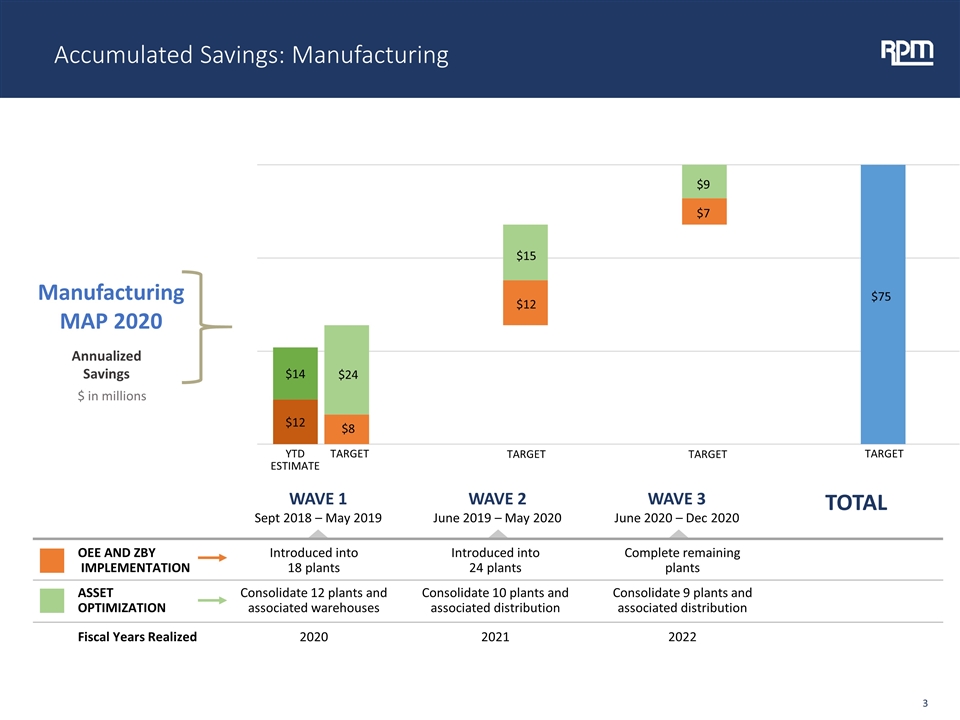
Accumulated Savings: Manufacturing WAVE 1 Sept 2018 – May 2019 WAVE 2 June 2019 – May 2020 WAVE 3 June 2020 – Dec 2020 TOTAL Introduced into 18 plants Manufacturing MAP 2020 OEE AND ZBY IMPLEMENTATION Introduced into 24 plants Complete remaining plants Consolidate 12 plants and associated warehouses ASSET OPTIMIZATION Consolidate 10 plants and associated distribution Consolidate 9 plants and associated distribution Annualized Savings 2020 Fiscal Years Realized 2021 2022 $ in millions TARGET YTD ESTIMATE $8 $24 $12 $15 $7 $9 $75 TARGET TARGET TARGET

Accumulated Savings: SG&A WAVE 1 Sept 2018 – May 2019 WAVE 2 June 2019 – May 2020 WAVE 3 June 2020 – Dec 2020 TOTAL SG&A MAP 2020 Annualized Savings Group RIFs; spend control for largest expense categories OPERATING COMPANY ORGANIZATIONAL EFFICIENCY Finance and HR functional optimization; spend control for next tier of G&A categories Efficiencies driven by ERP consolidations; spend control for next tier of G&A categories CENTER-LED ADMINISTRATIVE EFFICIENCY $ in millions TARGET YTD ESTIMATE TARGET TARGET TARGET

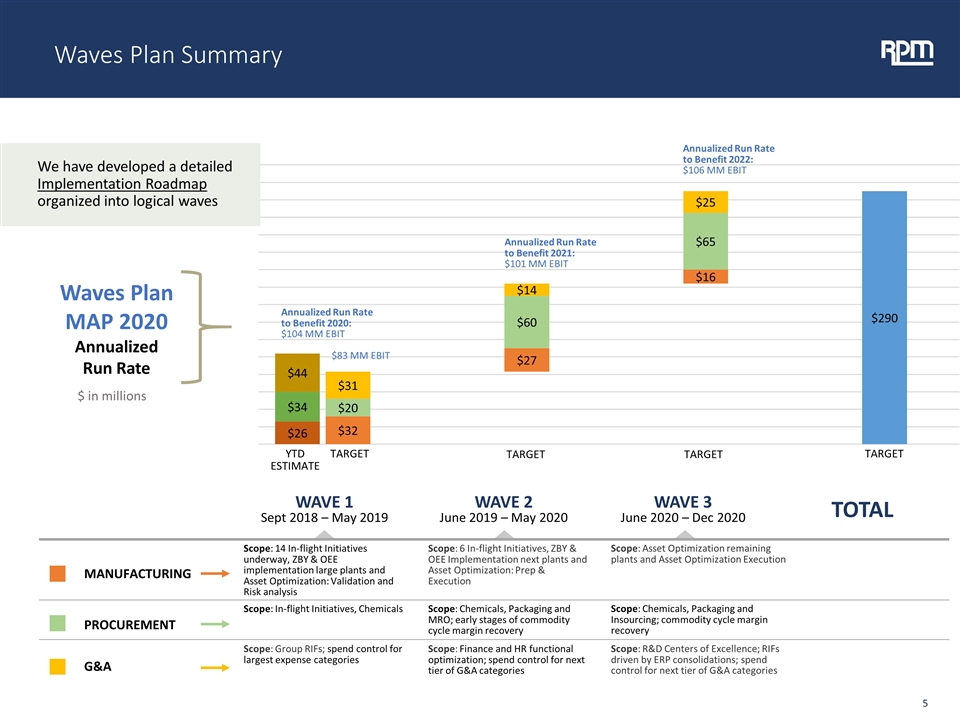
Waves Plan Summary WAVE 1 Sept 2018 – May 2019 WAVE 2 June 2019 – May 2020 WAVE 3 June 2020 – Dec 2020 TOTAL Waves Plan MAP 2020 Annualized Run Rate $ in millions We have developed a detailed Implementation Roadmap organized into logical waves $83 MM EBIT Annualized Run Rate to Benefit 2021: $101 MM EBIT Annualized Run Rate to Benefit 2022: $106 MM EBIT TARGET YTD ESTIMATE TARGET Annualized Run Rate to Benefit 2020: $104 MM EBIT TARGET TARGET Scope: 14 In-flight Initiatives underway, ZBY & OEE implementation large plants and Asset Optimization: Validation and Risk analysis MANUFACTURING Scope: 6 In-flight Initiatives, ZBY & OEE Implementation next plants and Asset Optimization: Prep & Execution Scope: Asset Optimization remaining plants and Asset Optimization Execution Scope: In-flight Initiatives, Chemicals PROCUREMENT Scope: Chemicals, Packaging and MRO; early stages of commodity cycle margin recovery Scope: Chemicals, Packaging and Insourcing; commodity cycle margin recovery Scope: Group RIFs; spend control for largest expense categories G&A Scope: Finance and HR functional optimization; spend control for next tier of G&A categories Scope: R&D Centers of Excellence; RIFs driven by ERP consolidations; spend control for next tier of G&A categories


