Fiscal 2019 Fourth Quarter Supplemental Information July 22, 2019 RPM International Inc. Exhibit 99.2
MAP to Growth Wave 1 Key Achievements: Manufacturing Identified and executed on targeted $25 mm in annualized savings Closed 12 plants Instituted common reporting process Instilling continuous improvement culture MANUFACTURING
MAP to Growth Wave 1 Key Achievements: Procurement Identified and executed on $36 mm in annualized savings $16 mm ahead of target Formed team from core operations Working with vendors on supply chain finance Improved costs by becoming a stronger partner with major suppliers PROCUREMENT
G&A MAP to Growth Wave 1 Key Achievements: G&A Identified and executed on $41 mm in annualized savings $3 mm ahead of target Reduced more than 500 positions Closed 20 warehouses and non-plant locations Implementation of shared service center One-third of ERP consolidations complete
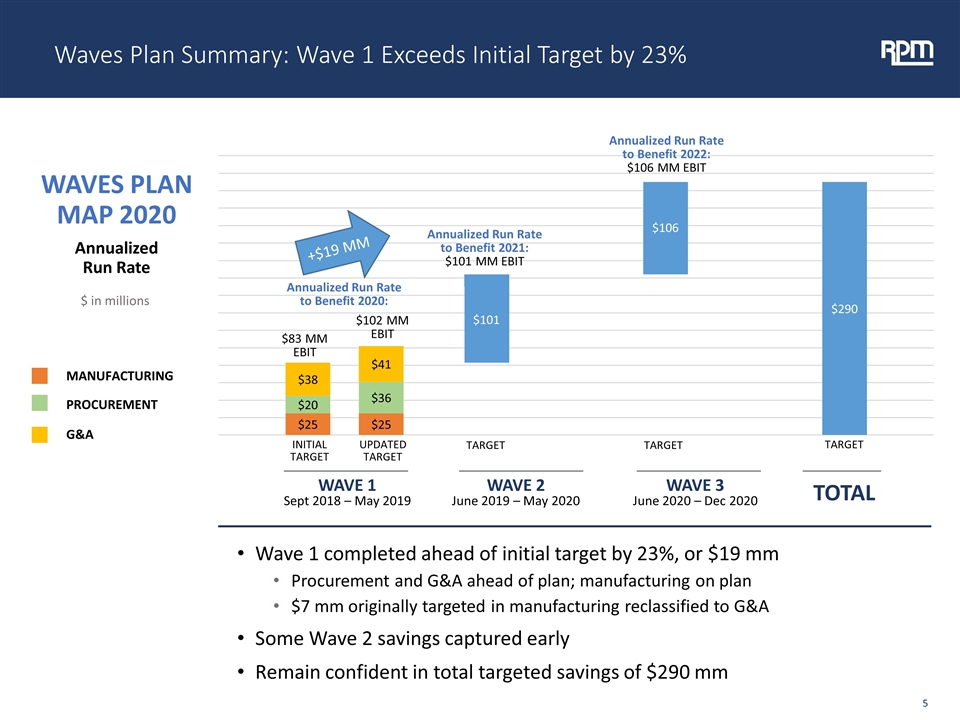
Waves Plan Summary: Wave 1 Exceeds Initial Target by 23% WAVE 1 Sept 2018 – May 2019 WAVE 2 June 2019 – May 2020 WAVE 3 June 2020 – Dec 2020 TOTAL WAVES PLAN MAP 2020 Annualized Run Rate $ in millions $83 MM EBIT Annualized Run Rate to Benefit 2021: $101 MM EBIT Annualized Run Rate to Benefit 2022: $106 MM EBIT INITIAL TARGET UPDATED TARGET TARGET Annualized Run Rate to Benefit 2020: TARGET TARGET $102 MM EBIT MANUFACTURING PROCUREMENT G&A $101 $106 +$19 MM Wave 1 completed ahead of initial target by 23%, or $19 mm Procurement and G&A ahead of plan; manufacturing on plan $7 mm originally targeted in manufacturing reclassified to G&A Some Wave 2 savings captured early Remain confident in total targeted savings of $290 mm
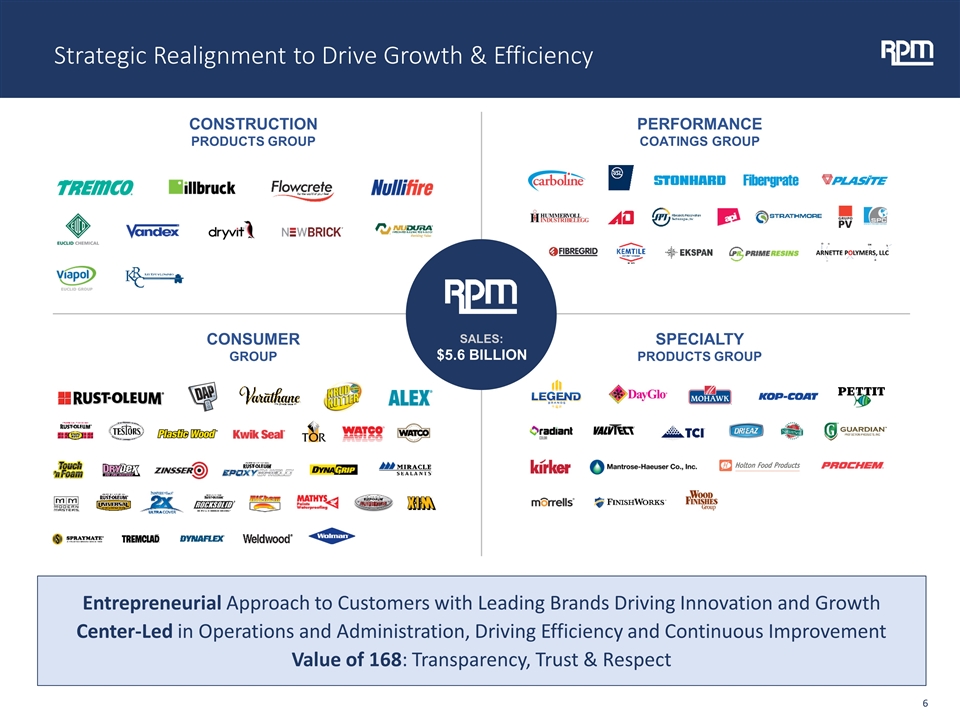
Strategic Realignment to Drive Growth & Efficiency CONSUMER GROUP PERFORMANCE COATINGS GROUP CONSTRUCTION PRODUCTS GROUP SPECIALTY PRODUCTS GROUP SALES: $5.6 BILLION Entrepreneurial Approach to Customers with Leading Brands Driving Innovation and Growth Center-Led in Operations and Administration, Driving Efficiency and Continuous Improvement Value of 168: Transparency, Trust & Respect
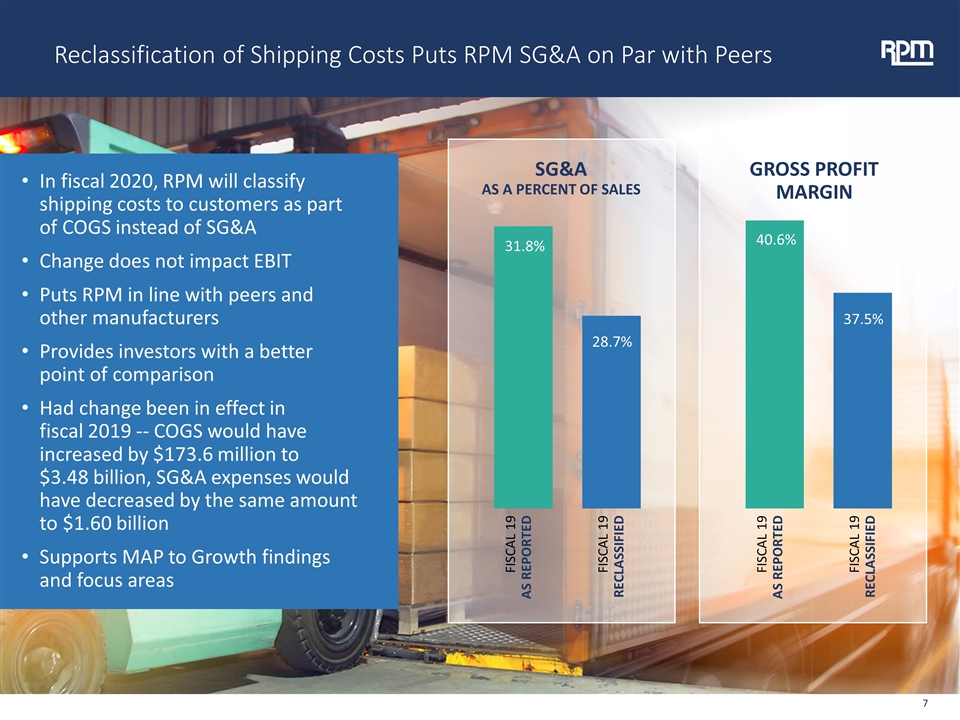
Reclassification of Shipping Costs Puts RPM SG&A on Par with Peers In fiscal 2020, RPM will classify shipping costs to customers as part of COGS instead of SG&A Change does not impact EBIT Puts RPM in line with peers and other manufacturers Provides investors with a better point of comparison Had change been in effect in fiscal 2019 -- COGS would have increased by $173.6 million to $3.48 billion, SG&A expenses would have decreased by the same amount to $1.60 billion Supports MAP to Growth findings and focus areas SG&A AS A PERCENT OF SALES FISCAL 19 AS REPORTED FISCAL 19 RECLASSIFIED 31.8% 28.7% GROSS PROFIT MARGIN FISCAL 19 AS REPORTED FISCAL 19 RECLASSIFIED 40.6% 37.5%


