Exhibit 99.1

Welcome to:
American Community Bancshares, Inc.
FIG Partners Road Show

Forward-looking Statements
This presentation may contain, in addition to historical information, various “forward looking statements” that represent our judgment concerning the future and are subject to risks and uncertainties that could cause American Community’s actual operating results and financial position to differ materially from those projected in the forward looking statements. Such forward looking statements can be identified by the use of forward looking terminology, such as “may,” “will,” “expect,” “anticipate,” “estimate,” or “continue” or the negative thereof or other variations thereof or comparable terminology. We caution that any such forward looking statements are further qualified by important factors that could cause American Community’s actual operating results and financial position to differ materially from the forward looking statements.
Our Market Area
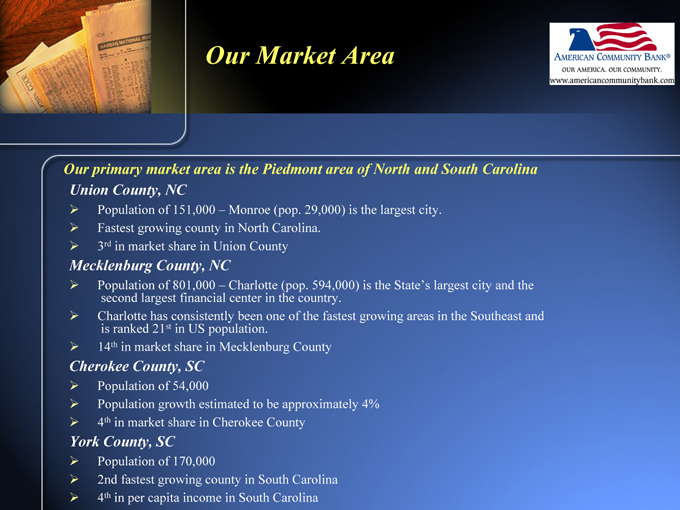
Our primary market area is the Piedmont area of North and South Carolina
Union County, NC
Population of 151,000 – Monroe (pop. 29,000) is the largest city.
Fastest growing county in North Carolina.
3rd in market share in Union County
Mecklenburg County, NC
Population of 801,000 – Charlotte (pop. 594,000) is the State’s largest city and the second largest financial center in the country.
Charlotte has consistently been one of the fastest growing areas in the Southeast and is ranked 21st in US population.
14th in market share in Mecklenburg County
Cherokee County, SC
Population of 54,000
Population growth estimated to be approximately 4%
4th in market share in Cherokee County
York County, SC
Population of 170,000
2nd fastest growing county in South Carolina
4th in per capita income in South Carolina
Management and Board Profile
Management team comprised of seasoned bankers
Average age – 50
Average years in banking – 24
Board of directors with strong area ties and diverse backgrounds
Public accounting
Commercial banking
Investment banking/merger and acquisitions
Real estate
Mortgage banking
Insurance
Financial institution executive recruiting
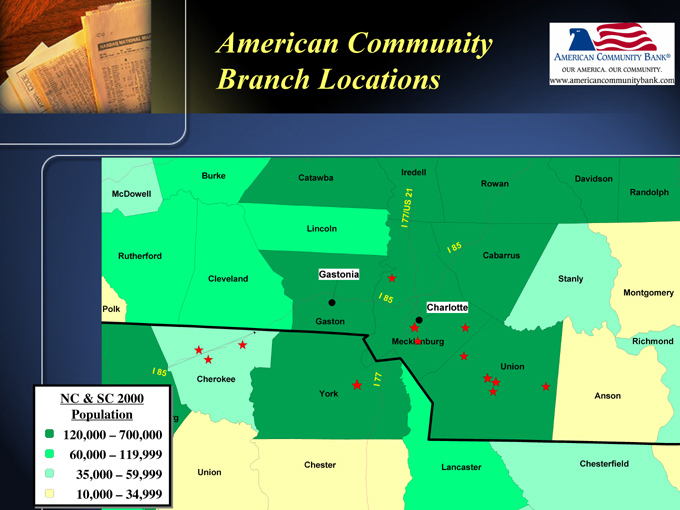
American Community Branch Locations
McDowell
Burke
Catawba
Lincoln
Cleveland
Rutherford
Polk
NC & SC 2000
Population
120,000 – 700,000
60,000 – 119,999
35,000 – 59,999
10,000 – 34,999
I 85
Cherokee
Union
Chester
York
Gaston
Gastonia
Iredell
I 77/US
21
I 85
I 77
Mecklenburg
Charlotte
I 85
Lancaster
Union
Cabarrus
Rowan
Davidson
Stanly
Randolph
Montgomery
Richmond
Anson
Chesterfield
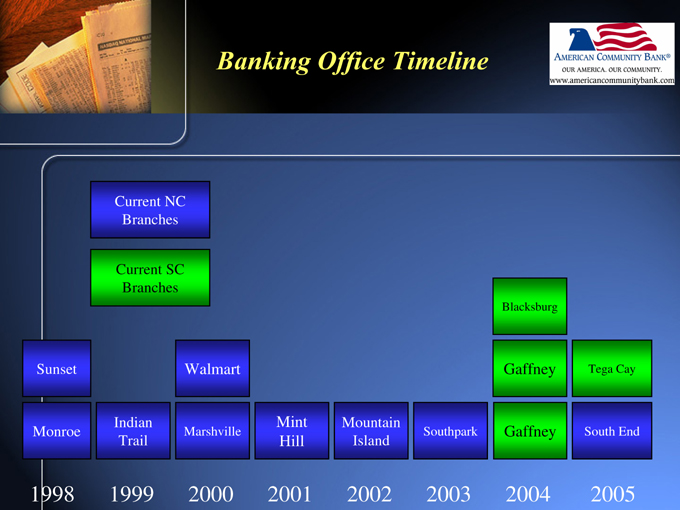
Banking Office Timeline
Current NC Branches
Current SC Branches
Sunset
Monroe
Indian Trail
Walmart
Marshville
Mint Hill
Mountain Island
Southpark
Blacksburg
Gaffney
Gaffney
Tega Cay
South End
1998
1999
2000
2001
2002
2003
2004
2005

Business Plan and Philosophy
Due to bank consolidation and economic growth, we believe a need exists in our marketplace for a locally based financial services provider focused on individuals and small to med.-sized businesses
We believe it takes a combination of a good location and good people to be successful in building and expanding our franchise.
We plan to continue to develop a branch network in growing markets within our geographic region.
Our strategy has been to open new branches only after we have identified a local banker with a loyal following of loan and deposit customers.
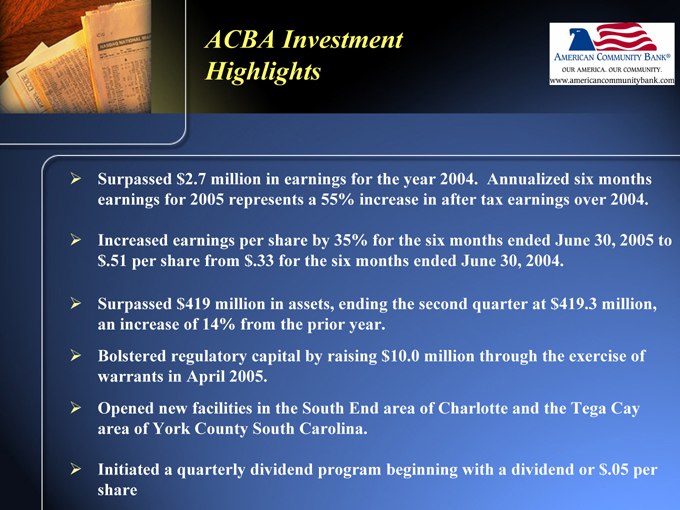
ACBA Investment Highlights
Surpassed $2.7 million in earnings for the year 2004. Annualized six months earnings for 2005 represents a 55% increase in after tax earnings over 2004.
Increased earnings per share by 35% for the six months ended June 30, 2005 to $.51 per share from $.33 for the six months ended June 30, 2004.
Surpassed $419 million in assets, ending the second quarter at $419.3 million, an increase of 14% from the prior year.
Bolstered regulatory capital by raising $10.0 million through the exercise of warrants in April 2005.
Opened new facilities in the South End area of Charlotte and the Tega Cay area of York County South Carolina.
Initiated a quarterly dividend program beginning with a dividend or $.05 per share
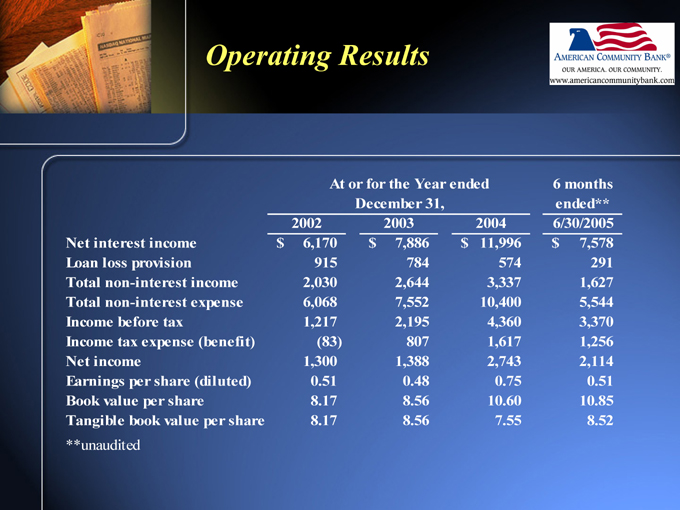
Operating Results
At or for the Year ended 2002 December 31, 2003 2004 6 months ended** 6/30/2005
Net interest income $6,170 $7,886 $11,996 $7,578
Loan loss provision 915 784 574 291
Total non-interest income 2,030 2,644 3,337 1,627
Total non-interest expense 6,068 7,552 10,400 5,544
Income before tax 1,217 2,195 4,360 3,370
Income tax expense (benefit) (83) 807 1,617 1,256
Net income 1,300 1,388 2,743 2,114
Earnings per share (diluted) 0.51 0.48 0.75 0.51
Book value per share 8.17 8.56 10.60 10.85
Tangible book value per share 8.17 8.56 7.55 8.52
**unaudited
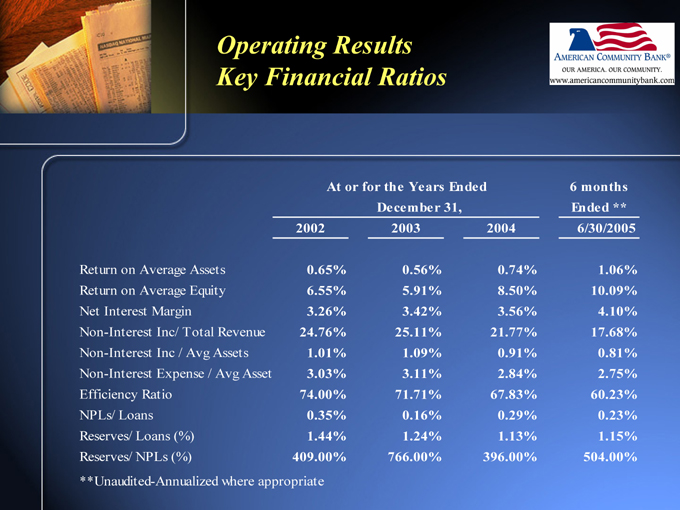
Operating Results Key Financial Ratios
At or for the Years Ended 6 months
December 31, Ended **
2002 2003 2004 6/30/2005
Return on Average Assets 0.65% 0.56% 0.74% 1.06%
Return on Average Equity 6.55% 5.91% 8.50% 10.09%
Net Interest Margin 3.26% 3.42% 3.56% 4.10%
Non-Interest Inc/ Total Revenue 24.76% 25.11% 21.77% 17.68%
Non-Interest Inc / Avg Assets 1.01% 1.09% 0.91% 0.81%
Non-Interest Expense / Avg Asset 3.03% 3.11% 2.84% 2.75%
Efficiency Ratio 74.00% 71.71% 67.83% 60.23%
NPLs/ Loans 0.35% 0.16% 0.29% 0.23%
Reserves/ Loans (%) 1.44% 1.24% 1.13% 1.15%
Reserves/ NPLs (%) 409.00% 766.00% 396.00% 504.00%
**Unaudited-Annualized where appropriate
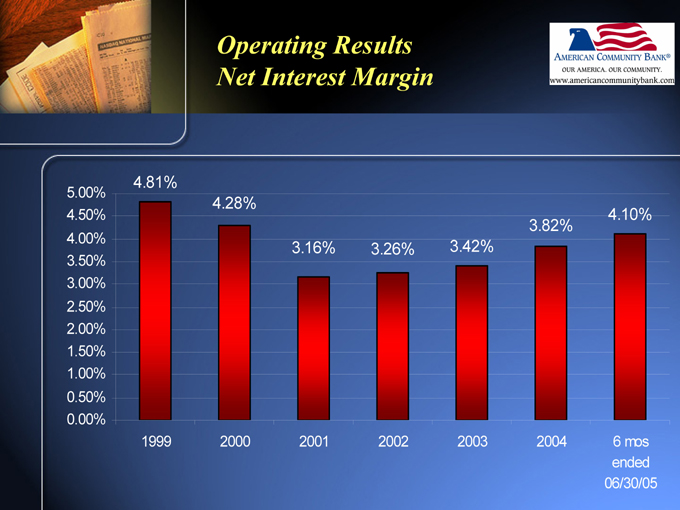
Operating Results Net Interest Margin
5.00%
4.50%
4.00%
3.50%
3.00%
2.50%
2.00%
1.50%
1.00%
0.50%
0.00%
4.81%
4.28%
3.16%
3.26%
3.42%
3.82%
4.10%
1999
2000
2001
2002
2003
2004
6 mos ended 06/30/05
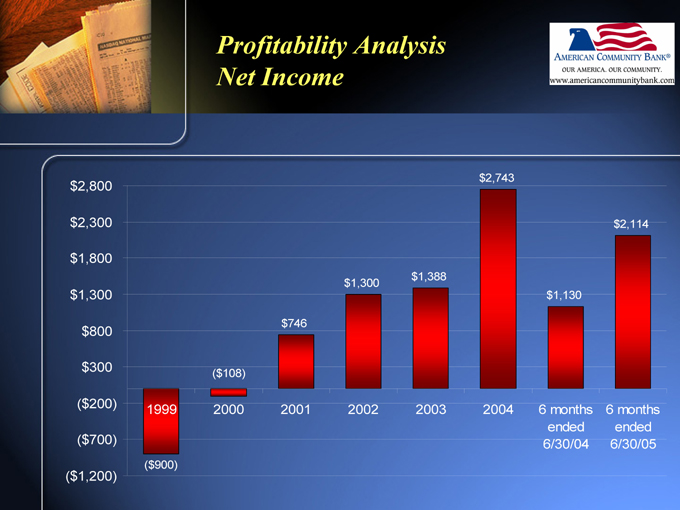
Profitability Analysis Net Income
$2,800
$2,300
$1,800
$1,300
$800
$300
($200)
($700)
($1,200)
1999
($900)
($108)
2000 $746
2001 $1,300
2002 $1,388
2003 $2,743
2004 $1,130
6 months ended 6/30/04 $2,114
6 months ended 6/30/05
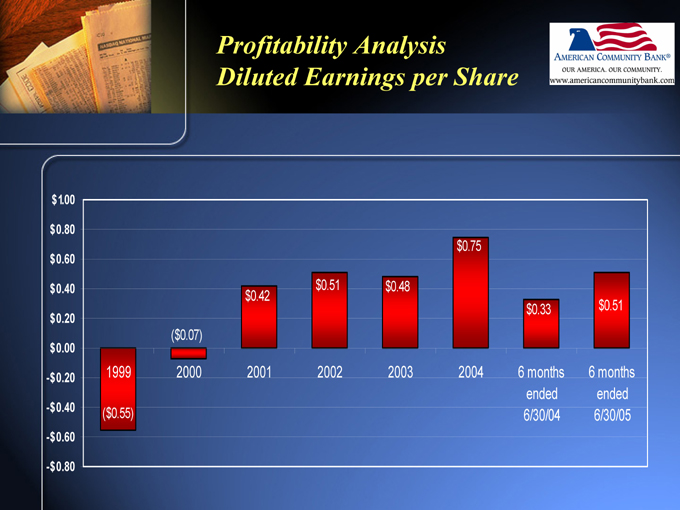
Profitability Analysis Diluted Earnings per Share
$1.00
$0.80
$0.60
$0.40
$0.20
$0.00
-$0.20
-$0.40
-$0.60
-$0.80
1999
($0.55)
($0.07)
2000
$0.42
2001
$0.75
$0.51 $0.48 $0.33 $0.51
2002 2003 2004
6 months 6 months ended ended 6/30/04 6/30/05
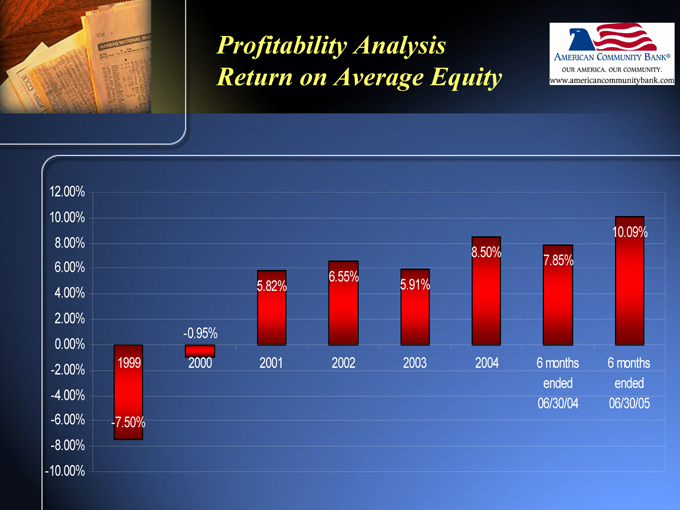
Profitability Analysis Return on Average Equity
12.00% 10.00% 8.00% 6.00% 4.00% 2.00% 0.00% -2.00% -4.00% -6.00% -8.00% -10.00%
1999 2000 2001 2002 2003 2004 6 months 6 months ended ended 06/30/04 06/30/05
-7.50%
10.09% 8.50% 7.85% 6.55% 5.82% 5.91%
-0.95%
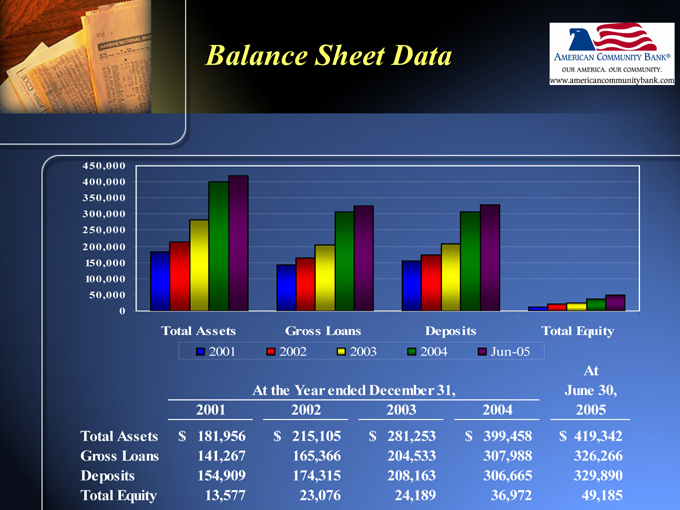
Balance Sheet Data
450,000 400,000 350,000 300,000 250,000 200,000 150,000 100,000 50,000 0
Total Assets Gross Loans Deposits Total Equity
2001 2002 2003 2004 Jun-05
2001 At the Year ended December 31, 2002 2003 June 30, 2004 At 2005
Total Assets $181,956 $215,105 $281,253 $399,458 $419,342
Gross Loans 141,267 165,366 204,533 307,988 326,266
Deposits 154,909 174,315 208,163 306,665 329,890
Total Equity 13,577 23,076 24,189 36,972 49,185
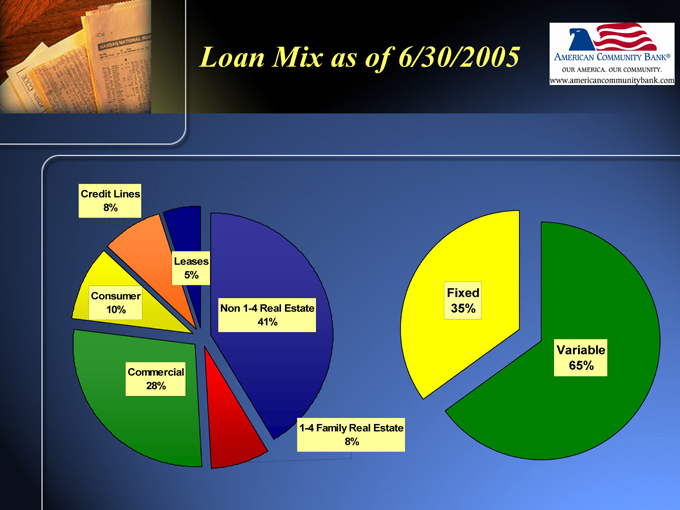
Loan Mix as of 6/30/2005
Credit Lines 8%
Consumer 10%
Leases 5%
Commercial 28%
Non 1-4 Real Estate 41%
1-4 Family Real Estate 8%
Fixed 35%
Variable 65%
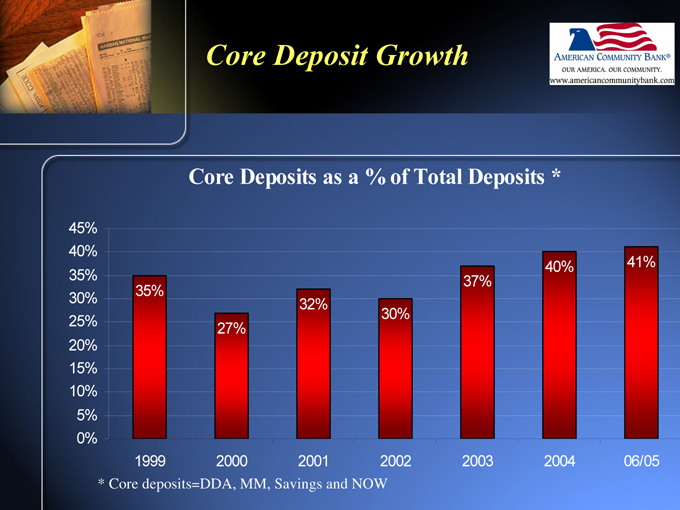
Core Deposit Growth
Core Deposits as a % of Total Deposits *
45% 40% 35% 30% 25% 20% 15% 10% 5% 0%
40% 41% 37% 35% 32% 30% 27%
1999 2000 2001 2002 2003 2004 06/05
* | | Core deposits=DDA, MM, Savings and NOW |
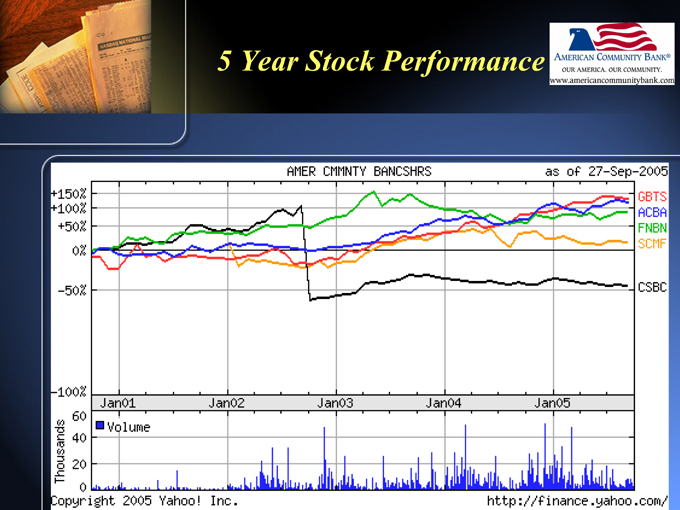
5 Year Stock Performance
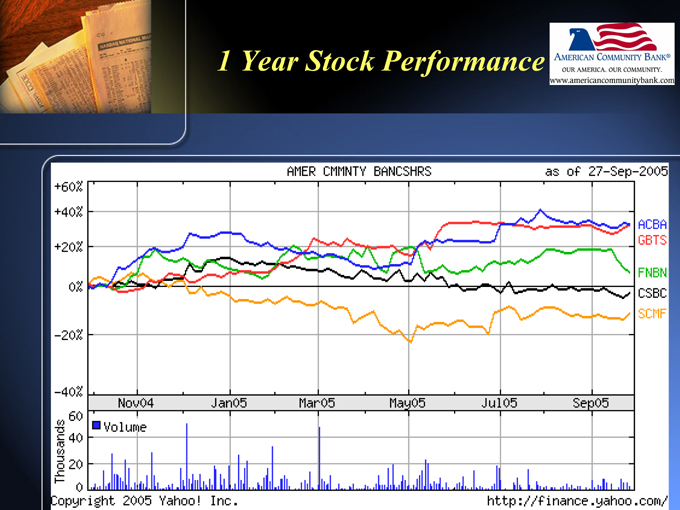
1 Year Stock Performance
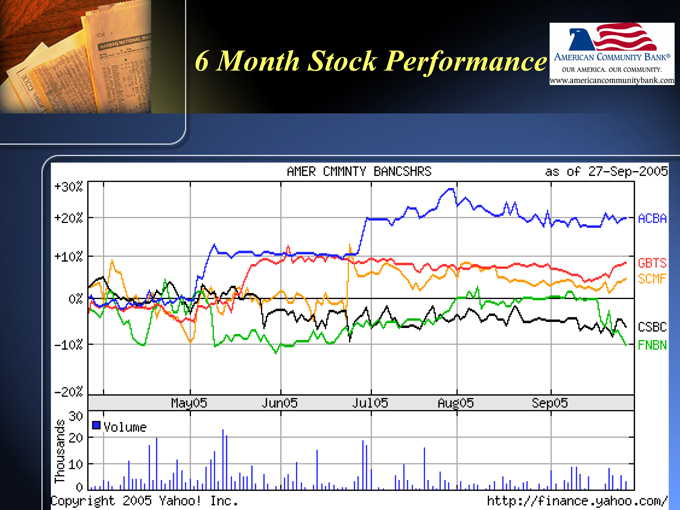
6 Month Stock Performance
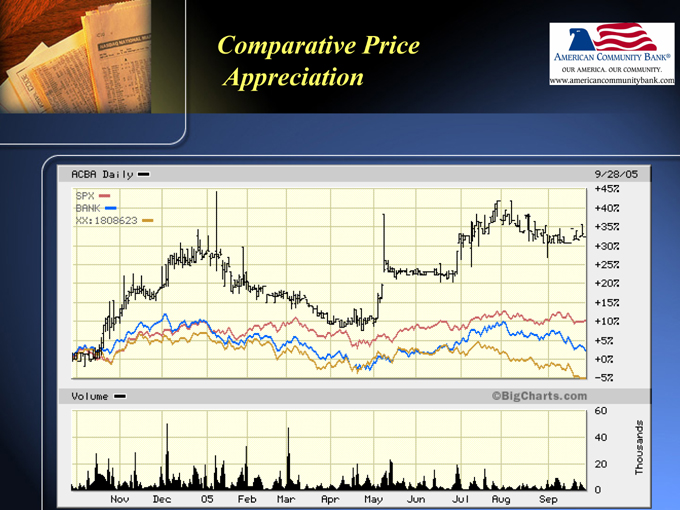
Comparative Price Appreciation
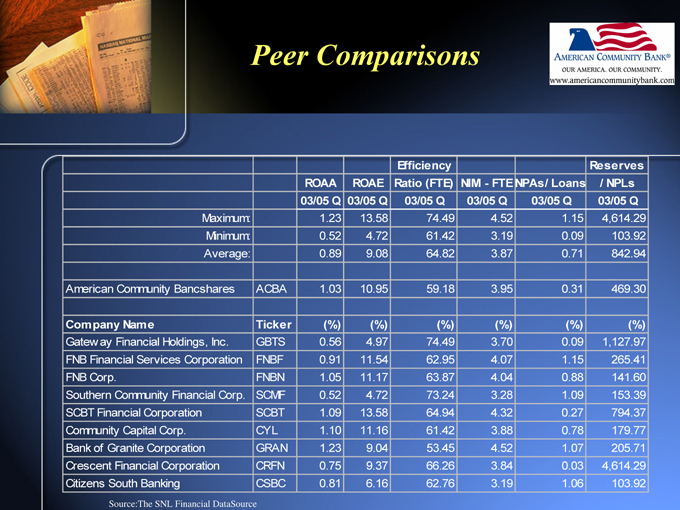
Peer Comparisons
Efficiency Reserves
ROAA ROAE Ratio (FTE) NIM - FTE NPAs/ Loans / NPLs
03/05 Q 03/05 Q 03/05 Q 03/05 Q 03/05 Q 03/05 Q
Maximum: 1.23 13.58 74.49 4.52 1.15 4,614.29
Minimum: 0.52 4.72 61.42 3.19 0.09 103.92
Average: 0.89 9.08 64.82 3.87 0.71 842.94
American Community Bancshares ACBA 1.03 10.95 59.18 3.95 0.31 469.30
Company Name Ticker (%) (%) (%) (%) (%) (%)
Gateway Financial Holdings, Inc. GBTS 0.56 4.97 74.49 3.70 0.09 1,127.97
FNB Financial Services Corporation FNBF 0.91 11.54 62.95 4.07 1.15 265.41
FNB Corp. FNBN 1.05 11.17 63.87 4.04 0.88 141.60
Southern Community Financial Corp. SCMF 0.52 4.72 73.24 3.28 1.09 153.39
SCBT Financial Corporation SCBT 1.09 13.58 64.94 4.32 0.27 794.37
Community Capital Corp. CYL 1.10 11.16 61.42 3.88 0.78 179.77
Bank of Granite Corporation GRAN 1.23 9.04 53.45 4.52 1.07 205.71
Crescent Financial Corporation CRFN 0.75 9.37 66.26 3.84 0.03 4,614.29
Citizens South Banking CSBC 0.81 6.16 62.76 3.19 1.06 103.92
Source: The SNL Financial DataSource
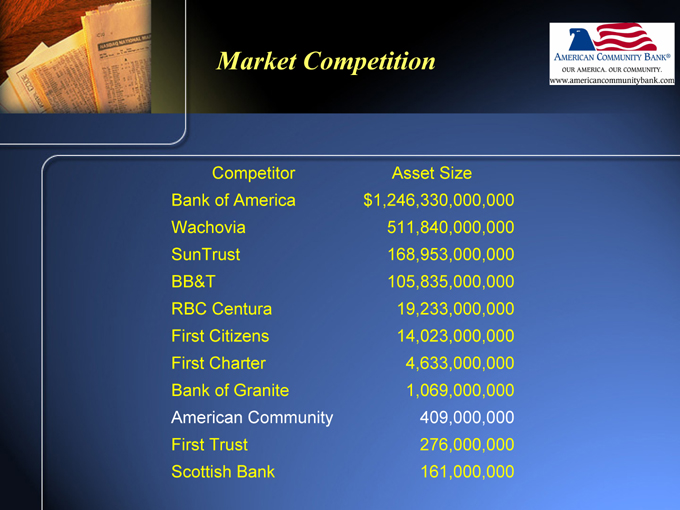
Market Competition
Competitor Asset Size
Bank of America $1,246,330,000,000
Wachovia 511,840,000,000
SunTrust 168,953,000,000
BB&T 105,835,000,000
RBC Centura 19,233,000,000
First Citizens 14,023,000,000
First Charter 4,633,000,000
Bank of Granite 1,069,000,000
American Community 409,000,000
First Trust 276,000,000
Scottish Bank 161,000,000
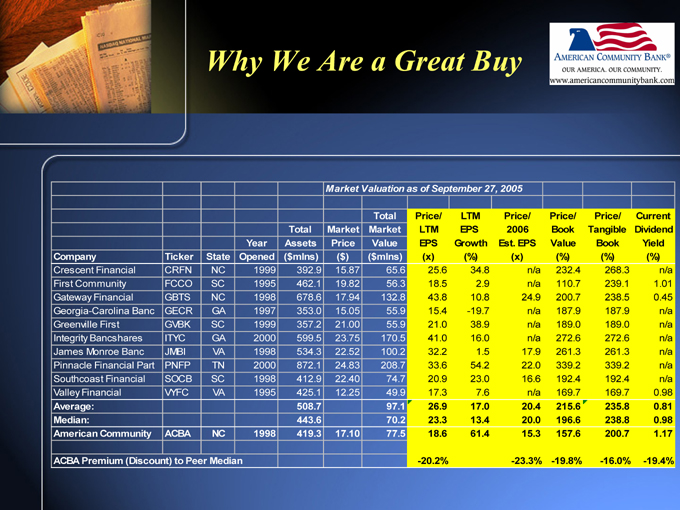
Why We Are a Great Buy
Market Valuation as of September 27, 2005
Company Ticker State Year Opened Total Assets ($mlns) Market Price ($) Total Market Value ($mlns) Price/ LTM EPS (x) LTM EPS Growth (%) Price/ 2006 Est. EPS (x) Price/ Book Value (%) Price/ Tangible Book (%) Current Dividend Yield (%)
Crescent Financial CRFN NC 1999 392.9 15.87 65.6 25.6 34.8 n/a 232.4 268.3 n/a
First Community FCCO SC 1995 462.1 19.82 56.3 18.5 2.9 n/a 110.7 239.1 1.01
Gateway Financial GBTS NC 1998 678.6 17.94 132.8 43.8 10.8 24.9 200.7 238.5 0.45
Georgia-Carolina Banc GECR GA 1997 353.0 15.05 55.9 15.4 -19.7 n/a 187.9 187.9 n/a
Greenville First GVBK SC 1999 357.2 21.00 55.9 21.0 38.9 n/a 189.0 189.0 n/a
Integrity Bancshares ITYC GA 2000 599.5 23.75 170.5 41.0 16.0 n/a 272.6 272.6 n/a
James Monroe Banc JMBI VA 1998 534.3 22.52 100.2 32.2 1.5 17.9 261.3 261.3 n/a
Pinnacle Financial Part PNFP TN 2000 872.1 24.83 208.7 33.6 54.2 22.0 339.2 339.2 n/a
Southcoast Financial SOCB SC 1998 412.9 22.40 74.7 20.9 23.0 16.6 192.4 192.4 n/a
Valley Financial VYFC VA 1995 425.1 12.25 49.9 17.3 7.6 n/a 169.7 169.7 0.98
Average: 508.7 97.1 26.9 17.0 20.4 215.6 235.8 0.81
Median: 443.6 70.2 23.3 13.4 20.0 196.6 238.8 0.98
American Community ACBA NC 1998 419.3 17.10 77.5 18.6 61.4 15.3 157.6 200.7 1.17
ACBA Premium (Discount) to Peer Median -20.2% -23.3% -19.8% -16.0% - -19.4%