
Friedman, Billings, Ramsey & Co.
New England in November
“Un-conference”
Michael P. Daly,
President & Chief Executive Officer
Wayne F. Patenaude, CFA
Senior Vice President & Chief Financial Officer
L. Alexandra Dest – Investor Relations
Vice President & Senior Investment Officer
Boston, Massachusetts
November 8-9, 2005

Cautionary Statement
Statements contained in this presentation contain forward-looking statements within the meaning of the
Private Securities Litigation Reform Act of 1995. These statements are based on the beliefs and
expectations of management as well as the assumptions made using information currently available to
management. Since these statements reflect the views of management concerning future events, these
statements involve risks, uncertainties and assumptions. These risks and uncertainties include among
others, changes in market interest rates and general and regional economic conditions, changes in
government regulations, changes in accounting principles and the quality or composition of the loan and
investment portfolios and other factors that may be described in Berkshire Hills Bancorp, Inc.’s quarterly
reports on Form 10-Q for the quarters ended March 31, June 30 and September 30 and in its annual
report on Form 10-K, each filed with the Securities and Exchange Commission, which are available at
the Securities and Exchange Commission’s internet website (www.sec.gov) and to which reference is
hereby made. Therefore, actual future results may differ significantly from results discussed in the
forward-looking statements.
You are cautioned not to place undue reliance on any forward-looking statements, which speak
only as of November 8 and November 9, 2005. Except as required by applicable law
or regulation, Berkshire Hills Bancorp, Inc. undertakes no obligation to update
any forward-looking statements, to reflect events or circumstances that occur
after November 8 and November 9, 2005.

Profile
Strategic Actions
Financial Report
Interest Rate Risk
Asset Quality
Creating Value
Berkshire Hills Bancorp

State chartered savings bank with commercial
bank balance sheet
Market capitalization - approximately $291
million at September 30, 2005
Ownership structure as of September 30, 2005
Insiders (not including options) 26%
Berkshire Bank Foundation 7%
Institutional holders 39%
Profile

Profile
At September 30, 2005
Assets
$2 billion
Loans
$1.4 billion
Deposits
$1.35 billion
Operations
24 full-service branches;
10 free standing ATMs
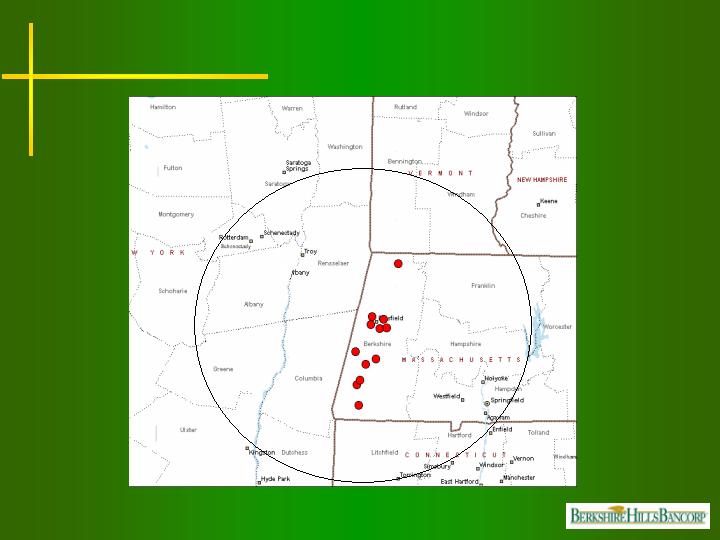
Original BHL Franchise
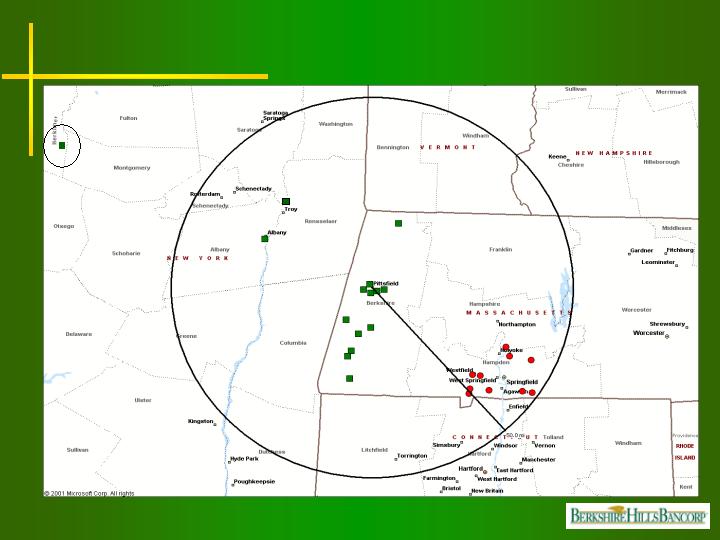
Current Franchise
Clifton Park

Strategic Actions
Proven ability to execute
October 2002
Management changes
December 2002
Sold $69.7 mm in sub-prime auto loans
March 2003
Performance benchmarks announced
December 2003
Sold $9.9 mm in sub-prime auto loans
January 2004
Six Sigma initiative implemented
June 2004
Sold 60% ownership of EastPoint
Technologies, LLC
July 2004
Opened representative (LPO) office in
Albany, NY

Strategic Actions
Proven ability to execute
October 2004
Purchased branch in Oriskany Falls, NY –
Allowing de novo branching in NY
December 2004
Purchased Berkshire Financial Planning
June 2005
Opened Albany and Clifton Park, NY branches
June 2005
Acquired Woronoco Bancorp creating a $2 billion
institution
October 2005
Acquired 2 insurance agencies; anticipate $500k
annual fee income
November 2005
Received approval for NY municipal bank
November 2005
Switched to NASDAQ national market; symbol
“BHLB”

No silos – keep it simple
Strong board of directors
Culture of enthusiasm, teamwork,
energy and cross-selling
Ability to attract and maintain the best
Six Sigma culture
Differentiating Factors

Efficiency Ratio and Non-Interest Expense
to Average Assets
(1)Exclusive of merger & conversion expenses and other non-recurring items
(2)In addition to note 1, also excludes amortization of intangible assets
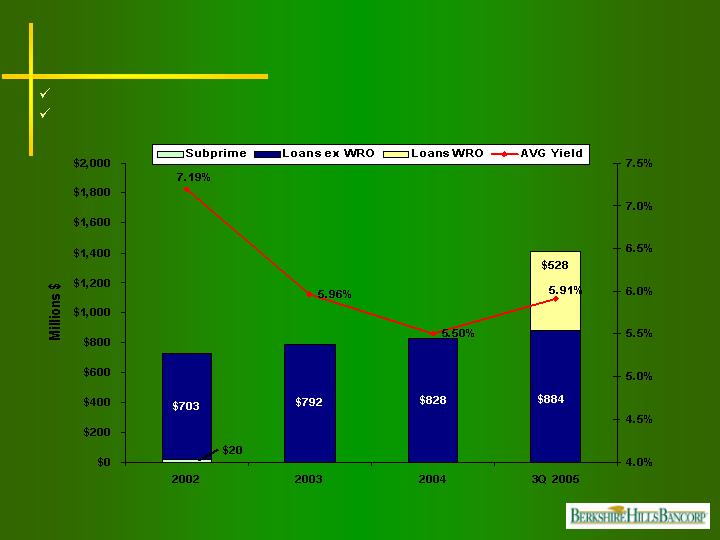
Quality Loan Growth
Compound growth rate since 2002 ex Woronoco and sub-prime = 9%
Compound growth rate since 2002 = 28%
$1,412
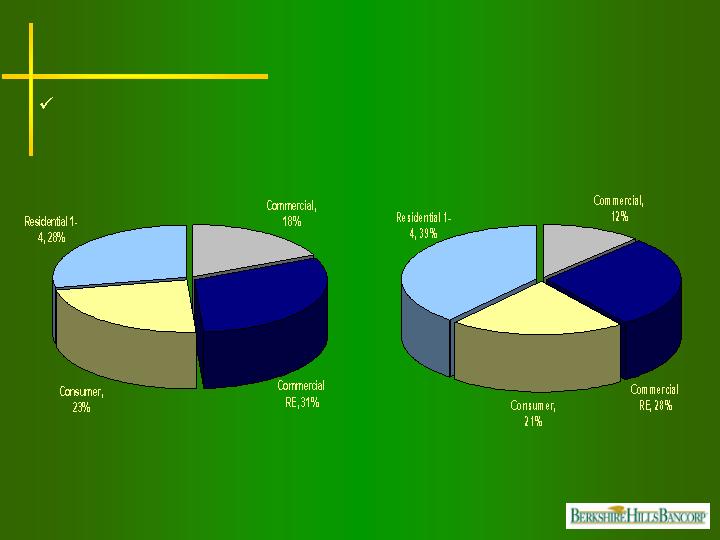
Loan Portfolio Composition
Commercial bank focus
At September 30, 2005
At December 31, 2004
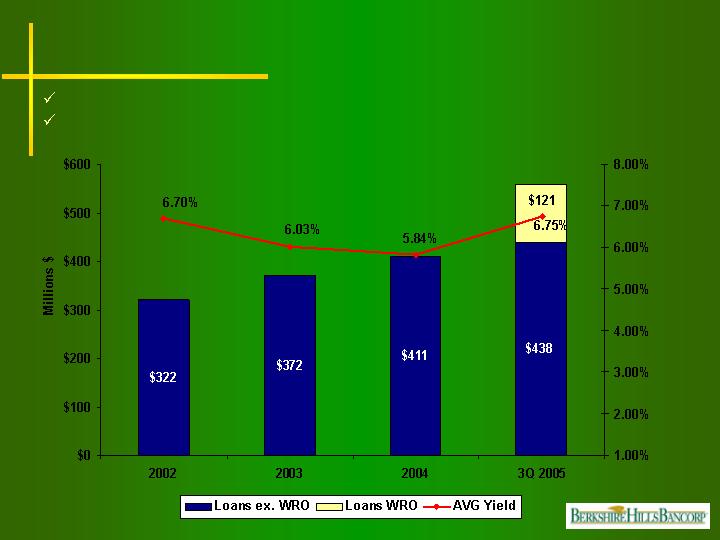
Commercial Loans
Compound growth rate since 2002 exclusive of Woronoco = 11%
Compound growth rate since 2002 = 22%
$559
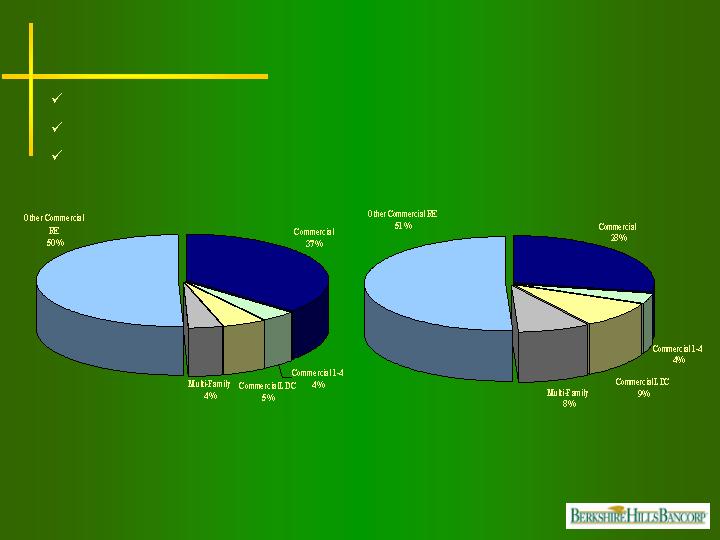
Commercial Loans
At September 30, 2005
67% of portfolio re-prices within 1 year
Only 14% re-prices beyond 3 years
24% floating with prime or other short-term indexes
At December 31, 2004

Credit Profile - Commercial Loans
Lending criteria with few exceptions:
Personal guarantees required
Maximum loan to value 80%
Minimum debt service coverage 1.25X
Delinquency ratio
Net-charge-offs (recoveries)
0.43%
0.84%
0.96%
9/30/05
12/04
12/03
0.02%
0.05%
0.08%
9/30/05
12/04
12/03
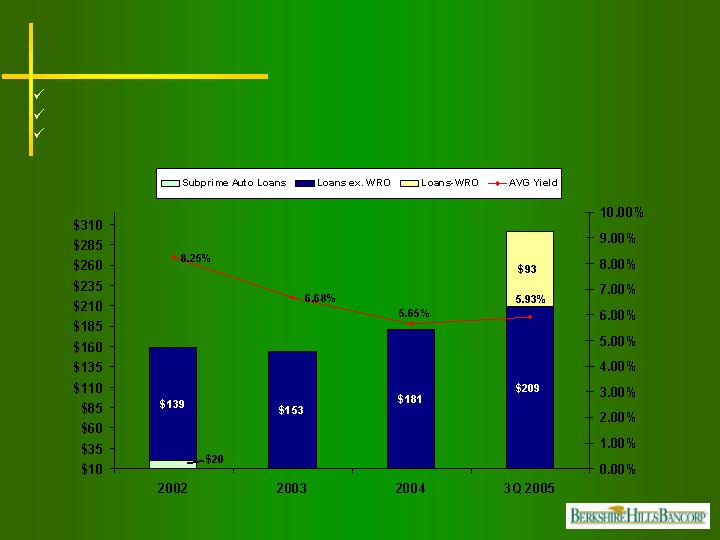
Consumer Loans
Compound growth rate since 2002 exclusive of Woronoco and sub-prime auto loans = 16%
Compound growth rate since 2002 = 26%
Portfolio’s average FICO at 715 at 9/30/05
$159
$302
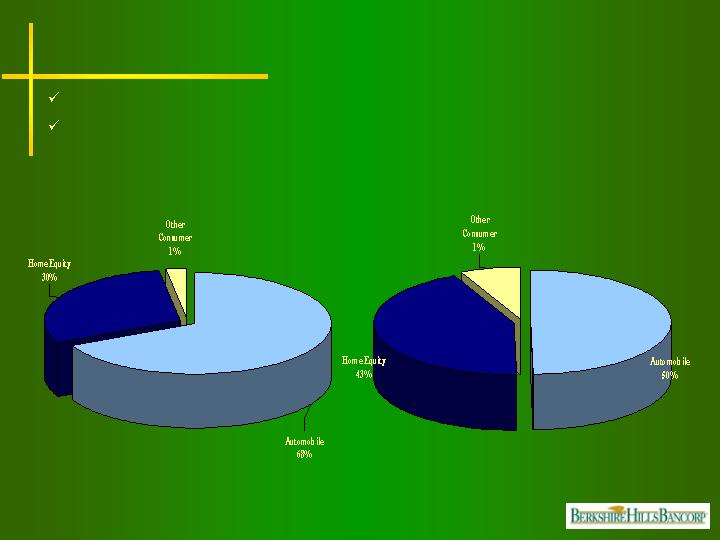
Consumer Loans
At September 30, 2005
Duration of auto loans = 2.25 years
Nearly all home equity loans float with prime
At December 31, 2004

Credit Profile - Residential/Consumer Loans
Prime auto loans – At September 30, 2005
0.42%
Net charge-offs (annualized)
0.47%
Delinquency
none
Sub-prime loans
732
FICO Score – Originations 2005
715
FICO Score – Portfolio Avg.

Credit Profile-Home Equity Lines of Credit
None
Losses (2002 – 2005)
0.25%
Delinquency
None
LTV > 80%
55%
Average LTV
756
FICO Score – Originations (2 yrs)
Home Equity Line of Credit – At September 30, 2005

Residential Mortgage Portfolio Mix
Prior to acquisition, sold $90mm in fixed rate WRO loans

Credit Profile – Residential Loans
Residential 1-4 family mortgages – At September 30, 2005
None
Losses (2002 – 2005)
0.12%
Delinquency
None
Uninsured loans w/LTV > 80%
None
Interest only product
61%
Average LTV
728
FICO Score – Originations (2 yrs)

Asset Quality
0.11%
0.06%
0.01%
Net loan charge-offs/average loans
691
705
715
Average FICO Score
0.67%
0.37%
0.24%
Loan delinquency/total loans
250%
811%
841%
Allowance/NPL’s
1.13%
1.13%
0.93%
Allowance/total loans
0.40%
0.14%
0.11%
NPA/total loans and REO
4Q03
4Q04
3Q05
Percent except NPA and NPL totals
Solid credit quality trends
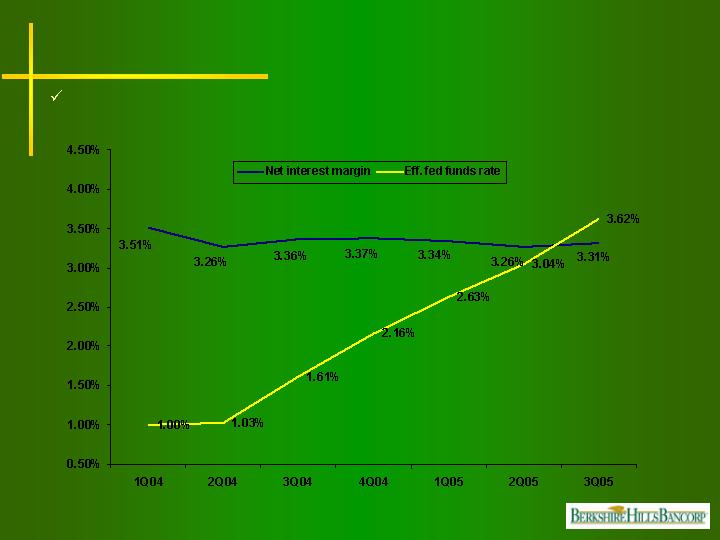
Interest Rate Risk Management
Stable margins against rising rates and flattening yield curve
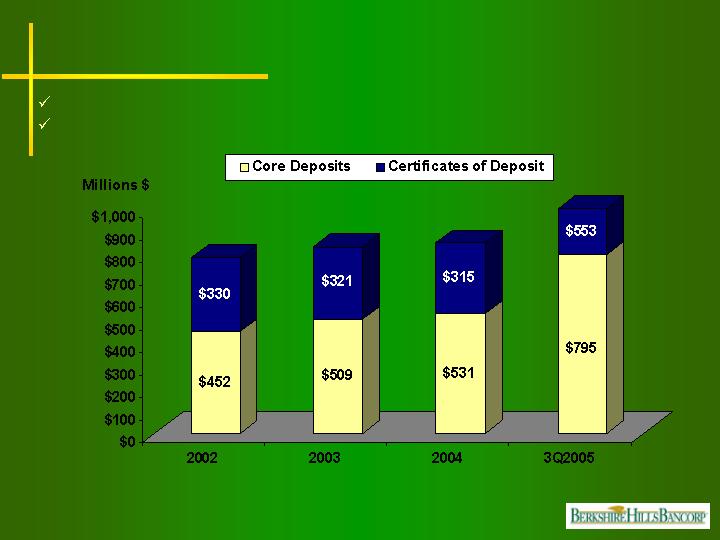
Total Deposits
Core deposit compound growth rate = 23%
Core deposit compound growth rate excluding Woronoco = 6%
Core deposits consist of demand, NOW, savings and money market accounts
$782
$830
$845
$1,348
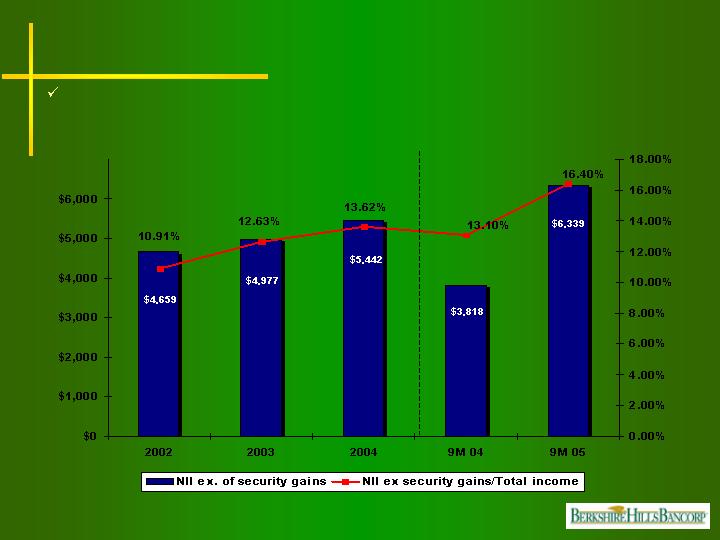
Non-Interest Income (NII) Ex. Security Gains
Main drivers of non-interest income: wealth management, insurance, loan service
and customer service fees

Wealth Management
11.1% asset growth
$398 mm under management
92% new money to Berkshire Bank
98% retention ratio
11.2% revenue growth
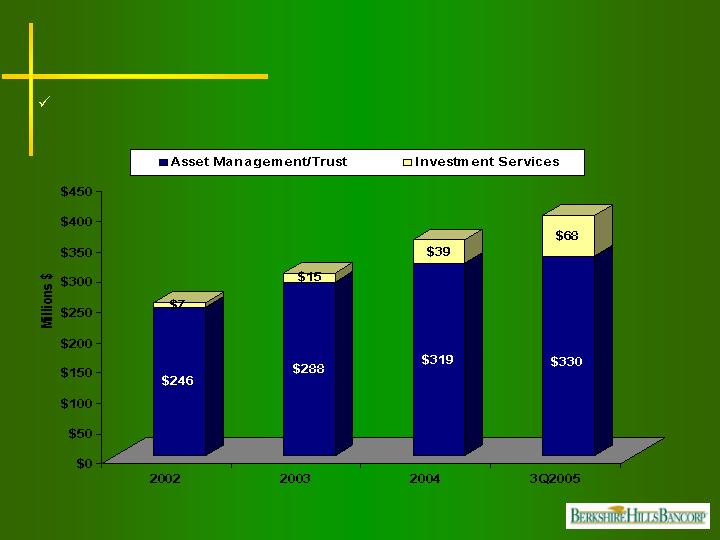
Wealth Management Asset Growth
Assets under management compounded growth rate = 18%
$253.3
$302.3
$357.9
$397.8
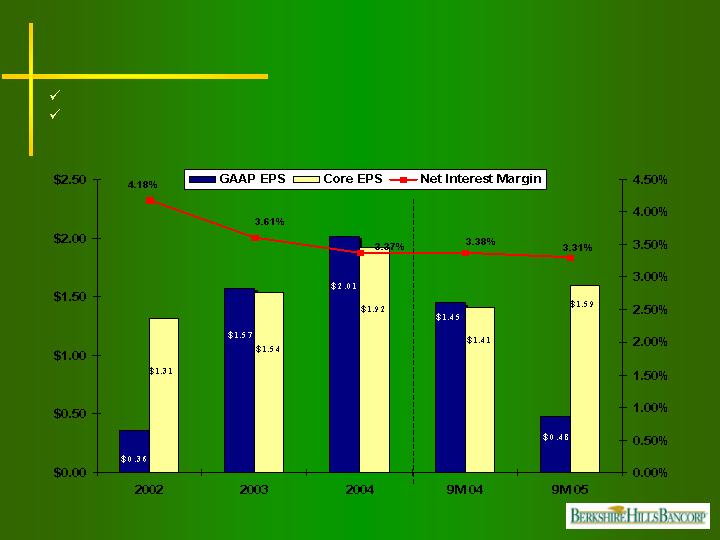
EPS/Net Interest Margin
Lower margins more than offset by strong credit quality and expense control
Well positioned for rising rate environment

Performance Benchmarks
0.80%
0.89%
0.92%
ROA
62.73%
60.66%
55.32%
Efficiency Ratio
7.94%
9.68%
13.45%
ROE-Tangible
2003
2004
3Q05
Annualized
Actual Results
Benchmarks announced in March 2003
Within 3 years:
Double digit ROE
1.0% ROA
Efficiency ratio below 60%

Creating Value
Successful WRO integration
Achieved 36% cost saves vs. 30% target
On target to provide accretion to earnings
Integrated 2 cultures seamlessly
Improved non-interest income
Double digit organic growth in all business lines
Diligent expense management
Strong asset quality
Effective capital management through de-novo branching, accretive
acquisitions and share repurchases
Proven execution

Creating Value
Attractive commercial & community bank franchise
Motivate & retain the best quality people
Drive organic loan & deposit growth; relationship building
Continue to expand fee based income
Consumer & commercial fee based business
Wealth management
Private banking
Insurance
Cross-selling initiatives
Develop Six Sigma culture
Expansion through de novo branching and acquisition
Management focused on delivering results & creating shareholder value

Creating Value
Join us December 1st in
New York City
for more details…
On the move

Appendix: Reconciliation of GAAP and Core Income
-
243
Add: Disallowance of the dividend
received deduction on the Bank’s REIT
9,211
1,107
Add: Net losses and expenses on sale of
sub-prime auto loans, net of tax
5,258
307
Add: Net other non-recurring, net of tax
$0.36
$1.57
$2.01
$1.45
$0.48
$0.54
Diluted earnings per share-GAAP
5,867
5,703
5,731
5,735
7,061
8,856
Average diluted share outstanding
9,550
2,022
953
689
1,722
541
Less: Gain on the sale of securities, net
of tax
$1.31
$1.54
$1.92
$1.41
$1.59
$0.54
Diluted earnings per share-Core
686
185
431
431
-
Add: Loss from discontinued operations
-Sale of EastPoint Technologies, net of
tax
-
-
-
-
8,379
-
Add: ESOP termination expense, net of
tax benefit of $288,000
$7,702
$8,785
$10,987
$8,075
$11,210
$4,743
Net core earnings
-
$2,097
2002
-
$8,965
2003
-
-
1,164
538
Add: Merger and conversion-related
expenses, net of tax
$11,509
$8,333
$3,389
$4,746
Net Income
2004
Nine
months
ended 2004
Nine
months
Ended 2005
3rd
Quarter
2005
Net Income and Earnings per share
($’s in millions)

Investor Presentation
November 8 & 9, 2005
If you have any questions, please contact:
Wayne F. Patenaude, CFA
Senior Vice President and CFO
(413) 236-3195
wpatenaude@berkshirebank.com
OR
L. Alexandra Dest, Investor Relations
Vice President and Senior Investment Officer
(413) 236-3163
adest@berkshirebank.com
Company website: www.berkshirebank.com
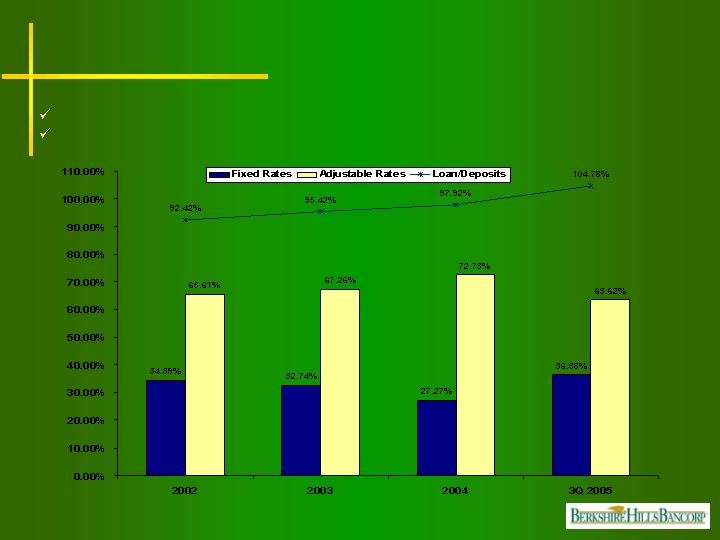
Loan Portfolio Characteristics
At September 30, 2005
Positioned for rising rates
Less reliant on earnings from the securities portfolio