
Banking as a Business
Lawrence A. Bossidy
Chairman
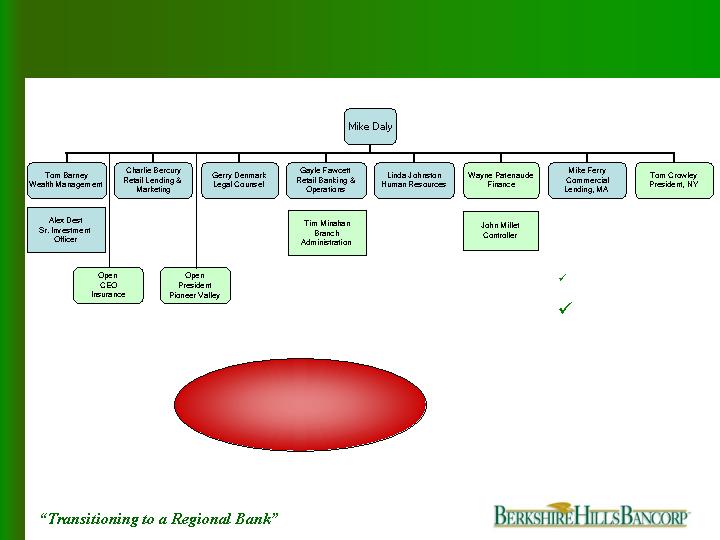
Michael P. Daly
President & Chief Executive Officer
New York City
December 1, 2005
1

Cautionary Statement
Statements contained in this presentation contain forward-looking statements within the meaning of the
Private Securities Litigation Reform Act of 1995. These statements are based on the beliefs and
expectations of management as well as the assumptions made using information currently available to
management. Since these statements reflect the views of management concerning future events, these
statements involve risks, uncertainties and assumptions. These risks and uncertainties include among
others, changes in market interest rates and general and regional economic conditions, changes in
government regulations, changes in accounting principles and the quality or composition of the loan and
investment portfolios and other factors that may be described in Berkshire Hills Bancorp, Inc.’s quarterly
reports on Form 10-Q for the quarters ended March 31, June 30 and September 30 and in its annual
report on Form 10-K, each filed with the Securities and Exchange Commission, which are available at
the Securities and Exchange Commission’s internet website (www.sec.gov) and to which reference is
hereby made. Therefore, actual future results may differ significantly from results discussed in the
forward-looking statements.
You are cautioned not to place undue reliance on any forward-looking statements, which speak
only as of December 1, 2005. Except as required by applicable law
or regulation, Berkshire Hills Bancorp, Inc. undertakes no obligation to update
any forward-looking statements, to reflect events or circumstances that occur
after December 1, 2005.
2

Agenda
Overview
Part I: 1997-2002
Where We Started
Part II: 2002 - 2005
Where We Are Today
How We Got Here
Part III: 2005-2008
Where We Are Going
How We Will Get There
Wrap Up
3

Mission Statement
Berkshire Bank is committed to being the financial institution of
choice for individuals, businesses, and municipalities in the
markets we serve.
We will achieve this position of competitive leadership by
consistently meeting and exceeding the expectations of our
customers in the delivery of
Trusted Solutions.
We value and respect our customers and employees and will
strive to maintain an environment within which employees will
want to work and customers will want to bank.
Overview
4

Berkshire Bank is a bank
managed as a business, with
the ongoing support and
wisdom of Mr. Bossidy
Lawrence Bossidy
Former Vice-chair of General Electric Company
Former Chairman and CEO of AlliedSignal Inc.
Retired Chairman and CEO of Honeywell International
Named CEO of the Year – 1994 – by Financial World
Member of the Boards of Directors of JPMorgan Chase,
Merck & Company and Berkshire Hills Bancorp Inc.
Co-author - Execution: The Discipline of Getting Things
Done and Confronting Reality: Doing What Matters to Get
Things Right
Bio
5

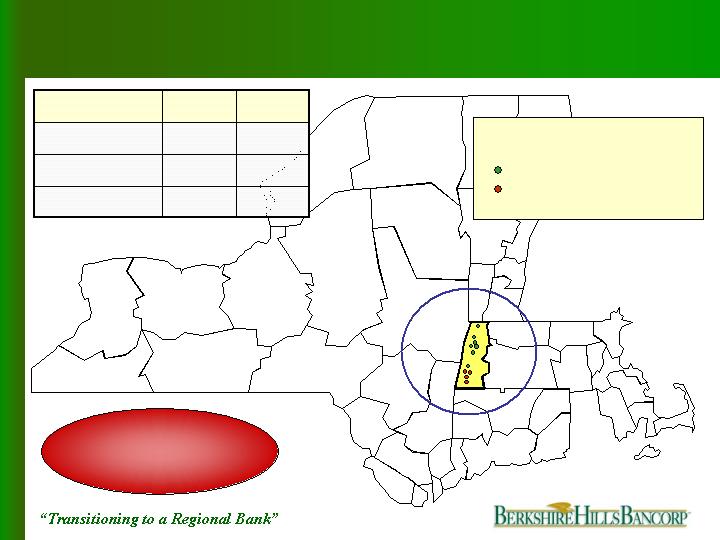
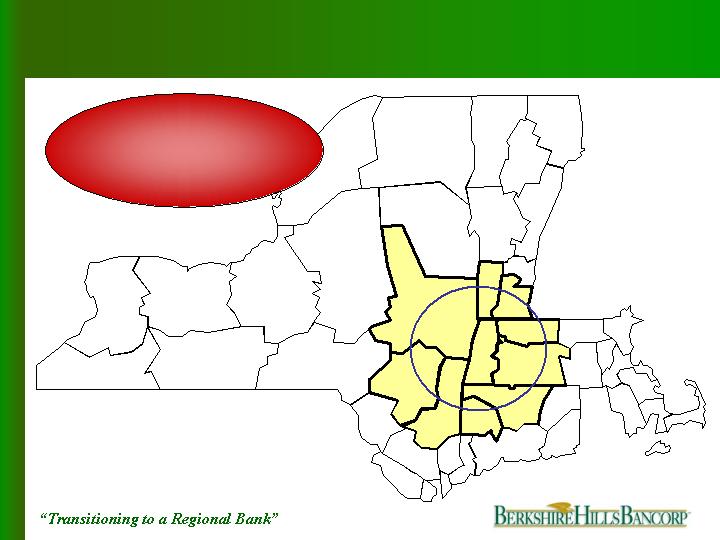
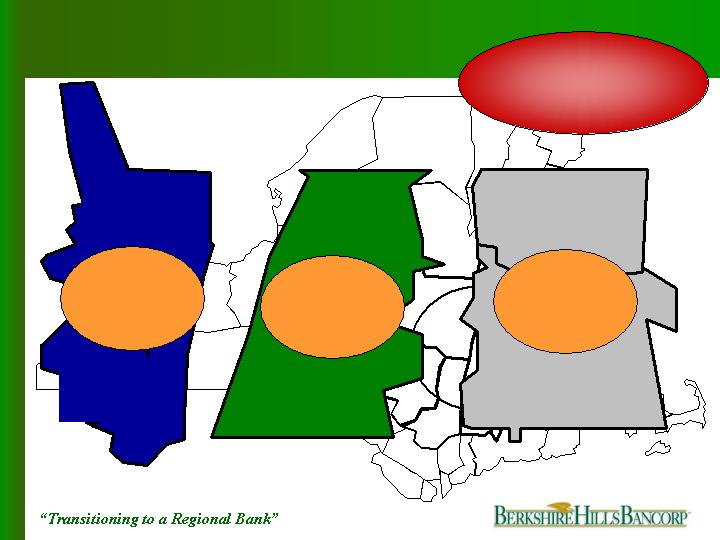
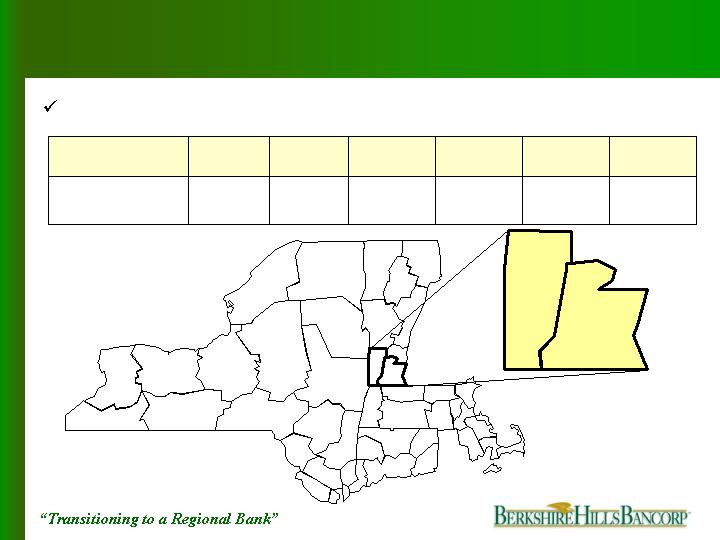
Overview - Today
Berkshire County
Pioneer Valley
Capital Region
6
State chartered savings bank with commercial bank balance sheet
Ownership Structure – September 30, 2005
Institutional holders
39%
Insiders*
12%
Individuals
42%
Foundation
7%
Corporate Profile – September 30, 2005
Market capitalization
$291 million
Assets
$2.0 billion
Loans
$1.4 billion
Deposits
$1.35 billion
Employees
374 FTEs
Operations
24 full-service branches
10 free standing ATMs
*Not including options

Where We Started
Part I: 1997 - 2002
7
Confined to
Berkshire County
1997 Merger
Berkshire County Savings Bank
Great Barrington Savings Bank
Where We Started 1997-2002
11
11
Branches
$723
$498
Loans ($M)
$782
$539
Deposits ($M)
2002
1997
8

Merger
Cultural integration
Initial IPO
Capital deployment
Data processing company
Sub-prime lending
Constant throughout
Commercial lending discipline
Where We Started 1997 - 2002
Lacked
management
strength & depth
9

“Management Changes and Gaining Credibility”
Where We Are Today
and
How We Got Here
Part II: 2002 - 2005
10

How We Got Here 2002 - 2005
20 years commercial banking experience
Bank of Boston
MBA from Columbia University
Co-chair with Massachusetts Lt. Governor;
Regional Competitiveness Council
Member Massachusetts Business
Roundtable
Mike Daly – President and CEO
11

Culture
People
Growth
Asset quality
Asset liability management
Operational efficiencies
Strategic capital allocation
How we got here
Mike’s Agenda
Turnaround keys
12

How we got here
Culture
Realign team, stay focused,
breakdown barriers
Strengthen board
Instill culture of enthusiasm,
teamwork, energy and cross-selling
Drive customer satisfaction
Team transformation
Culture
People
Growth
Asset Quality
Asset Liability
Efficiencies
Capital Allocation
13

Attract and retain very good people
Committed
Ambitious
Accountability
Pay for performance
Six Sigma training
Corporate governance
How we got here
People
Team committed to
accelerated growth
Culture
People
Growth
Asset Quality
Asset Liability
Efficiencies
Capital Allocation
14
How we got here
People
Culture
People
Growth
Asset Quality
Asset Liability
Efficiencies
Capital Allocation
Diversified and
experienced
management
15
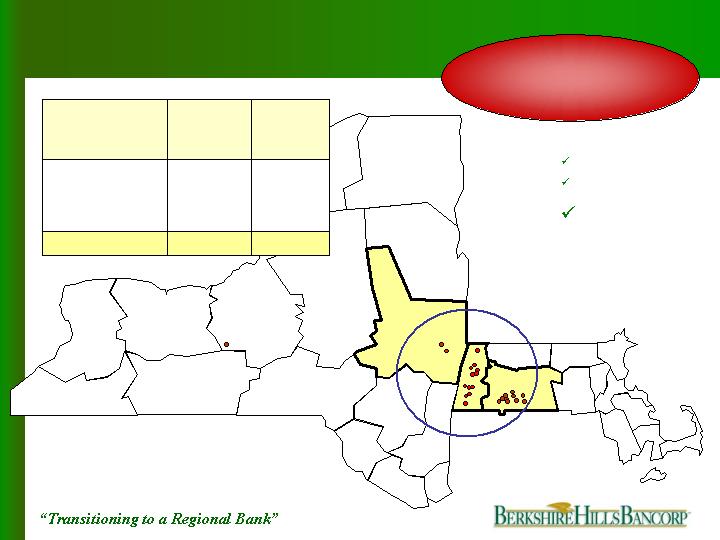
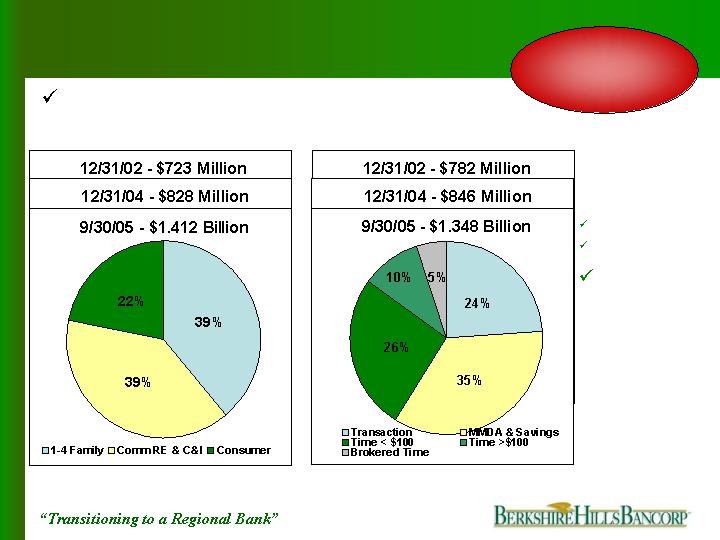
3
$29
New York State
24
$1,348
Total
Branches
9/30/05
Deposits
($millions)
Market
$464
$855
10
11
Pioneer Valley
Berkshire County
How we got here
Growth by Region
Expansion has
exceeded our
expectations
Culture
People
Growth
Asset Quality
Asset Liability
Efficiencies
Capital Allocation
16
How we got here
Growth
Significant annual
growth in every
division
Culture
People
Growth
Asset Quality
Asset Liability
Efficiencies
Capital Allocation
17
Balance sheet composition
How we got here
Growth by Product Line
Less
“thrift-like”
Culture
People
Growth
Asset Quality
Asset Liability
Efficiencies
Capital Allocation
Loans
Deposits
18
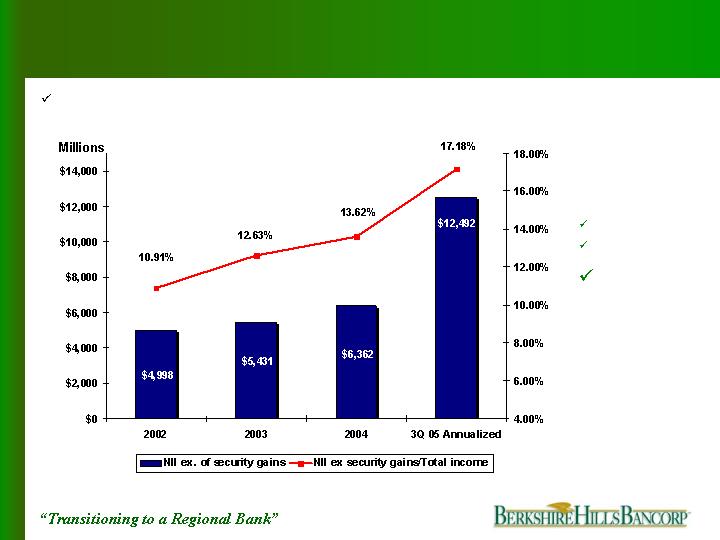
Main drivers of non-interest income: wealth management, insurance, loan service
and customer service fees
How we got here
Non-Interest Income
Culture
People
Growth
Asset Quality
Asset Liability
Efficiencies
Capital Allocation
19

*Annualized
0.15
810.5
1.13
0.14
$1,152
2004
0.35
280.4
1.13
0.40
$3,199
2003
0.87
275.5
1.43
0.72
$5,241
2002
0.04
841.2
0.93
0.11
$1,560
3Q05*
NCOs/avg. loans (%)
Allowance/NPLs (%)
Allowance/loans (%)
NPAs/loans + REO (%)
NPAs (000s)
How we got here
Asset Quality
Reduce credit risk
Culture
People
Growth
Asset Quality
Asset Liability
Efficiencies
Capital Allocation
Portfolio well protected…
Positioned for growth
20
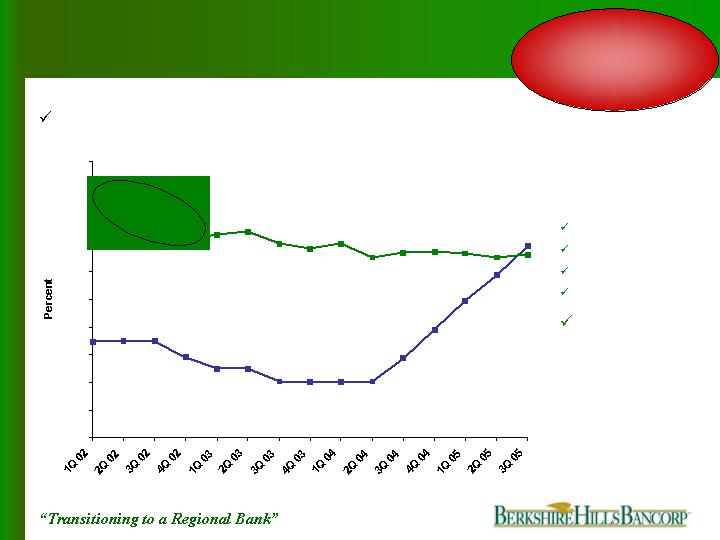
Stable margins against rising rates and flattening yield curve
How we got here
Asset Liability Management
1.95
1.00
1.46
3.31
3.37
3.42
3.59
3.46
1.74
4.36
0.00
0.50
1.00
1.50
2.00
2.50
3.00
3.50
4.00
4.50
5.00
Net Interest Margin
Effective Fed Funds
Sub-Prime Sale
Culture
People
Growth
Asset Quality
Asset Liability
Efficiencies
Capital Allocation
Effectively
matched our
assets &
liabilities
21

D M A I C
Six Sigma literally means 3.4 defects per million opportunities
It is also means continual process improvement that is:
Customer focused
A disciplined approach to problem solving
How we got here
Operating Efficiencies
Six Sigma – Improving business performance
Berkshire Six Sigma…is the new way to think about how we do business.
Growth is a function of achieving performance excellence in all that we do.
Define, Measure, Analyze, Improve, Control
22

How we got here
Operating Efficiencies
2004
11 employees certified as Green Belts
Hired certified Black Belt for training
2005
Created customized materials for in-house training
9 additional Green Belt candidates in progress
Projects range from sales to marketing to recruiting
Culture
People
Growth
Asset Quality
Asset Liability
Efficiencies
Capital Allocation
Six Sigma – Deployment
36% ROI in 2004
$250,000 gross
savings
23
Efficiency through acquisition
How we got here
Operating Efficiencies
41%
518
636
289
347
Data Processing
24%
1,655
1,816
676
1,140
Occupancy
(18%)
2,120
1,996
705
1,291
Other
50%
590
759
336
423
Prof. Services
12,379
$7,172
Total
1Q05
10,582
$5,699
Combined
3Q05*
*Excludes expenses from operating new branches of $190,000, and merger
and conversion charges of $828,000.
37%
4,843
7,536
Total
52%
$2,837
$4,335
Salaries & Benefits
Savings
(% of
Woronoco
1Q05)
Woronoco
1Q05
Berkshire
1Q05
($000s)
Exceeded our
target cost
savings
Culture
People
Growth
Asset Quality
Asset Liability
Efficiencies
Capital Allocation
24
How we got here
Operating Efficiencies
Grow into infrastructure
64.55%
62.73%
60.66%
55.32%
2.89%
2.49%
2.25%
2.09%
50.00%
52.00%
54.00%
56.00%
58.00%
60.00%
62.00%
64.00%
66.00%
2002
2003
2004
3Q 05
0.00%
0.50%
1.00%
1.50%
2.00%
2.50%
3.00%
3.50%
Efficiency Ratio (1)
Non-Interest Expense/ Average Assets (2)
(1)
Exclusive of merger and conversion expenses, other non-recurring items, and amortization of intangible assets
(2)
Exclusive of merger and conversion expenses and other non-recurring items
Culture
People
Growth
Asset Quality
Asset Liability
Efficiencies
Capital Allocation
Operating efficiencies
key to turnaround
25
Stock buybacks
Repurchased 16.1% of outstanding stock 2002-2005
Over 1 million shares; average price: $25.49
Expansion
Woronoco
Non-interest income
Berkshire Financial Planning, Inc.
Two insurance agencies
De novo branches
How we got here
Strategic Capital Allocation
Returned capital
to shareholders &
invested for future
growth
Culture
People
Growth
Asset Quality
Asset Liability
Efficiencies
Capital Allocation
26

How we got here
Strategic Capital Allocation
Technology subsidiary
Nearly $500 thousand per year
pretax loss between 2001-2004
Divested in 2004
Sub-prime auto
Nearly $3.5 million net charge-offs
per year between 2000-2003
Divested in 2003
Meet income
standards or
gone
Culture
People
Growth
Asset Quality
Asset Liability
Efficiencies
Capital Allocation
Divested non-core assets
27
How we got here
Strategic Capital Allocation
Effectively
employed
excess capital
Culture
People
Growth
Asset Quality
Asset Liability
Efficiencies
Capital Allocation
28

Where We Are Now
13.45
9.72
7.60
1.54
ROTE %
0.97
0.90
0.81
0.20
ROTA %
*Annualized
**All measures, except net interest margin, exclude non-recurring items, securities gains, and intangible
amortization. The non-interest expense to average assets includes intangible amortization.
8,988
2.49
62.73
3.61
7.61
0.81
2003
2.09
2.25
2.89
NI exp/average assets %
3Q05*
2004
2002
20,588
11,085
7,905
Core net income ($000s)
(excl. intangible amortization)
55.32
60.66
64.55
Efficiency ratio %
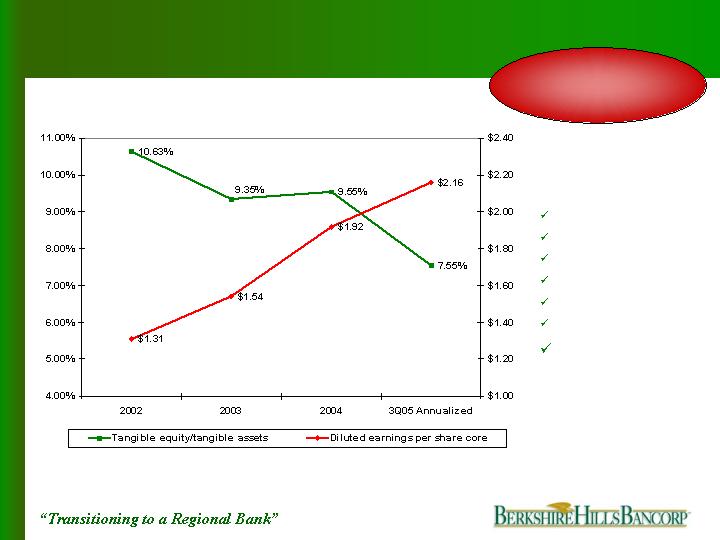
Key Measures**
3.31
3.37
4.18
Net interest margin (FTE)%
14.52
9.37
3.97
Core ROTE % (excl.
intangible amortization)
1.05
0.87
0.75
Core ROTA % (excl.
intangible amortization)
Successful
turnaround
Culture
People
Growth
Asset Quality
Asset Liability
Efficiencies
Capital Allocation
29

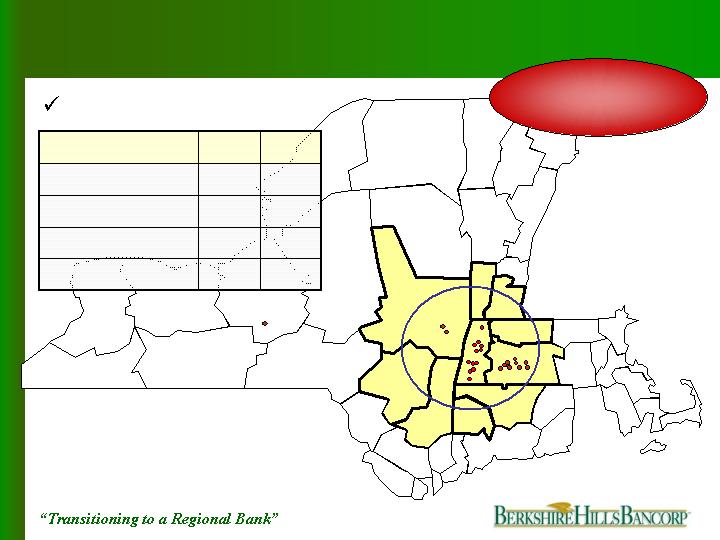
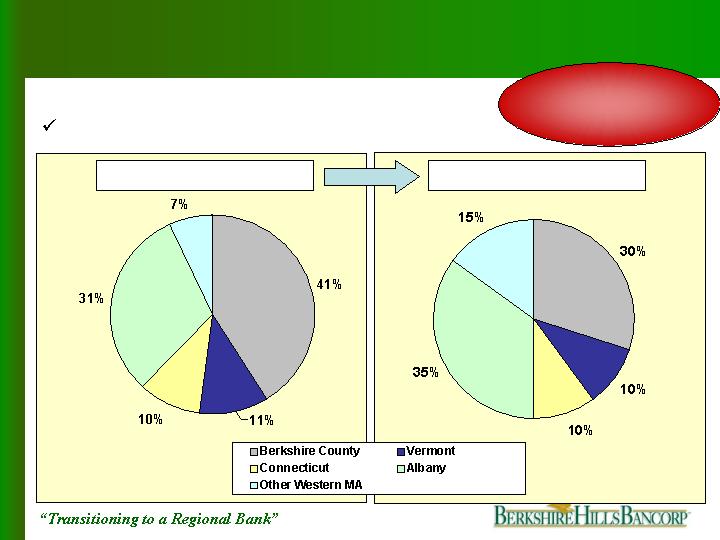
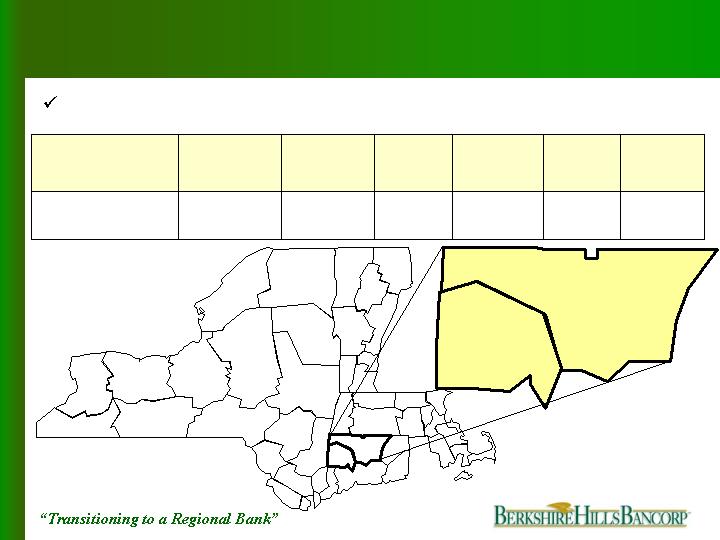
“Transitioning to a Regional Bank”
Where We Are Going
and
How We Will Get There
Regional Growth
Retail Banking
Deposit Gathering
Mortgage Lending
Consumer Lending
Commercial Banking
Wealth Management
Insurance
Financial Highlights
Corporate
Part III: 2005 - 2008
30
Where we are going
Regional Growth
Extend our
success beyond
Berkshire County
31
Where we are going
Competition
Regional bank
niche opportunity
Capital Region
Under $1.5 Billion
48 banks & CUs
$30 Billion +
6 - B of A, Citizens
HSBC, Key,
M&T, & Banknorth
$1.5 - $30 Billion
4 – First Niagara,
NBT, Trustco &
Berkshire Bank
Berkshire County
Under $1.5 Billion
19 banks & CUs
$30 Billion +
2- Citizens & Banknorth
$1.5 - $30 Billion
1 – Berkshire Bank
Pioneer Valley
Under $1.5 Billion
39 banks & CUs
$30 Billion +
4 – B of A, Citizens,
Sovereign & Banknorth
$1.5 - $30 Billion
2 – Chittenden &
Berkshire Bank
32

Retail Banking
Part III: 2005 - 2008
33

2,801
3,185
2,418
Population/ branch
$13.9
$9.1
$2.7
Deposits 6/05 (billions)
3.46%
2.23%
-1.65%
5 Year projected growth
$49,634
618
Pioneer
Valley
Capital
Region
Berkshire
County
$46,954
133
$51,351
818
Median HH income
Population (000s)
Regional growth opportunity
Where we are going
Retail Banking - Deposit Gathering
Opportunities in
contiguous markets
34
Where we are going
Retail Banking - Deposit Gathering
De novo branching
Double number of
branches by 2008
50
24
Total
11
11
Berkshire County
10
3
2005
18
Pioneer Valley
21
New York
2008
Projected Yr End
35

Where we are going
Retail Banking - Deposit Gathering
Strategy and goals
Maintain
Berkshire County
dominance
Branding
Centers of influence
Relentless calling effort
Municipal banking
Deposit insurance fund
Double Pioneer
Valley market
share
Gain 3% market
share in Capital
Region
36

Where we are going
Retail Banking - - Deposit Gathering
48%
$2,000
N/A
$1,348
Total
1066%
$338
<1%
$ 29
New York State
$748
$914
Projected
Deposits
2008
(millions)
4.6%
31.7%
Estimated
Market
Share
Projected
Growth
Through 2008
Deposits
9/05
(millions)
Market
$465
$854
61%
7%
Pioneer Valley
Berkshire County
Regional growth goals
90% of projected
growth from outside
Berkshire County
37

$4,000
$3,500
$800
Mortgage originations 2004
(millions)
3.46%
2.23%
-1.65%
5 Year projected growth
$49,634
618
Pioneer
Valley
Capital
Region
Berkshire
County
$46,954
133
$51,351
818
Median HH income
Population (000s)
Regional growth opportunity
Where we are going
Retail Banking – Mortgages
Opportunity in
contiguous markets
38

Where we are going
Retail Banking - Mortgages
42%
$781
N/A
$551
Total
327%
28%
23%
$141
$361
$291
.5%
2%
$33
12%
$282
Projected
Mortgages
2005-2008
(millions)
Estimated
Market Share
Projected
Growth
Through 2008
Mortgages
9/05
(millions)
Market
$236
Capital Region
Pioneer Valley
Berkshire County
Regional growth
42% three
year growth
39

Where we are going
Retail Banking - - Mortgages
Strategy and goals
Engage branch personnel
Triple outside origination staff
Capitalize on second home market and
metropolitan relocation
40

6%
Albany
8%
Pittsfield
17%
Springfield
21%
Boston
40%
Long Island
48%
Cape Cod
% Overvalued
Market
Overvalued Real Estate
* Source National City Bank 1st Qtr 2005
Credit risk partially protected from bubble
Where we are going
Retail Banking - Mortgages
41

Where we are going
Retail Banking - Mortgages
Portfolio protected
Interest only loans: None
Uninsured mortgages with LTV in excess
of 80%: None
Losses 2000 – 2005: None
Average LTV: 61%
Average FICO: 728
Delinquency 2005: .12%
Maintain credit
standards
42

Where we are going
Retail Banking – Consumer Lending
29%
$169
1.2%
$131
Total
360%
13%
20%
$23
$85
$61
.1%
5%
$5
12%
$75
Projected
Growth
2005-2008
(Millions)
Estimated
Market
Share
Projected
Growth
Through
2008
Equity
Loans 9/05
(Millions)
Market
$51
Capital Region
Pioneer Valley
Berkshire County
Equity Lines
Regional growth
29% three year
growth
43

Where we are going
Retail Banking - - Consumer Lending
Equity Lines
Maintain credit quality
HELOC
LTV in excess of 80%: None
Losses 2002 - 2005: None
Average FICO 2004-2005: 756
Average LTV: 55%
Delinquency 2005: .25%
44

Indirect Auto
Regional growth opportunity
Where we are going
Retail Banking - Consumer Lending
21%
15
73
Southern Vermont
34%
45
132
Capital Region
8%
94%
Penetration
10
34
Active BHLB
Dealers
# of Dealers
Market
122
36
Pioneer Valley
Berkshire County
Opportunity in
contiguous markets
45
Where are we going
Retail Banking – Consumer Lending
Indirect Auto
Regional growth goals
Absolutely no
subprime loans
3Q05 - $150 Million
2008 - $268 Million
79% growth
46

Where we are going
Retail Banking - - Consumer Lending
Strategy and goals
Advertise service
Benefit from Six Sigma principles
Answers in 30 minutes
Payments to dealers same day
Call program on high quality dealers
Utilization of branch network
Continue personal contact…people dealing with
people
Critical when accepting no subprime
47

Where we are going
Retail Banking - - Consumer Lending
Indirect Lending
Maintain credit quality
Sub-prime loans since 2001: None
Average FICO of portfolio: 715
Average 2005 FICO: 732
Delinquency 2005: .47%
Losses 2005: .42%
48

Where we are going
Retail Banking
$17,009
$3,213
$432
$781
$2,000
Projected
2008
25%
46%
43%
42%
48%
% Increase
$13,557
Pretax income
$2,201
Total
$302
$551
9/30/2005
Annualized
$1,348
Consumer loans
Mortgages
Deposits
Growth
Note: All numbers in millions except pretax income which is in thousands.
49

Commercial Banking
Part III: 2005 - 2008
50

Where we are going
Commercial Banking
Massachusetts
Why we have been successful
Not a priority for large banks
Smaller banks have been acquired
Mid-cap borrowers prefer local relationship
Community involvement leads to business
Corporate commitment to commercial banking
Growth plan
Maintain dominance in Berkshire County
Opportunity from Woronoco acquisition
Robust growth in Capital Region
Regional presence in adjacent markets with quality leadership
Consistent growth
51

Where we are going
Commercial Banking
Why the Capital Region
Lack of focus by larger banks
Tech Valley growth initiative
Demand for local bank presence
Capital Region
Ignored Market
52

What we have now
4 lenders with 125 years combined experience
$83 million loans, $44 million pipeline
Growth plan
Add 2 seasoned lenders by 3/31/2006
Add 2 lenders in 2007
Grow to $345 million by 2008
Where we are going
Commercial Banking
Capital Region
53

1%
3%
35%
BHLB estimated market share
83
121
355
BHLB commercial loans ($M)
47,926
32,216
7,781
Total business revenues ($M)
4,250
23,736
Pioneer
Valley
Capital
Region
Berkshire
County
1,025
6,984
6,300
31,434
Estimated commercial loans ($M)
Total businesses
How we will get there
Commercial Banking
Regional growth opportunity
Opportunity in
contiguous markets
54
Deposits
($billion)
Sales
($billion)
Businesses
Median
HH
Income
Projected
Growth
Population
(000s)
Market
$76.9
$7.7
$19.1
$2.7
50,207
6,984
2.74%
-1.65%
1,039
133
$60,534
$46,954
Northern Connecticut
Berkshire County
Potential growth in northern Connecticut
Where we are going
Commercial Banking
55
Deposits
($billion)
Sales
($billion)
Businesses
Median HH
Income
Projected
Growth
Population
(000s)
Market
$5.3
$7.7
$1.5
$2.7
5,241
6,984
1.07%
-1.65%
81
133
$43,769
$46,954
Southern Vermont
Berkshire County
Where we are going
Commercial Banking
Potential growth in southern Vermont
56

How we will get there
Commercial Banking
71%
$21,419
$12,492
Pretax income
98%
$1,109
$559
Totals
316%
127%
$345
$275
1%
3%
$489
Projected
Commercial
Loans 2008
(millions)
35%
Estimated
Current
Market Share
38%
Percentage
Increase
2005 - 2008
Commercial
Loans 9/05
(millions)
Market
$83
$121
$355
Capital Region
Pioneer Valley
Berkshire County
Regional growth goals
57

Wealth Management
Part III: 2005 - 2008
58
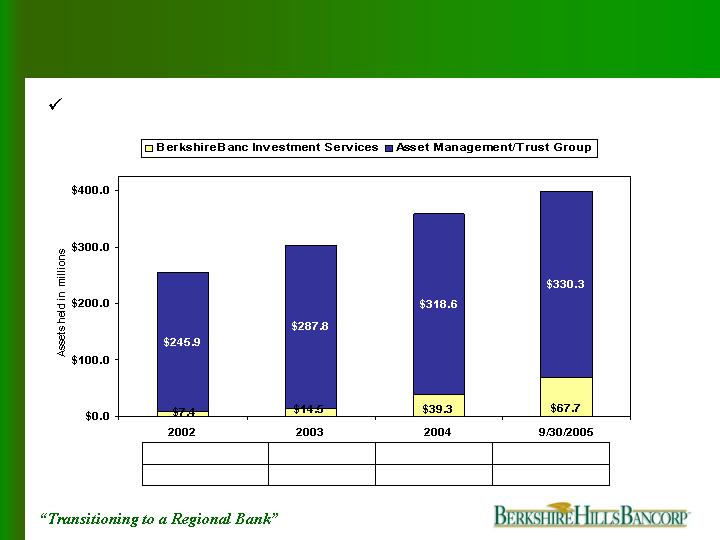
Where are we going
Wealth Management
11.2%
18.4%
19.3%
Annual growth rate
$397.9
$357.9
$302.3
$253.3
Assets under management
$253.3
$302.3
$357.9
$398.0
59

Where are we going
Wealth Management
Client centered/consultative wealth
management relationship
Financial planning platform with 5 CFPs
Investment management capabilities are not
outsourced
Credible investment results – 10 year history
Emphasis on personal investment management
Strategy and goals
Building momentum with
a proven process
60

Where are we going
Wealth Management
Peer comparison
Ranked 374th largest trust department out of 1,500
Ranked 12th largest in Massachusetts out of 35
departments
Ranked 9th (tied) nationally out of the largest 400
trust departments (fiduciary income as percent of
trust assets)
Favorable
peer comparison
2004
11%
21%
Growth in revenue
8%
11%
Growth in AUM
Peer Group
Berkshire Bank
61

How we will get there
Wealth Management
100%
$795
$398
Total
$186
$84
$525
Projected
AUM 2008
(millions)
<1%
<1%
19.7%
Estimated
Market
Share
Projected
Growth
Through 2008
AUM
9/30/05
(millions)
Market
$2
$23
$373
920%
265%
41%
Capital Region
Pioneer Valley
Berkshire County
Regional growth
62

How we will get there
Wealth Management
Regional growth
51.31
49.82
47.13
% of households $50K+
818
618
133
Population (000s)
$1.3
$23.3
$373.4
BHLB AUM (millions)
$14.8
$11.2
$2.4
Estimated market (billions)
23.95
Pioneer
Valley
Capital
Region
Berkshire
County
30.25
24.27
% of population 55+
63

Insurance
Part III: 2005 - 2008
64

Where are we going
Insurance – An Emerging Business
Referral source of over 400 people
Captive audience with existing customers
Qualified leads through lending activities
Additional lines of business
Life
Disability
Health
Expect 15-20% pretax profit margin within 3 years
Overview
65

Where are we going
Insurance
Strategy and goals
Key to our strategy
going forward
Percent of Revenues
25%
10%
5%
0%
Capital Region
Pioneer Valley
Berkshire County
Market
100%
0%
2005
85%
10%
2006
70%
20%
2007
45%
30%
2008
66

818
618
133
Population (000’s)
<0.1%
<1.0%
<0.1%
Market share
$774
$585
$172
Estimated insurance
revenue (millions)
23,736
Pioneer Valley
Capital Region
Berkshire
County
6,984
31,434
Businesses
Regional growth
How we will get there
Insurance
67

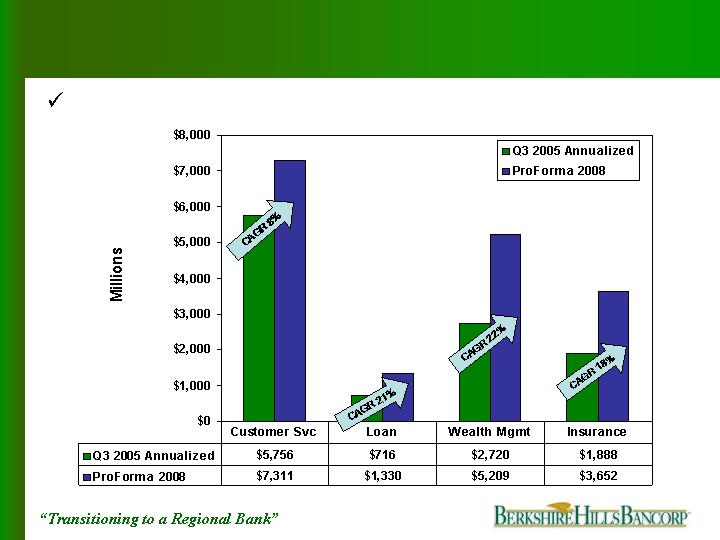
Financial Highlights
Part III: 2005 - 2008
68
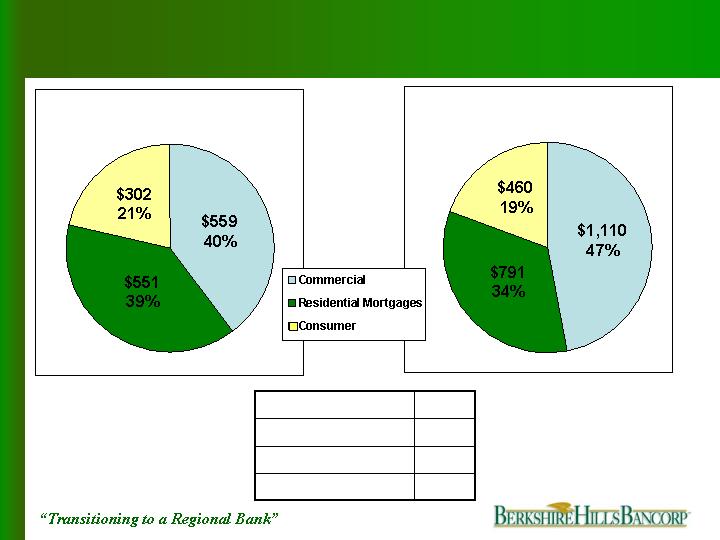
17%
Total
14%
Consumer lending
12%
Residential mortgages
23%
Commercial
CAGR
Actual 9/30/05
(millions)
ProForma 12/31/08
(millions)
Financial Highlights
Loan Growth
69
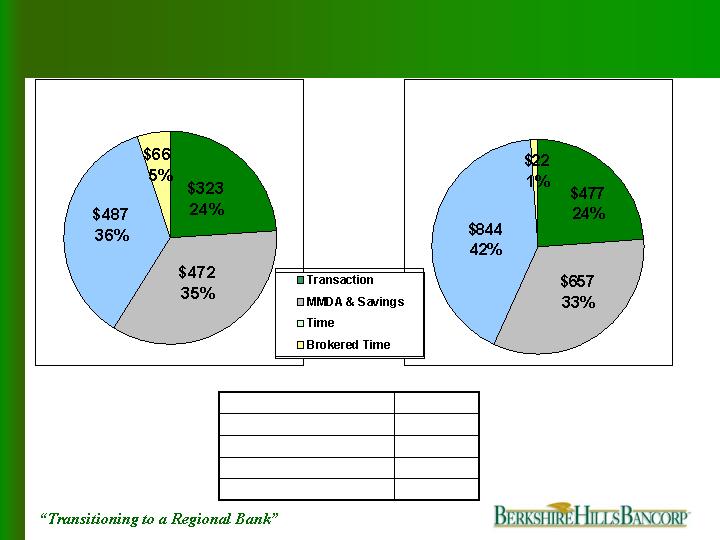
13%
Total
-29%
Brokered Time
18%
Time
11%
MMDA & Savings
13%
Transaction
CAGR
Financial Highlights
Deposit Growth
Actual 9/30/05
(millions)
ProForma 12/31/08
(millions)
70
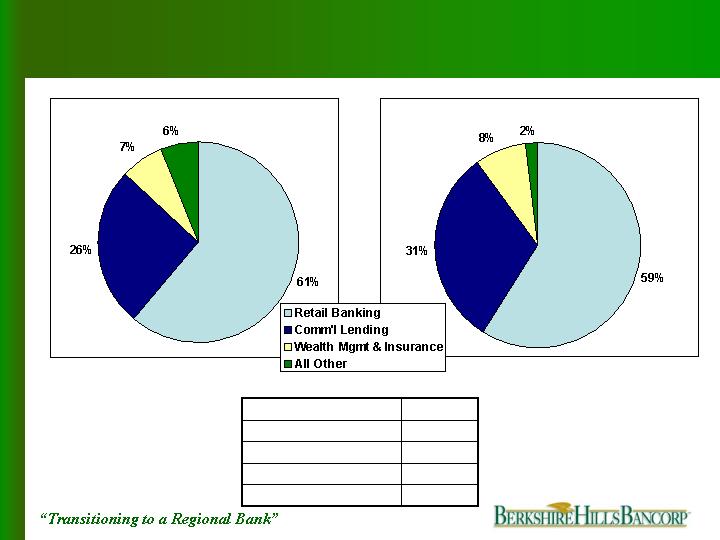
Financial Highlights
Revenue Distribution
3rd Qtr 2005
ProForma 2008
13%
Total Revenues
16%
Sub total
20%
Wealth Mgmt & Ins
21%
Comm’l
13%
Retail
CAGR
71
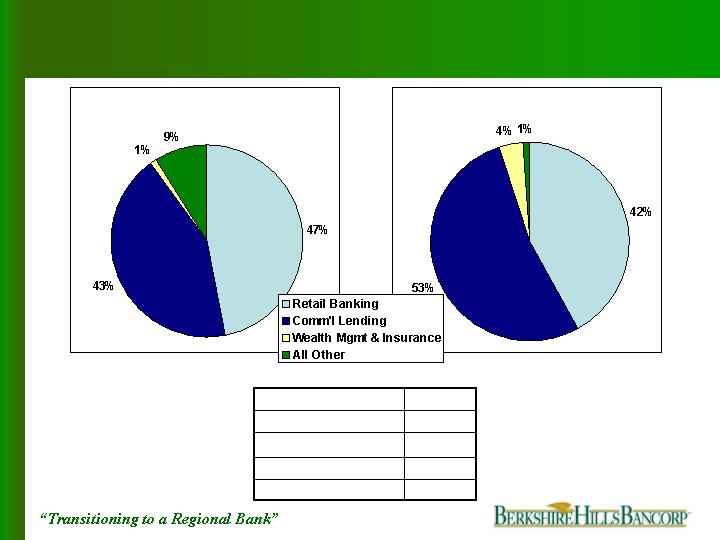
Financial Highlights
Pretax Profit Distribution
3rd Qtr 2005
ProForma 2008
11%
Total Pretax Profit
14%
Sub-total
82%
Wealth Mgmt & Ins
18%
Comm’l
7%
Retail
CAGR
72
Financial Highlights
Service fee income
73

Remain well capitalized
Execute de novo branching and commercial banking strategy without
raising capital
Capital alternatives
Trust preferred
Subordinated debt
Financial Highlights
Capital Management
10.1%
10.9%
Total risk based capital (bank)
7.4%
7.3%
Tier 1 leverage capital (bank)
7.0%
7.6%
Tangible equity/assets
ProForma
12/31/08
9/30/2005
74

Wrap – Up
Strategic Highlights
Part III: 2005 - 2008
75

Wrap up
Strategic Highlights
Maintain focus on our strengths
Culture
People
Growth
Asset quality
Asset liability management
Operational efficiencies
Strategic capital allocation
76

Where we are going
Competition
Regional bank
niche opportunity
Capital Region
Under $1.5 Billion
48 banks & CUs
$30 Billion +
6 - B of A, Citizens
HSBC, Key,
M&T, & Banknorth
$1.5 - $30 Billion
4 – First Niagara,
NBT, Trustco &
Berkshire Bank
Berkshire County
Under $1.5 Billion
19 banks & CUs
$30 Billion +
2- Citizens & Banknorth
$1.5 - $30 Billion
1 – Berkshire Bank
Pioneer Valley
Under $1.5 Billion
39 banks & CUs
$30 Billion +
4 – B of A, Citizens,
Sovereign & Banknorth
$1.5 - $30 Billion
2 – Chittenden &
Berkshire Bank
77

Wrap up
Financial Highlights
1.02%
1.05%
Core ROTA
(excl. intangible amortization)
3.31%
55.32%
0.97%
14.52%
13.45%
Actual Q3 2005
Annualized
ProForma
FY 2008
3.49%
Net interest margin
57.62%
Efficiency ratio
1.00%
Return on tangible assets
14.54%
Core ROTE
(excl. intangible amortization)
14.15%
Return on tangible equity
78
Wrap up
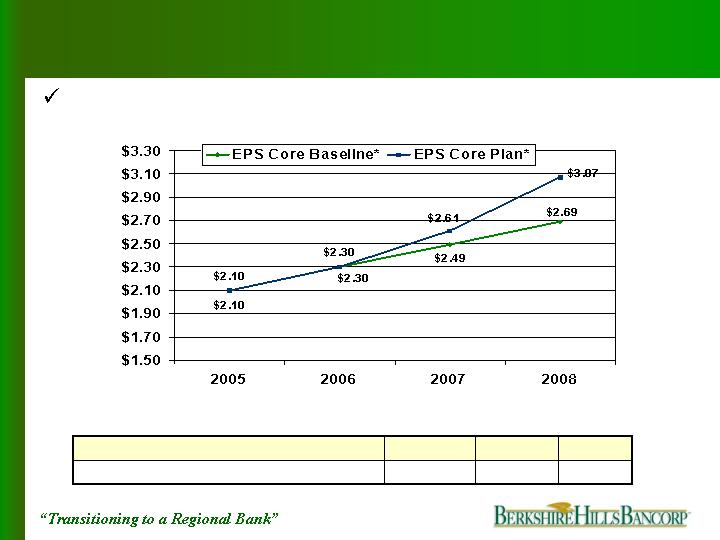
Strategic Highlights
14.0%
4.8%
0
Accretion/(Dilution) to core baseline
2008
2007
2006
Projected core EPS performance
*Exclusive of security gains and non-recurring expenses
79

Wrap up
Strategic Highlights
Summary
Significant
organic growth
Double branch
network size
Double
Commercial loans
Double size of
wealth management
Emerging
insurance
business
58% increase in
total fee income
48% increase in
deposits
43% increase in
consumer loans
42% increase in
mortgages
80

Banking as a Business
Lawrence A. Bossidy
Chairman
Michael P. Daly
President & Chief Executive Officer
New York City
December 1, 2005
81

Appendix
82
Appendix: Reconciliation of GAAP and Core Income
$1.31
$1.54
$1.92
$0.54
Diluted core earnings per share
$7,702
$8,785
$10,987
$4,743
Net core earnings
203
203
98
404
Add: Amortization of intangibles, net of tax
-
243
Add: Disallowance of the dividend received deduction on the Bank’s REIT
9,211
1,107
Add: Net losses and expenses on sale of sub-prime auto loans, net of tax
5,258
307
Add: Net other non-recurring, net of tax
$0.36
$1.57
$2.01
$0.54
Diluted earnings per share-GAAP
5,867
5,703
5,731
8,856
Average diluted shares outstanding (000s)
9,550
2,022
953
541
Less: Gain on the sale of securities, net of tax
$1.35
$1.58
$1.93
$0.58
Diluted core earnings per share, excluding intangible amortization
686
185
431
Add: Loss from discontinued operations -Sale of EastPoint Tech., net of tax
$7,905
$8,988
$11,085
$5,147
Net core earnings, excluding intangible amortization
-
$2,097
2002
-
$8,965
2003
-
538
Add: Merger and conversion-related expenses, net of tax
$11,509
$4,746
Net income
2004
3rd Qtr
2005
($000s) Except earnings per share
83