
Keefe, Bruyette & Woods
Regional Bank Conference
Michael P. Daly
President and Chief Executive Officer
Boston, Massachusetts
March 1, 2006

Cautionary Statement
Statements contained in this presentation contain forward-looking statements within the meaning of the
Private Securities Litigation Reform Act of 1995. These statements are based on the beliefs and
expectations of management as well as the assumptions made using information currently available to
management. Since these statements reflect the views of management concerning future events, these
statements involve risks, uncertainties and assumptions. These risks and uncertainties include among
others, changes in market interest rates and general and regional economic conditions, changes in
government regulations, changes in accounting principles and the quality or composition of the loan and
investment portfolios and other factors that may be described in Berkshire Hills Bancorp, Inc.’s quarterly
reports on Form 10-Q for the quarters ended March 31, June 30 and September 30 and in its 2004 annual
report on Form 10-K, each filed with the Securities and Exchange Commission, which are available at
the Securities and Exchange Commission’s internet website ( www.sec.gov) and to which reference is
hereby made. Therefore, actual future results may differ significantly from results discussed in the
forward-looking statements.
You are cautioned not to place undue reliance on any forward-looking statements, which speak
only as of March 1, 2006. Except as required by applicable law
or regulation, Berkshire Hills Bancorp, Inc. undertakes no obligation to update
any forward-looking statements, to reflect events or circumstances that occur
after March 1, 2006.

Today’s Agenda
Culture and people
Growth
Asset quality
Asset liability management
Operational efficiencies
Strategic capital allocation
3

Culture and People
Attract and retain good people
Strengthen team, stay focused,
single vision, pay for performance
Continually strengthen board
Instill culture of enthusiasm,
teamwork and energy
Team transformation
Culture and
People
Growth
Asset Quality
Asset Liability
Efficiencies
Capital Allocation
4

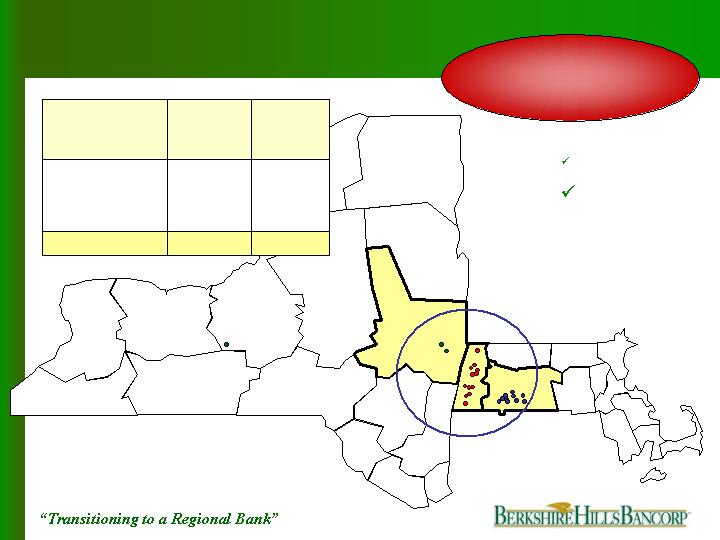
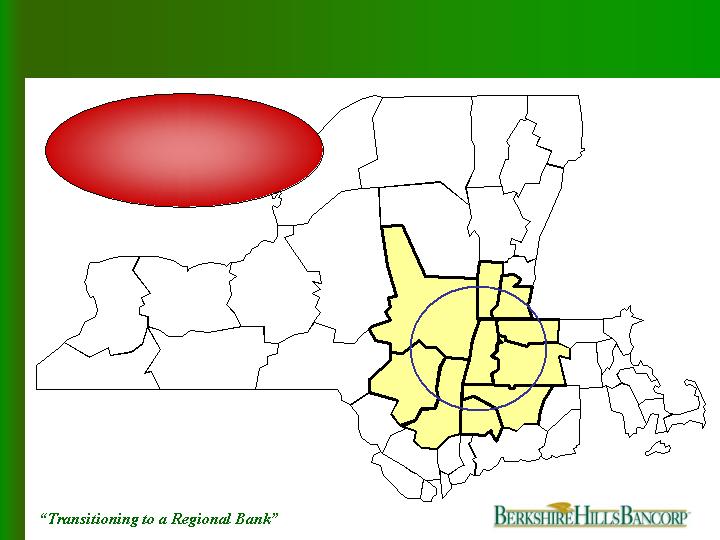
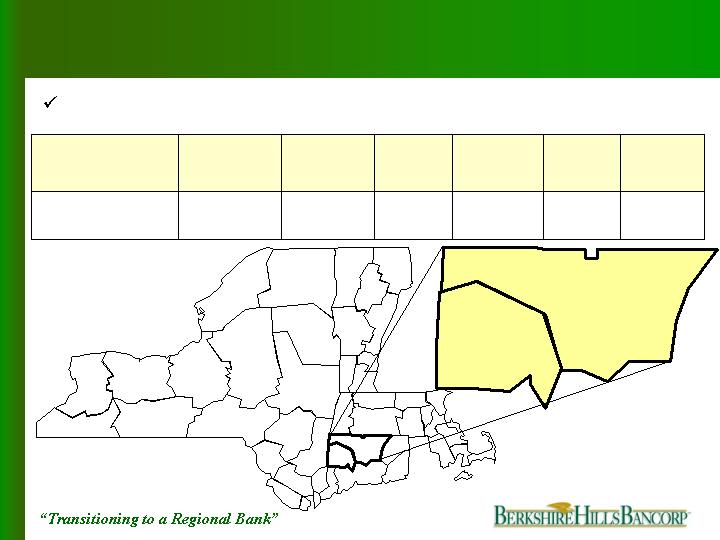
Profile
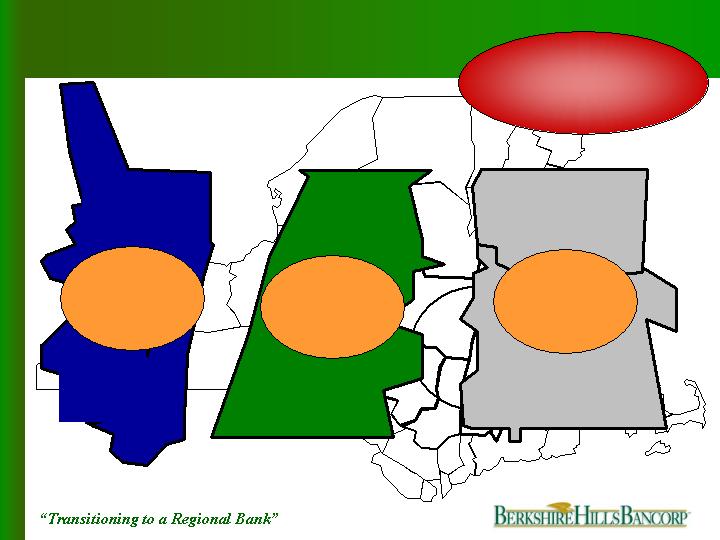
Berkshire County, MA
Pioneer Valley, MA
Capital Region, NY
5
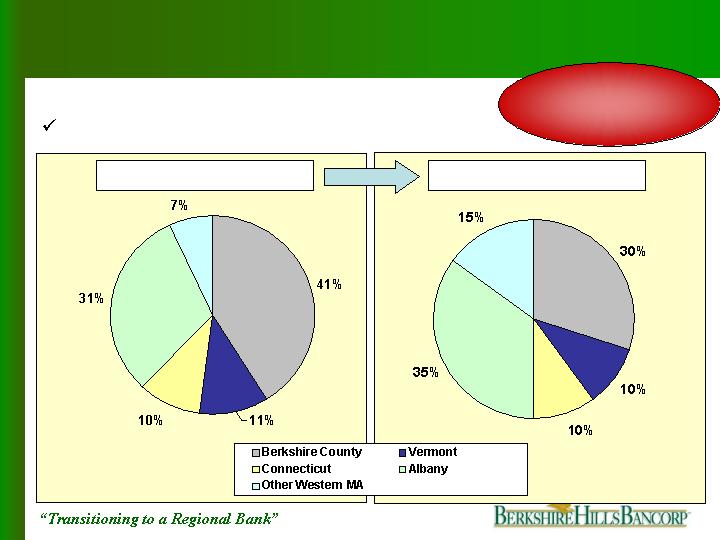
State chartered savings bank with commercial bank balance sheet
Ownership Profile – December 31, 2005
Institutional holders
41%
Insiders*
9%
Individuals
43%
Foundation
7%
Corporate Profile – December 31, 2005
Market capitalization
$291 million
Assets
$2.0 billion
Loans
$1.42 billion
Deposits
$1.37 billion
Employees
399 FTE’s
Operations
24 full-service branches
10 free standing ATMs
*Not including options
3
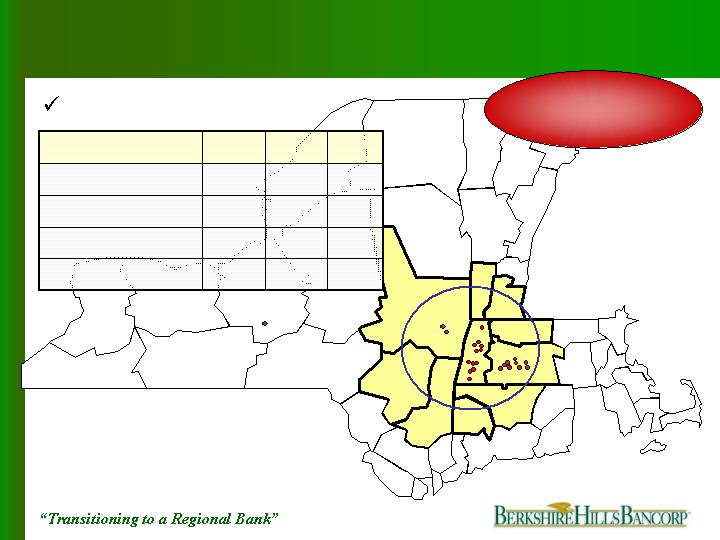
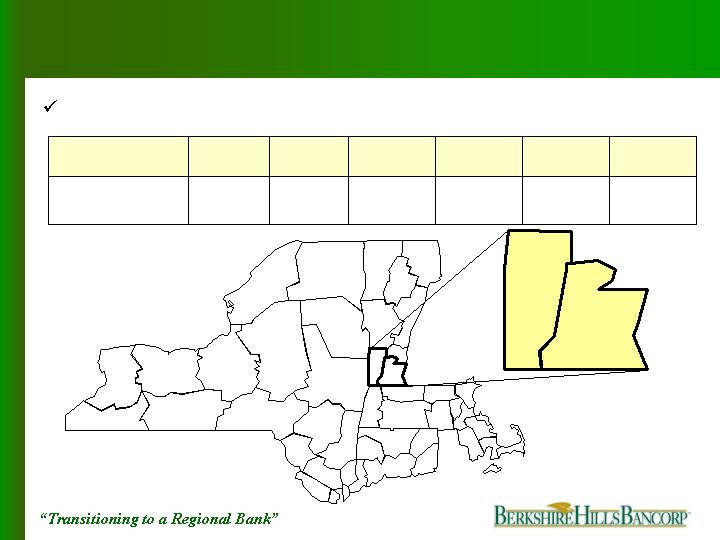
$41
New York State
24
$1,371
Total
Branches
12/31/05
Deposits
(millions)
Market
$473
$857
10
11
Pioneer Valley
Berkshire County
Primary Market Area
Our values will drive
our success in
expanded markets
Culture and People
Growth
Asset Quality
Asset Liability
Efficiencies
Capital Allocation
6
Growth
Significant annual
growth in every
division
Culture and People
Growth
Asset Quality
Asset Liability
Efficiencies
Capital Allocation
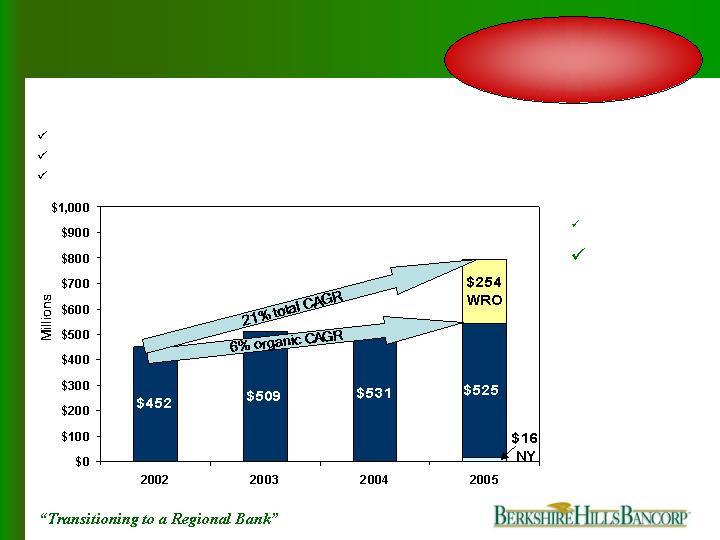
Core Deposits
$795
Core deposit compound growth rate excluding Woronoco = 6%
Core deposit compound growth = 21%
Core deposits in NY represent 40% of total deposits of $41 million
7
Growth
Significant annual
growth in every
division
Culture and People
Growth
Asset Quality
Asset Liability
Efficiencies
Capital Allocation
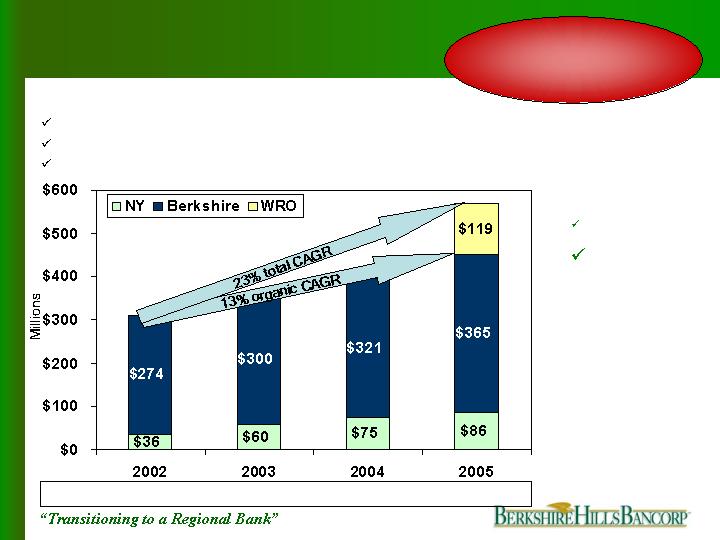
$570
Compound growth rate since 2002 exclusive of Woronoco = 13%
Compound growth rate since 2002 = 23%
Strong growth trends in NY despite lack of meaningful branch network
Commercial Loans
$310
$360
$396
Total
8
Growth
Significant annual
growth in every
division
Culture and People
Growth
Asset Quality
Asset Liability
Efficiencies
Capital Allocation
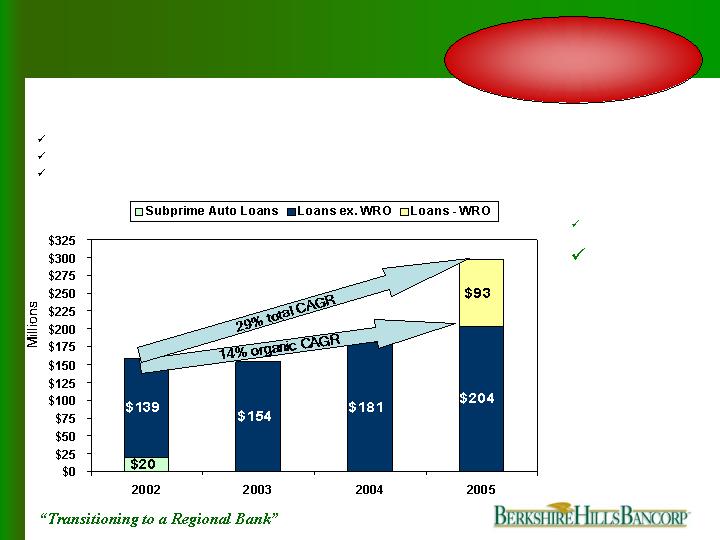
Compound growth rate since 2002 exclusive of Woronoco and sub-prime auto loans = 14%
Compound growth rate since 2002 exclusive of sub-prime auto loans = 29%
Auto loan portfolios’ average FICO at 716 at 12/31/05
Consumer Loans
$297
9
Growth
Significant annual
growth in every
division
Culture and People
Growth
Asset Quality
Asset Liability
Efficiencies
Capital Allocation
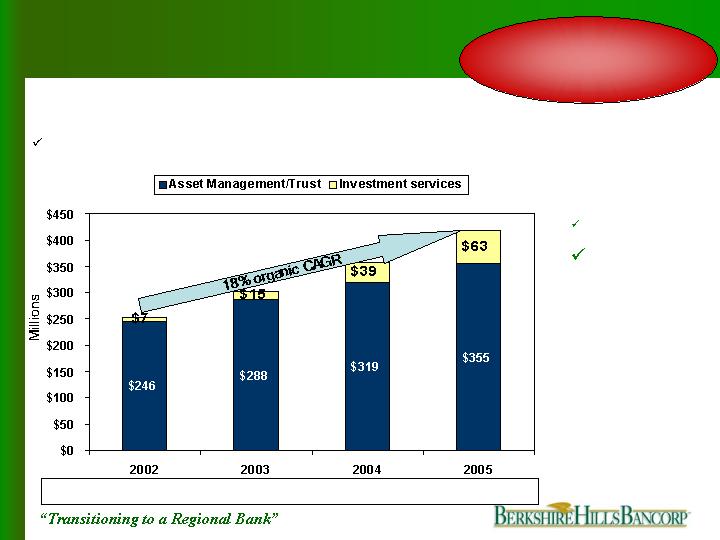
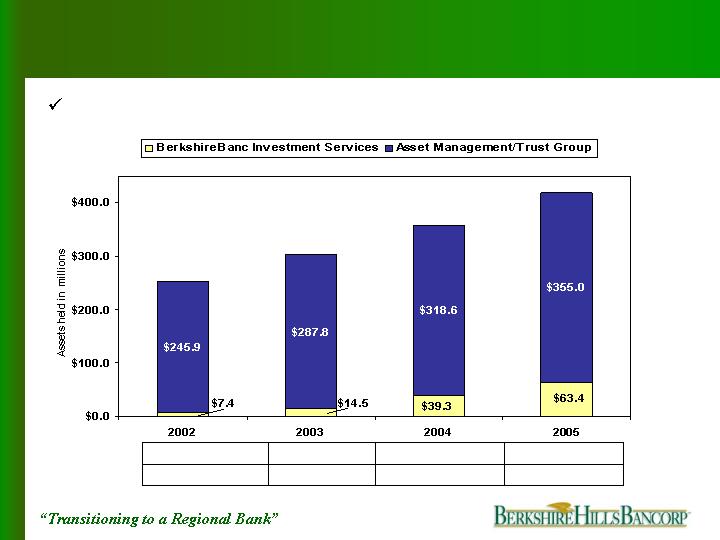
Assets under management compounded growth rate = 18%
Wealth Management Asset Growth
$418
$253
$303
$358
Total
10
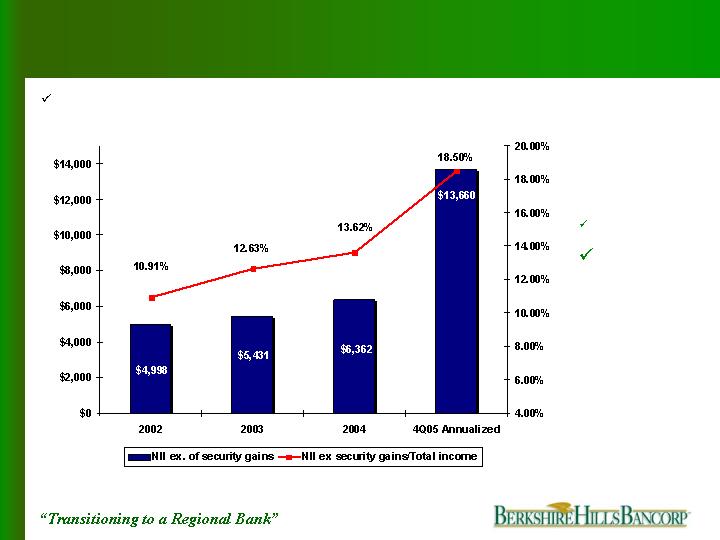
Main drivers of non-interest income: wealth management, insurance, loan service
and customer service fees
Non-Interest Income
Culture and People
Growth
Asset Quality
Asset Liability
Efficiencies
Capital Allocation
Note: Exclusive of security gains
11

0.15
810.5
1.13
0.14
1,152
2004
0.35
280.4
1.13
0.40
3,199
2003
0.87
275.5
1.43
0.72
5,241
2002
0.07
1096.0
0.92
0.08
1,186
2005
NCOs/avg. loans (%)
Allowance/NPLs (%)
Allowance/loans (%)
NPAs/loans + REO (%)
NPAs ($000s)
Asset Quality
Reduce credit risk
Culture and People
Growth
Asset Quality
Asset Liability
Efficiencies
Capital Allocation
Portfolio well protected…
Positioned for growth
12
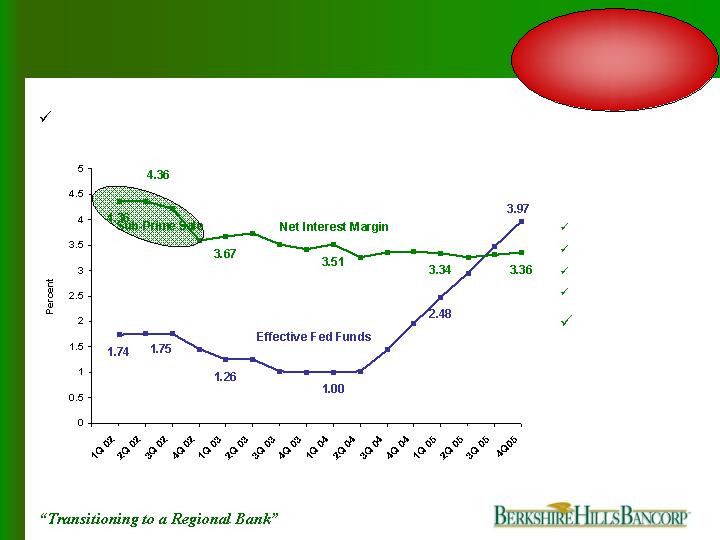
Stable margins against rising rates and flattening yield curve
Asset Liability Management
Effective interest
rate risk
management
Culture and People
People
Growth
Asset Quality
Asset Liability
Efficiencies
Capital Allocation
13
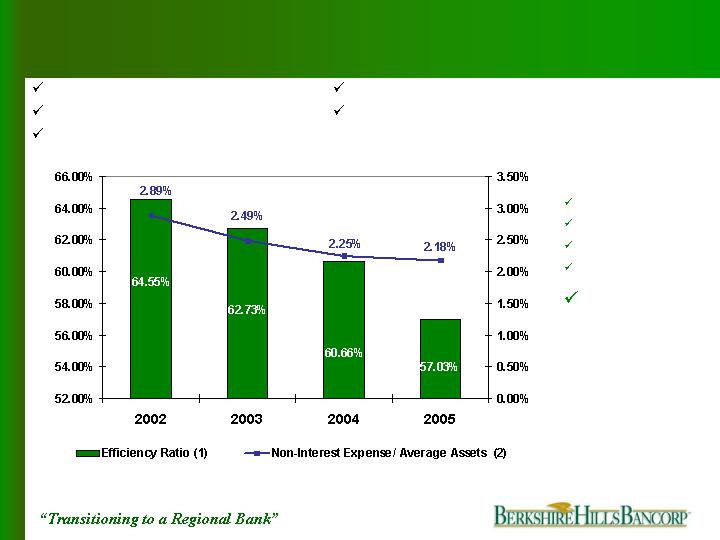
Operating Efficiencies
Reorganization
Sale of sub-prime loans
Sale of EastPoint Technologies
Culture and People
Growth
Asset Quality
Asset Liability
Efficiencies
Capital Allocation
(1)
Exclusive of merger and conversion expenses, other non-recurring items, and amortization of intangible assets
(2)
Exclusive of merger and conversion expenses and other non-recurring items
Achieved 37% cost saves - WRO acq
Six Sigma
14

Operating Efficiencies
Six Sigma – Improving business performance
11 employees certified as Green Belts
9 additional Green Belt candidates in progress
Hired 2 certified Black Belts
Projects range from sales to marketing to recruiting
36% ROI
$250,000 gross
savings
Berkshire Six Sigma…is the new way to think about how we do business.
Growth is a function of achieving performance excellence in all that we do.
15

Stock buybacks
Expansion
Woronoco acquisition
De novo branches
Fee income
Divested sub-prime auto loans 2000 - 2003
Divested technology company 2004
Strategic Capital Allocation
Returned capital
to shareholders &
invested for future
growth
Culture and People
Growth
Asset Quality
Asset Liability
Efficiencies
Capital Allocation
16
Strategic Capital Allocation
Effectively
employed
excess capital
Culture and People
Growth
Asset Quality
Asset Liability
Efficiencies
Capital Allocation
17

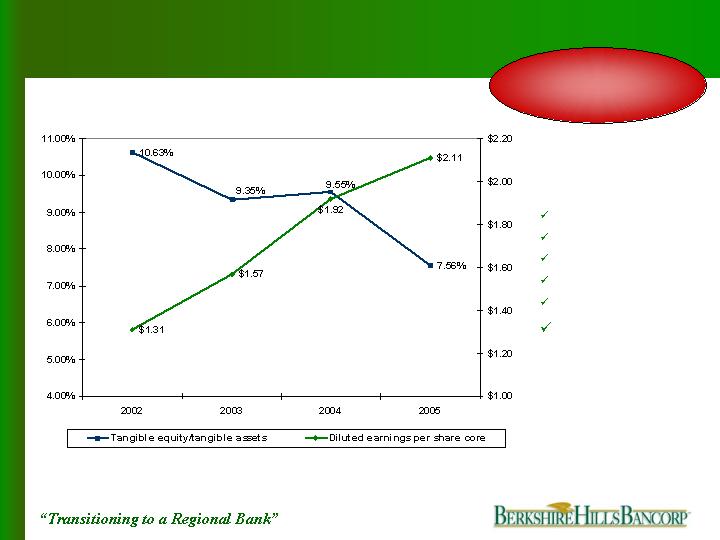
Where We Are Now
1.02
0.87
0.81
0.76
Core Tangible ROA %
7.89
9.06
7.28
1.54
ROE
0.96
0.89
0.80
0.20
ROA
*Annualized
**Please see appendix for reconciliation of non-GAAP financial measures
62.73
3.61
7.97
2003
4Q05*
2004
2002
57.14
60.66
64.55
Efficiency ratio %
Key Measures**
3.36
3.37
4.18
Net interest margin (FTE)%
13.49
9.36
6.28
Core Tangible ROE %
Successful
turnaround
Culture and People
Growth
Asset Quality
Asset Liability
Efficiencies
Capital Allocation
18
Regional Growth
Extend our
success beyond
Berkshire County
19

Competition
Regional bank
niche opportunity
Capital Region
Under $1.5 Billion
48 banks & CUs
$30 Billion +
6 - B of A, Citizens
HSBC, Key,
M&T, & Banknorth
$1.5 - $30 Billion
4 – First Niagara,
NBT, Trustco &
Berkshire Bank
Berkshire County
Under $1.5 Billion
19 banks & CUs
$30 Billion +
2- Citizens & Banknorth
$1.5 - $30 Billion
1 – Berkshire Bank
Pioneer Valley
Under $1.5 Billion
39 banks & CUs
$30 Billion +
4 – B of A, Citizens,
Sovereign & Banknorth
$1.5 - $30 Billion
2 – Chittenden &
Berkshire Bank
20

4,000
3,500
800
Mortgage Originations
(2004) ($millions)
2,801
3,185
2,418
Population/ branch
13.9
9.1
2.7
Deposits 6/05 ($billions)
3.46%
2.23%
-1.65%
5 Year projected growth
$49,634
618
Pioneer
Valley
Capital
Region
Berkshire
County
$46,954
133
$51,351
818
Median HH income
Population (000s)
Regional growth opportunity
Retail Banking
Opportunities in
contiguous markets
21
Retail Banking - Deposit Gathering
De novo branching
Double number of
branches by 2008
6
0
0
6
2006
50
24
Total
11
11
Berkshire County
10
3
2005
18
Pioneer Valley
21
New York
2008
Projected Yr End
22

Retail Banking – Deposit Gathering
Strategy and goals
Maintain
Berkshire County
dominance
Branding
Centers of influence
Improve calling effort
Municipal banking
Deposit insurance fund
Double Pioneer
Valley market
share
Gain 3% market
share in Capital
Region
23

Retail Banking - Deposit Gathering
46%
$2,000
N/A
$1,371
Total
724%
$338
<1%
$ 41
New York State
$748
$914
Projected
Deposits
2008
4.6%
31.7%
Estimated
Market
Share
Projected
Growth
Through 2008
Deposits
12/31/05
(millions)
Market
$473
$857
58%
7%
Pioneer Valley
Berkshire County
Regional growth goals
90% of projected
growth from outside
Berkshire County
24

Retail Banking - Mortgages
42%
$781
N/A
$549
Total
605%
33%
13%
$141
$361
$291
.5%
2%
$20
12%
$271
Projected
Mortgages
2005-2008
(millions)
Estimated
Market Share
Projected
Growth
Through 2008
Mortgages
12/31/05
(millions)
Market
$258
Capital Region
Pioneer Valley
Berkshire County
Regional growth
42% three
year growth
25

Retail Banking - Mortgages
Strategy and goals
Engage branch personnel
Triple outside origination staff
Capitalize on second home market and
metropolitan relocation
26

Retail Banking - Mortgages
Portfolio protected
Interest only loans: None
Uninsured mortgages with LTV in excess
of 80%: None
Losses 2000 – 2005: None
Average LTV: 61%
Average FICO: 728
Average delinquency 2005: 0.22%
Maintain credit
standards
27

Retail Banking – Consumer Lending
32%
$169
1.2%
$128
Total
1050%
13%
19%
$23
$71
$75
.1%
5%
$2
12%
$63
Projected
Equity Lines
2005-2008
(Millions)
Estimated
Market
Share
Projected
Growth
Through
2008
Equity Lines
12/31/05
(Millions)
Market
$63
Capital Region
Pioneer Valley
Berkshire County
Equity Lines
Regional growth
32% three year
growth
28

Retail Banking - Consumer Lending
Equity Lines
Maintain credit quality
HELOC
LTV in excess of 80%: None
Losses 2002 - 2005: None
Average FICO 2004-2005: 756
Average LTV: 55%
Average delinquency 2005: 0.14%
Maintain credit
standards
29

Indirect Auto
Regional growth opportunity
Retail Banking - Consumer Lending
20
60
35
34
2008
Active
BHLB
Dealers
21%
34%
8%
94%
2005
Penetration
27%
15
73
Southern
Vermont
45%
45
132
Capital
Region
29%
94%
2008
Penetration
10
34
2005
Active
BHLB
Dealers
# of
Dealers
Market
122
36
Pioneer Valley
Berkshire
County
Opportunity in
contiguous markets
30
Retail Banking – Consumer Lending
Indirect Auto
Regional growth goals
Absolutely no
subprime loans
12/31/05 - $148 Million
2008 - $268 Million
81% growth
31

Retail Banking - Consumer Lending
Strategy and goals
Advertise service
Benefit from Six Sigma principles
Answers in 30 minutes
Payments to dealers same day
Call program on high quality dealers
Utilization of branch network
Continue personal contact…people dealing with people
Absolutely no
subprime loans
32

Retail Banking - Consumer Lending
Indirect Lending
Maintain credit quality
Sub-prime loans since 2001: None
Average FICO of portfolio: 716
Average 2005 FICO: 732
Average delinquency 2005: 0.45%
Losses 2005: 0.43%
Maintain credit
standards
33

Retail Banking
27%
45%
45%
42%
46%
% Increase
$17,009
$3,213
$432
$781
$2,000
Projected
2008
(billions)
13%
13%
12%
13%
CAGR
$13,431
Pretax income
(annualized 4Q05)
$2,217
Total
$297
$549
12/31/2005
Annualized
(billions)
$1,371
Consumer loans
Mortgages
Deposits
Growth
34

Commercial Banking
Massachusetts
Why we have been successful
Not a priority for large banks
Smaller banks have been acquired
Mid-cap borrowers prefer local relationship
Community involvement leads to business
Corporate commitment to commercial banking
Growth plan
Maintain dominance in Berkshire County
Opportunity from Woronoco acquisition
Robust growth in Capital Region
Regional presence in adjacent markets with quality leadership
Consistent growth
35

Commercial Banking
New York Region - Why
Ignored Market
Pioneer Valley - Why
Lack of focus by larger banks
Tech Valley growth initiative
Demand for regional bank presence
Lack of focus by larger banks
Demand for regional bank presence
Leveraging investment in WRO
36

1%
3%
36%
BHLB estimated market share
86
119
365
BHLB commercial loans ($M)
47,926
32,216
7,781
Total business revenues ($M)
4,250
23,736
Pioneer
Valley
Capital
Region
Berkshire
County
1,025
6,984
6,300
31,434
Estimated commercial loans ($M)
Total businesses
Commercial Banking
Regional growth opportunity
Opportunity in
contiguous markets
37
Deposits
(billion)
Sales
(billion)
Businesses
Median
HH
Income
Projected
Growth
Population
(000s)
Market
$76.9
$7.7
$19.1
$2.7
50,207
6,984
2.74%
-1.65%
1,039
133
$60,534
$46,954
Northern Connecticut
Berkshire County
Potential growth in northern Connecticut
Commercial Banking
38
Deposits
(billion)
Sales
(billion)
Businesses
Median HH
Income
Projected
Growth
Population
(000s)
Market
$5.3
$7.7
$1.5
$2.7
5,241
6,984
1.07%
-1.65%
81
133
$43,769
$46,954
Southern Vermont
Berkshire County
Commercial Banking
Potential growth in southern Vermont
39

Commercial Banking
72%
$21,419
$12,455
Pretax income
(annualized 4Q05)
95%
$1,109
$570
Totals
301%
131%
$345
$275
1%
3%
$489
Projected
Commercial
Loans 2008
(millions)
36%
Estimated
Current
Market Share
34%
Percentage
Increase
2005 - 2008
Commercial
Loans
12/31/05
(millions)
Market
$86
$119
$365
Capital Region
Pioneer Valley
Berkshire County
Regional growth goals
40
Wealth Management
16.9%
18.4%
19.3%
Annual growth rate
$418.4
$357.9
$302.3
$253.3
Assets under management
$253.3
$302.3
$357.9
$418.4
41

Wealth Management
Client centered/consultative wealth
management relationship
Financial planning platform with 5 CFPs
Investment management capabilities are not
outsourced
Credible investment results – 10 year history
Emphasis on personal investment management
Strategy and goals
Key to our strategy
going forward
42

Wealth Management
$14.8
$11.2
$2.4
Estimated
Market
(billions)
90%
$795
$418
Total
$186
$84
$525
Projected
AUM 2008
(millions)
<1%
<1%
16%
Estimated
Market
Share
Projected
Growth
Through
2008
AUM
12/31/05
(millions)
Market
$2
$23
$393
9200%
265%
34%
Capital Region
Pioneer Valley
Berkshire
County
Regional growth
43

Insurance – An Emerging Business
Referral source of over 400 people
Captive audience with existing customers
Qualified leads through lending activities
Additional lines of business
Life
Disability
Health
Expect 15-20% pretax profit margin within 3 years
Overview
44
Financial Highlights
Service fee income
44% three year
Growth; 13% CAGR
45

Remain well capitalized
Execute de novo branching and commercial banking strategy without
raising capital
Capital alternatives
Trust preferred
Subordinated debt
Capital Management
10.1%
11.1%
Total risk based capital (bank)
7.4%
7.8%
Tier 1 leverage capital (bank)
7.0%
7.6%
Tangible equity/assets
ProForma
12/31/08
12/31/2005
46

Wrap – Up
Strategic Highlights
47

Wrap up
Strategic Highlights
Maintain focus on our strengths
Culture and people
Growth
Asset quality
Asset liability management
Operational efficiencies
Strategic capital allocation
48
Wrap up
Competition
Regional bank
niche opportunity
Capital Region
Under $1.5 Billion
48 banks & CUs
$30 Billion +
6 - B of A, Citizens
HSBC, Key,
M&T, & Banknorth
$1.5 - $30 Billion
4 – First Niagara,
NBT, Trustco &
Berkshire Bank
Berkshire County
Under $1.5 Billion
19 banks & CUs
$30 Billion +
2- Citizens & Banknorth
$1.5 - $30 Billion
1 – Berkshire Bank
Pioneer Valley
Under $1.5 Billion
39 banks & CUs
$30 Billion +
4 – B of A, Citizens,
Sovereign & Banknorth
$1.5 - $30 Billion
2 – Chittenden &
Berkshire Bank
49

Wrap up
Financial Highlights
1.03%
1.02%
Return on tangible assets
3.36%
57.14%
13.49%
Actual Q4 2005
Annualized
ProForma
FY 2008
3.49%
Net interest margin
57.62%
Efficiency ratio
14.10%
Return on tangible equity
50

Wrap up
Strategic Highlights
Summary
Significant
organic growth
Double branch
network size
Double
commercial loans
Double size of
wealth management
Emerging
insurance
business
44% increase in
total fee income
46% increase in
deposits
55% increase in
consumer loans
42% increase in
mortgages
51

KBW Regional Bank Conference
March 1, 2006
If you have any questions, please contact:
Wayne F. Patenaude , CFA
Senior Vice President and CFO
(413) 236-3195
wpatenaude@berkshirebank.com
Company website: www.berkshirebank.com
52

Appendix
53

54