
Michael P. Daly
President and Chief Executive Officer
NASDAQ : BHLB
www.berkshirebank.com

Cautionary Statement
Statements contained in this presentation contain forward-looking statements within the meaning of the
Private Securities Litigation Reform Act of 1995. These statements are based on the beliefs and
expectations of management as well as the assumptions made using information currently available to
management. Since these statements reflect the views of management concerning future events, these
statements involve risks, uncertainties and assumptions. These risks and uncertainties include among
others, changes in market interest rates and general and regional economic conditions, changes in
government regulations, changes in accounting principles and the quality or composition of the loan and
investment portfolios and other factors that may be described in Berkshire Hills Bancorp, Inc.’s quarterly
reports on Form 10-Q for the quarters ended March 31, June 30 and September 30 and in its 2005 annual
report on Form 10-K, each filed with the Securities and Exchange Commission, which are available at
the Securities and Exchange Commission’s internet website ( www.sec.gov) and to which reference is
hereby made. Therefore, actual future results may differ significantly from results discussed in the
forward-looking statements.
You are cautioned not to place undue reliance on any forward-looking statements, which speak
only as of January 9, 2007. Except as required by applicable law or regulation,
Berkshire Hills Bancorp, Inc. undertakes no obligation to update any forward-
looking statements, to reflect events or circumstances that occur
after January 9, 2007.
Please see appendix for GAAP and non-GAAP financial measures. Non-GAAP
financial measures are used by management to provide supplemental
analytical perspectives.

$2.2 billion in total assets (9/30/06)
$70 million in annual insurance premium volume (including recent agency
acquisitions)
$500 million in assets under management
$309 million market capitalization (9/30/06)
31 branches in Western MA and Eastern NY (including 4 announced)
Only locally headquartered regional bank in primary market
Largest bank in Western MA
Four state targeted footprint (MA, NY, CT, VT)
Strong growth based on organic, de novo and acquisition strategies
Diversified revenue sources with strong commercial components
Strengthening board and management team
Profile
Berkshire Hills Bancorp, Inc.
3

Deposit Growth – Total Deposits
($ Millions)
CAGR = 18%
$1,488
Core = 79%
of total
deposits
4
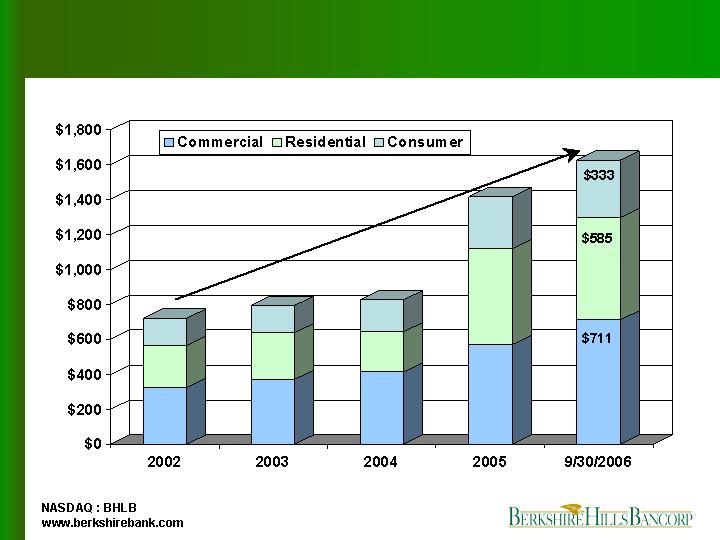
Loan Growth – Total Loans
($ Millions)
CAGR = 22%
$1,629
5

High Quality Loan Portfolio
(Period end ratios)
0.29%
0.31%
0.23%
0.28%
0.88%
Delinquents/
Total Loans
1.18%
0.92%
1.13%
1.13%
1.43%
Allowance/
Total Loans
0.08%
0.06%
2005
0.04%
0.15%
0.35%
0.87%
Net Charge-offs/
Average Loans
0.24%
0.09%
0.26%
0.36%
Non-performers/
Total Assets
9/30/2006
2004
2003
2002
Note: Delinquents are all accruing loans past due 30 days or more.
6
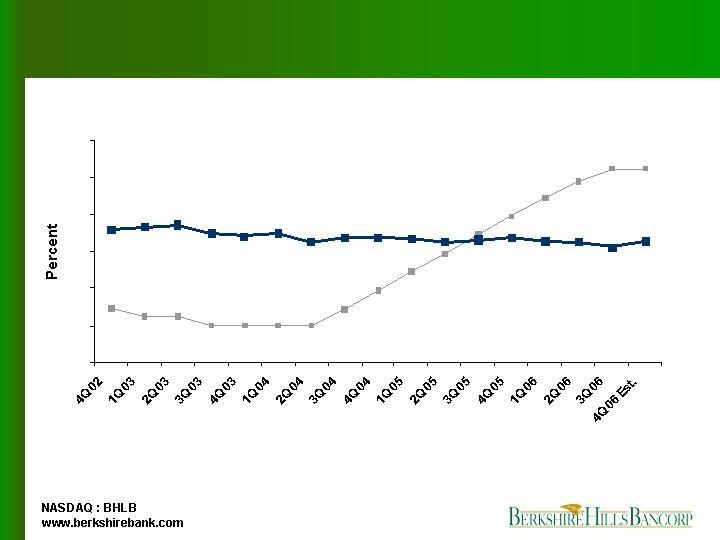
Net Interest Margin
3.27
0
1
2
3
4
5
6
Net Interest Margin
Fed Funds
*Note: Margin in 2Q06 and 3Q06 adjusted for delayed FHLBB dividend. Net
interest margin for 4Q06 based on guidance provided in October 2006.
7
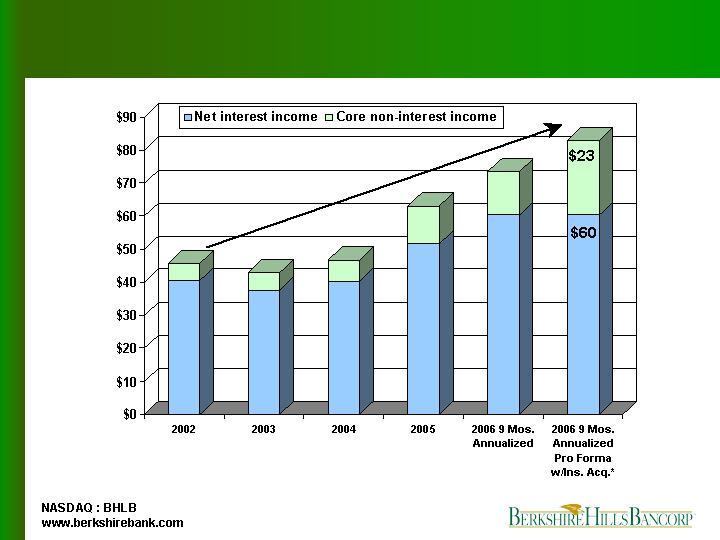
Core Operating Revenue
($ Millions)
CAGR = 16%
*Note: Pro forma is 9 months 2006 annualized plus pro forma
annualized revenues from insurance agencies acquired in 10/06
$83
8

9

Where We’re Headed
How we differentiate ourselves
Geographic expansion
Expansion of income streams
Broaden banking products
Improve profit metrics
10
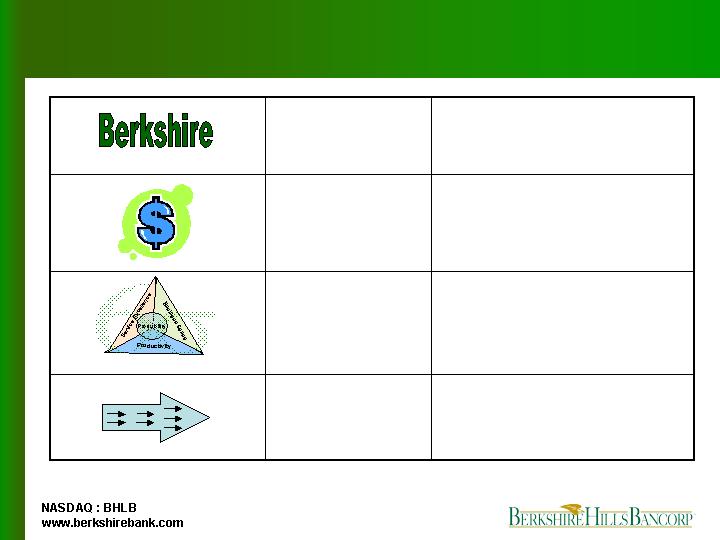
How We Differentiate Ourselves
Enthusiastic and
focused teamwork
Culture
Six Sigma service
excellence, business
sense, productivity,
profitability
Process
Grow the “pool” of
customers and cross
sales
Relationships
Create exciting brand
experience
Brand
11
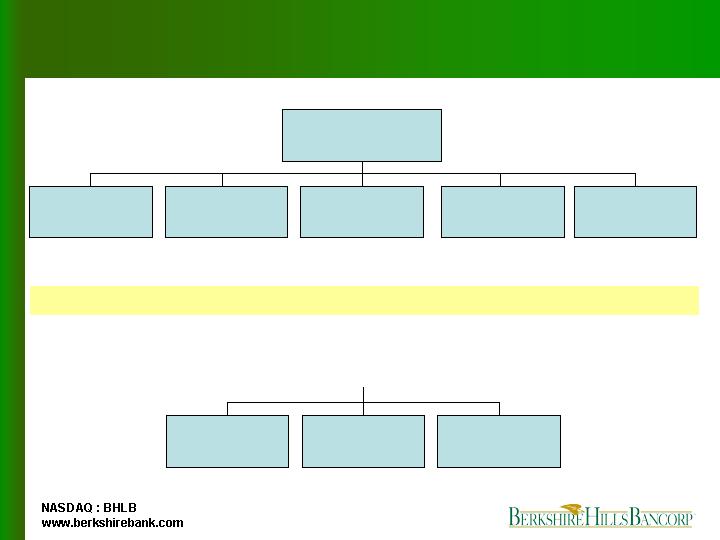
Organization Chart – CEO Reporting
Michael P. Daly
President and CEO
John Howard
EVP, Retail Banking
& Operations
Michael Oleksak
EVP, Commercial
Banking
Ross Gorman
CEO, Berkshire
Insurance Group
Shepard Rainie
SVP, Risk
Management
John Millet
SVP, Interim CFO
Thomas Barney
SVP, Wealth
Management
Linda Johnston
SVP, Human
Resources
Gerald Denmark
SVP, General
Counsel
New Hire CEO Reports
Existing CEO Reports
Hire date:
9/2006
Background:
Bank of America
Consumer Market Exec
Hire date:
2/2006
Background:
TD Banknorth
Co-Regional Exec
Hire date:
10/2006
Background:
Alliance Berkshire
President, MassOne
Hire date:
8/2006
Background:
Bank of America
Managing Director
Promo date:
12/2006
Background:
CPA,
President - Health
12

Regional Growth
Only regional bank headquartered in this market
Market area includes multi-state region
Building market share in attractive, under-served
markets
Regional population of 2.7 million
13
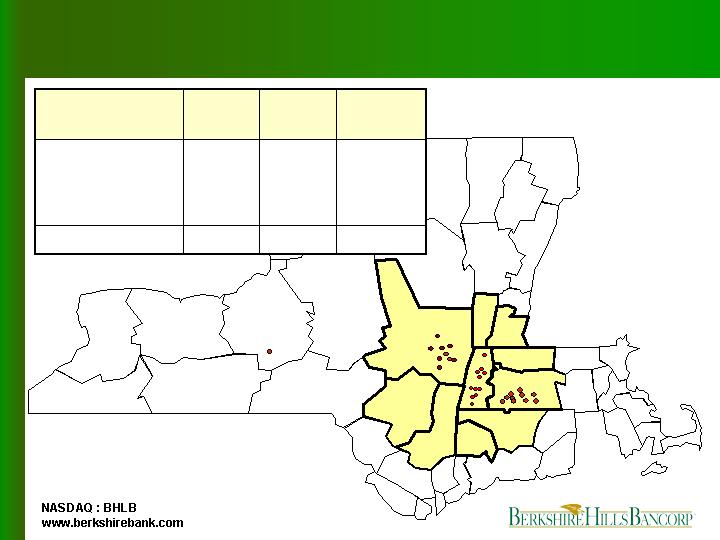
Branches
27
11
10
6
12/31/06
31
11
10
10
12/31/07
Proforma
24
Total
11
Berkshire County
10
3
12/31/05
Pioneer Valley
New York
Market
14
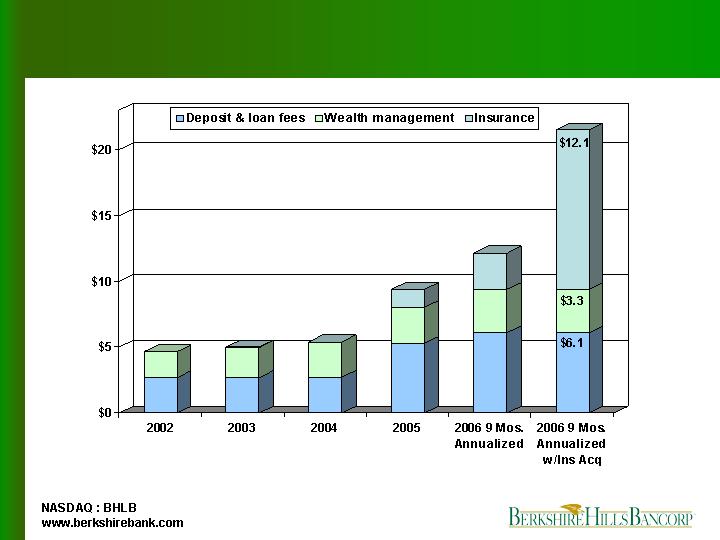
Fee Income
($ Millions)
*Note: Pro forma is 9 months 2006 annualized plus pro forma
annualized revenues from insurance agencies acquired in 10/06
$21.5
15

Insurance Acquisition
Berkshire Insurance Group, Inc.
$70 million annual premium volume
$12 million annual revenues
10 locations
100 employees
15% projected return on equity within
2 years
16
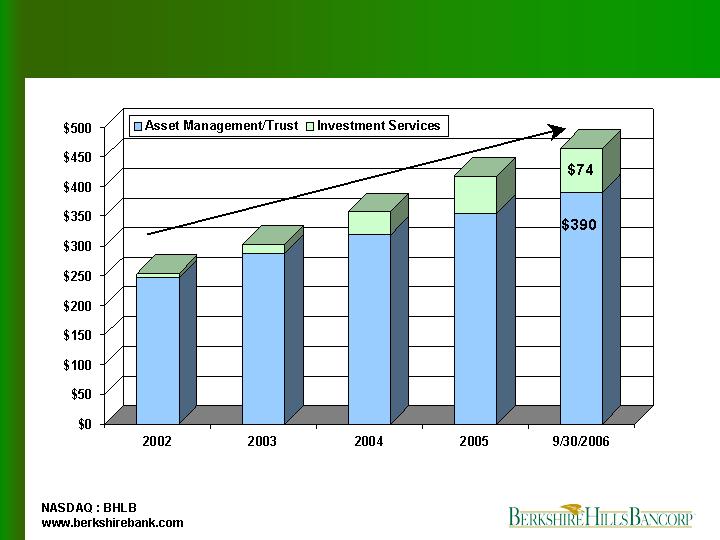
Wealth Management – Assets Under Management
($ Millions)
CAGR = 19%
$464
17

Product Expansion – Current Initiatives
Retail
Private banking
Home equity and mortgage enhancements
Health savings accounts
Remote capture
Commercial
Cash management
SBA lending program
Full follow asset based lending
Commercial real estate conduit
18
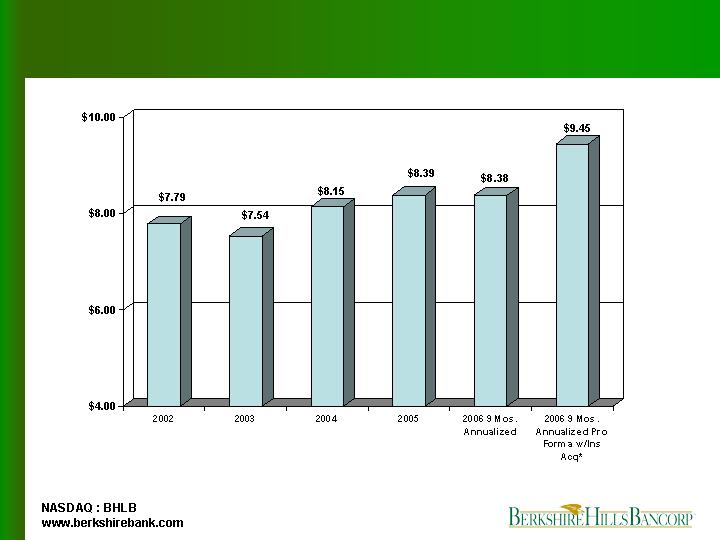
Core Operating Revenue per Share
*Note: Pro forma is 9 months 2006 annualized plus pro forma
annualized revenues from insurance agencies acquired in 10/06
19
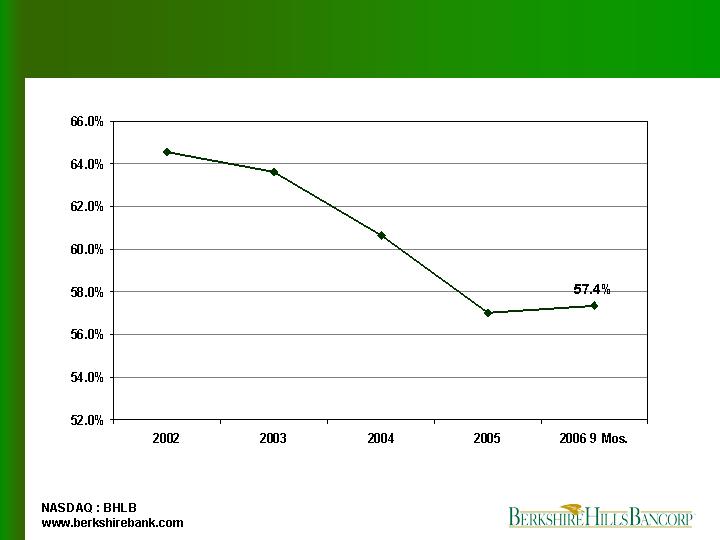
Efficiency Ratio
20
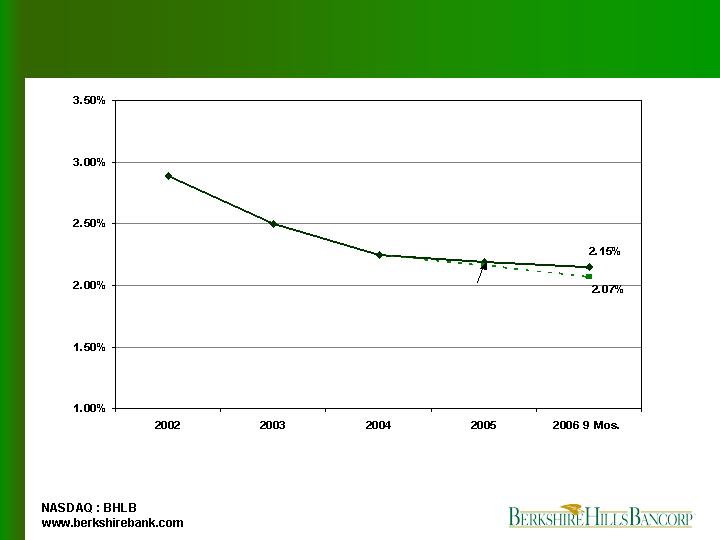
Core Non-interest Expense/Average Assets
Excluding de novo branch costs
*Note: Exclusive of merger and conversion expenses, other non-recurring items and amortization of intangible
assets. Costs of new branches were $1.28 million in the first nine months of 2006.
21
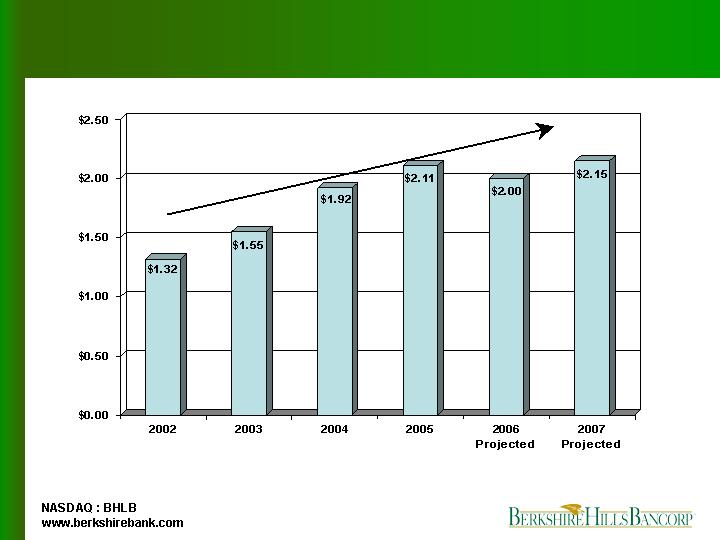
Core Earnings per Share
CAGR = 10%
*Note: Projections based on midpoint of December 2006 guidance.
22

Our Goals
Create nationally recognized brand and business style
Expand strong, high quality franchise through motivated
teamwork and relationship building
Take market share as a regional bank from national and
community competitors
Continue to generate strong top line growth from organic, de
novo, acquisition and product expansion
Achieve high performance profitability metrics
Produce attractive earnings growth and shareholder return
23

For questions, please contact:
David Gonci, Corporate Finance Officer
(413) 281-1973
dgonci@berkshirebank.com
NASDAQ : BHLB
www.berkshirebank.com
24

Appendix
25

Key Measures
11.55
12.09
10.06
10.11
Equity/Assets %
Please see next slide for reconciliation of non-GAAP financial measures
7.41
7.56
9.55
9.35
Tangible equity/Assets %
57.35
57.03
60.66
63.64
Efficiency ratio %
3.22
3.33
3.37
3.61
Net interest margin (FTE) %
3.83
4.19
9.06
7.28
ROE %
12.26
12.30
9.36
7.97
Core tangible ROE %
0.47
0.95
2006
9 Mos.
0.47
0.89
0.80
ROA %
0.98
0.87
0.81
Core tangible ROA %
2005
2004
2003
26

Nine
(Dollars in thousands, except share data)
At and for the years ended December 31,
Months
2002
2003
2004
2005
2006
Net income
(A)
2,097
$
8,965
$
11,509
$
8,226
$
7,161
$
Less: Gain on sale of securities, net
(15,143)
(3,077)
(1,402)
(3,532)
4,054
Plus: Termination of ESOP
10,702
-
-
8,836
(576)
Plus: Merger and conversion expense
-
-
-
2,142
-
Plus: Sale of sub-prime auto loans
-
1,854
-
-
5,512
Plus: Other, net
9,155
754
653
385
Adj: Income taxes
962
360
261
133
(3,195)
Core income
(A1)
7,773
8,856
11,021
15,805
13,341
Plus: Amortization of intangible assets (net of taxes)
132
132
64
741
961
Tangible core income
(B)
7,905
$
8,988
$
11,085
$
16,546
$
14,302
$
Total non-interest income
6,427
$
6,448
$
7,764
$
14,923
$
6,217
$
Less: Gain on sale of securities, net
(15,143)
(3,077)
(1,402)
(3,532)
4,054
Plus: Other
13,704
2,060
-
-
Core non-interest income
(C)
4,988
5,431
6,362
11,391
10,271
Net interest income
40,700
37,566
40,357
51,617
44,669
Total core operating income
(C1)
45,688
$
42,997
$
46,719
$
63,008
$
54,940
$
Total non-interest expense
37,279
$
28,243
$
28,977
$
48,998
$
34,216
$
Less: Termination of ESOP
-
-
-
(8,836)
-
Less: Merger and conversion expense
-
-
-
(2,142)
Less: Other
(6,900)
(408)
-
-
(385)
Core non-interest expense
(D1)
30,379
27,835
28,977
38,020
33,831
Less: Amortization of intangible assets
(203)
(203)
(98)
(1,140)
(1,434)
Total core tangible non-interest expense
(D2)
30,176
$
27,632
$
28,879
$
36,880
$
32,397
$
Total average assets
(E)
1,051,800
$
1,115,800
$
1,289,500
$
1,745,200
$
2,105,000
$
Less: Average intangible assets
(10,300)
(10,300)
(8,700)
(62,000)
(99,000)
Total average tangible assets
(F)
1,041,500
$
1,105,500
$
1,280,800
$
1,683,200
$
2,006,000
$
Total average stockholders' equity
(G)
136,200
$
123,100
$
127,100
$
196,500
$
254,000
$
Less: Average intangible assets
(10,300)
(10,300)
(8,700)
(62,000)
(99,000)
Total average tangible stockholders' equity
(H)
125,900
$
112,800
$
118,400
$
134,500
$
155,000
$
Core return on tangible assets
(B/F)
0.76
%
0.81
%
0.87
%
0.98
%
0.95
%
Core return on tangible equity
(B/H)
6.28
7.97
9.36
12.30
12.26
Efficiency ratio
64.55
63.64
60.66
57.03
57.35
Total average diluted shares (in thousands)
(I)
5,867
5,703
5,731
7,503
8,776
Net income per diluted share
(A/I)
$0.36
$1.57
$2.01
$1.10
$0.82
Core income per diluted share
(A1/I)
$1.32
$1.55
$1.92
$2.11
$1.52
Efficiency Ratio is computed by dividing total tangible core non-interest expense by the sum of total net interest income on a fully taxable equivalent basis and
total core non-interest income. The Company uses this common non-GAAP measure to provide important information regarding its operational efficiency.
BERKSHIRE HILLS BANCORP, INC. AND SUBSIDIARIES
RECONCILIATION OF NON-GAAP FINANCIAL MEASURES
27