EXHIBIT 99.1

Our Growing Franchise
$2.5 billion in assets
38 bank branches and
10 insurance offices
Three-state franchise –
Massachusetts, New York,
and Vermont
Only locally headquartered
financial services company in
primary market
$800 million in assets
under management
Insurance agency with
almost 100 professionals
Strong growth from organic,
de novo, and acquisition
strategy
Distinctive culture as
America’s Most Exciting
BankSM
Expanded executive team
Attractive, stable markets
Diversified revenues with
strong commercial
components
31.78
31.15
29.63
Total book value
14.36
13.76
15.70
Tangible book value
0.31
0.58
0.56
Dividends paid
1.13
1.44
1.29
Net earnings, diluted
$1.13
$1.90
$2.00
Core earnings, diluted
Per Share Data
1.14
1.14
1.14
Loan loss allowance/total loans
0.42
0.45
0.35
Non-performing assets/total assets
0.15%
0.34%
0.07%
Net charge-offs/average loans
Asset Quality
60.60
62.94
58.46
Efficiency ratio
3.43
3.26
3.24
Net interest margin
0.94
0.60
0.53
GAAP return on assets
7.10
4.69
4.40
GAAP return on equity
0.94
0.79
0.83
Core return on assets
7.10%
6.17%
6.87%
Core return on equity
Performance
2,546.9
2,513.4
2,149.6
Total assets
11.8
13.5
11.3
Net income
13.9
20.8
19.6
Operating cash earnings
$54.9
$88.6
$72.3
Revenue
6 Mo
2008
FY 2007
FY 2006
Results (in millions)
Financial Highlights
Network of 48 stores
38 Banking
10 Insurance
Note: See last page for reconciliation of non-GAAP data. 2007 net
charge-offs/average loans measured 0.11% before one charge related to
2006 borrower fraud.
See last page
Investor contacts:
$279 Million
Market capitalization
44,000
Average share trading volume
8%
Insider ownership
56%
Institutional ownership
10.4 Million
Common shares outstanding
$0.16
Current quarterly dividend
$33.00 - $19.50
52 Week Price Range:
BHLB
Stock Information
Note: Data as of 07/22/08
Kevin P. Riley
EVP and CFO
Phone: (413) 236-3195
Email: kriley@berkshirebank.com
P.O. Box 1308, Pittsfield, MA 01202-1308
David H. Gonci
Corporate Finance Officer
Phone: (413) 281-1973
Email: dgonci@berkshirebank.com
Shepard D. Rainie
EVP and Chief Risk Officer
Phone: (413) 236-3176
Email: srainie@berkshirebank.com
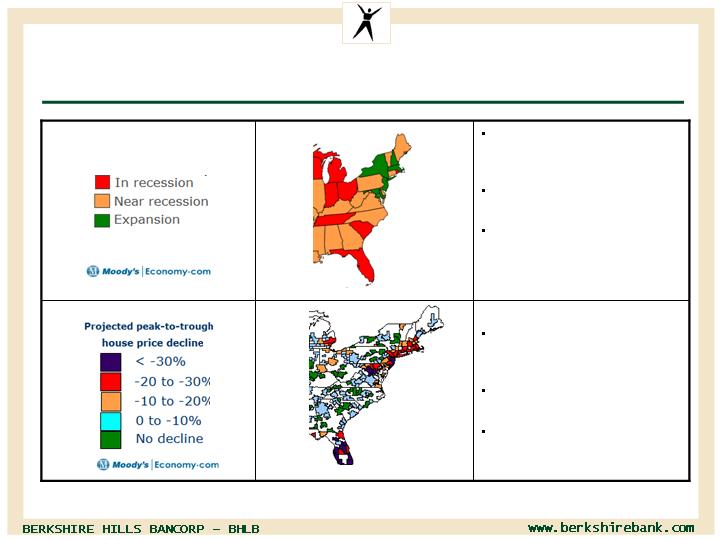
Attractive Markets – MA, NY, VT
Residential property values
more stable in Western MA
Foreclosures remain low
Albany prices – no decline
(As of May 2008)
HOUSE PRICES
Berkshire markets still
expanding
Low unemployment
IBM announces $1.5 billion
New York Tech Valley
investment (July 2008)
(As of May 2008)
ECONOMIES
Slide 2
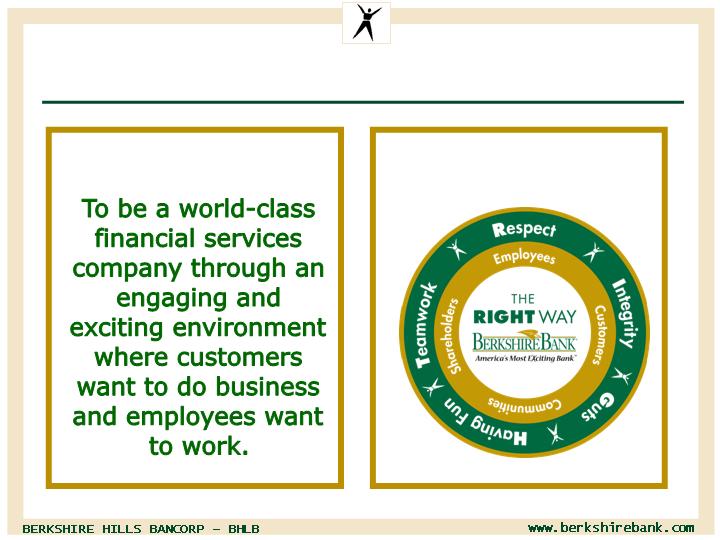
Building a Distinctive Culture
Our Vision
Core Values
Slide 3

Creating Value
Veteran management team
Diverse revenue sources
Performance driven
Differentiated brand and culture
Leader in core markets
Opportunity for growth in new markets
Slide 4

Solid First Half 2008 Results
64.34%
60.60%
Efficiency ratio
22.49%
31.21%
Fee Income/Revenues
3.42%
3.43%
Net Interest Margin
7.44%
7.10%
Return on Equity
0.71%
0.94%
Return on Assets
(12%)
6%
Change in EPS (year-to-year)
SNL Bank and Thrift
Median
(as of 7/23/08)
BHLB
Performance Measure
Slide 5

2008 Plan for Earnings Growth
EPS of $2.16 – 14% growth from core 2007
Record earnings of $22.4 million – 26% growth from core
2007
Higher net interest margin – from liability sensitive to
neutral/asset sensitive
Modest loan growth – low single digit
Fee income at 30% of revenue – emphasis on wealth
management and insurance
Efficiency ratio of 61%
Slide 6
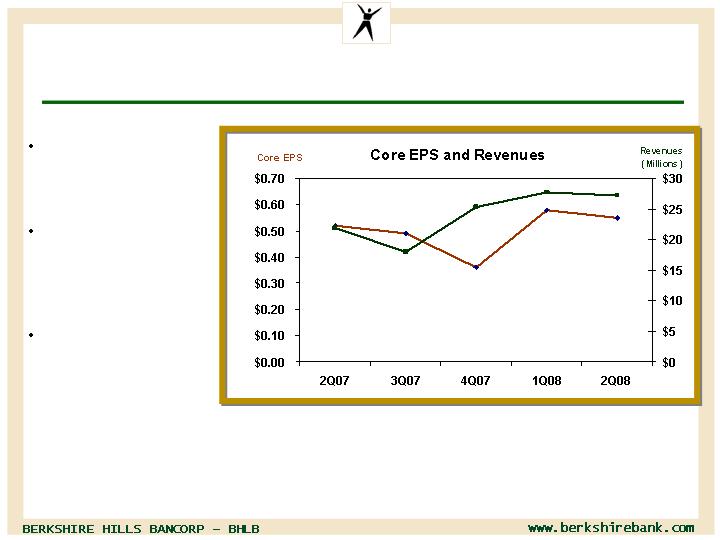
Record Revenues and Earnings per Share in 2008
Revenue growth
from acquisitions
and organic growth
2008 core EPS up
6% benefiting from
higher margins and
efficiencies
Pre-provision core
EPS up 15% in Q2
2008
Note: Core and GAAP EPS the same in last five quarters except for 3Q07 (core $0.49 and GAAP $0.10) and 4Q07 (core $0.36
and GAAP $0.29). Difference in 3Q07 was due to balance sheet restructuring and Factory Point merger integration costs.
Difference in 4Q07 was due to merger integration and other nonrecurring expense restructuring costs.
Revenue
Core EPS
.55
27.2
Slide 7
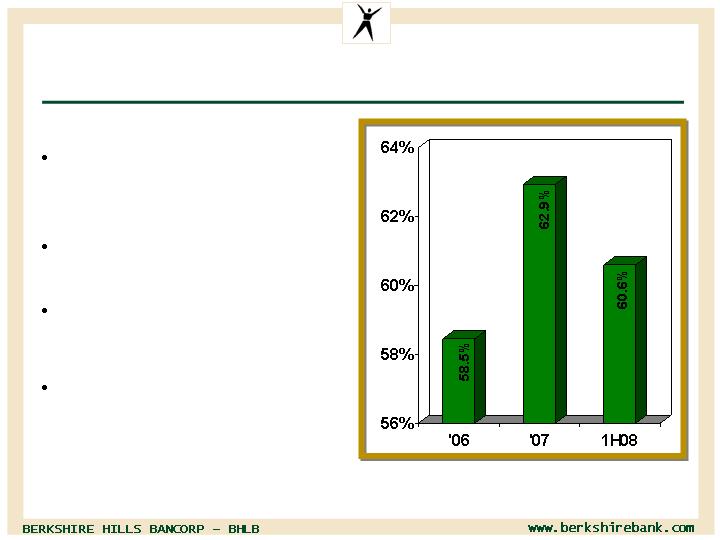
Efficiency Ratio Now Improving
Spike in 2007 from
insurance acquisition and
de novo branches
Bank ratio 58 – 60%
excluding insurance
Benefiting from higher
margins, growth, and
expense control
Insurance ratio 66% due to
different revenue/cost mix
Note: Efficiency ratio is computed by dividing total tangible core non-interest expense by the sum of total net
interest income on a fully taxable equivalent basis and total core non-interest income.
Slide 8
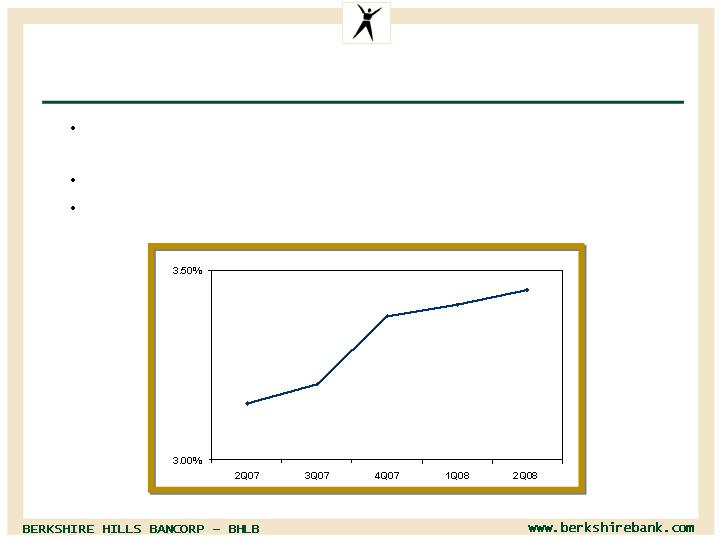
Net Interest Margin Highest Since 2003
Benefited from Factory Point acquisition and balance sheet
restructuring in Q3 2007
Utilizing interest rate swaps to manage interest rate risk
Diligent pricing on deposit and loan products
3.45%
Slide 9
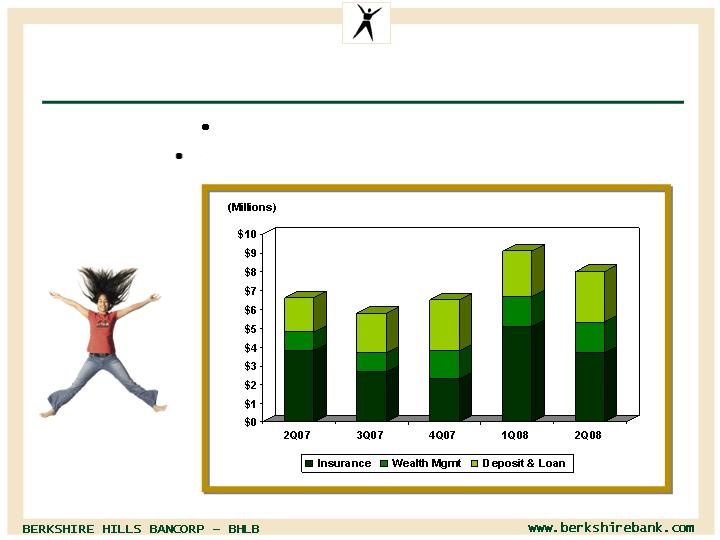
Fee Income Growing Strongly
Fees provide 30% of revenue
Fee growth of 20% estimated for 2008
Slide 10
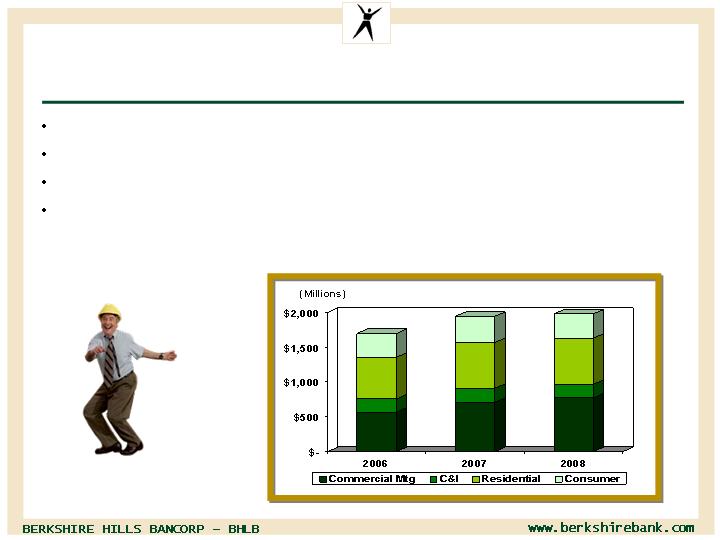
Loan Mix Managed for Quality Growth
Higher growth in commercial real estate, and commercial & industrial
Indirect lending running off
Residential and home equity focus on retail side
Strong credit disciplines
347
665
198
768
1,978
Slide 11

Favorable Deposit Growth
Strong growth in checking accounts
Growing deposit base in New York and Pioneer Valley
Personal core deposit growth offsetting high cost
municipal run-off
418
676
717
1,811
Slide 12
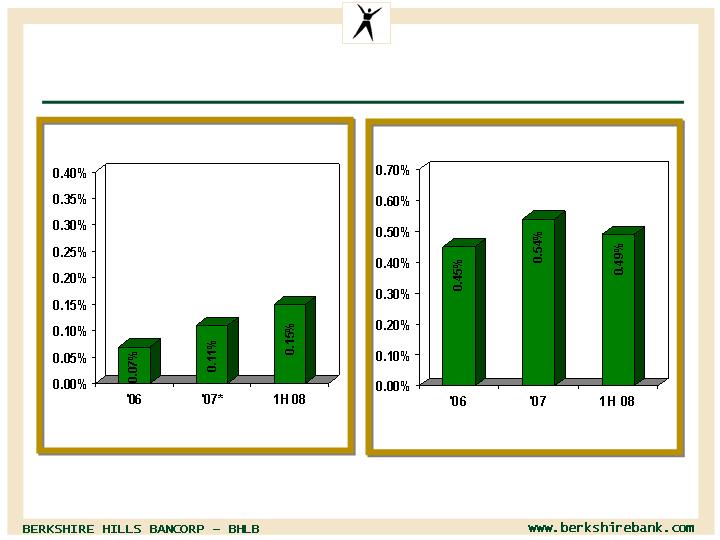
Solid Credit Quality
* Excludes $4 million (0.23%) charge
for one fraud related commercial loan
Nonperforming Loans to Total Loans
Net Charge-offs to Average Loans
Annualized
Slide 13
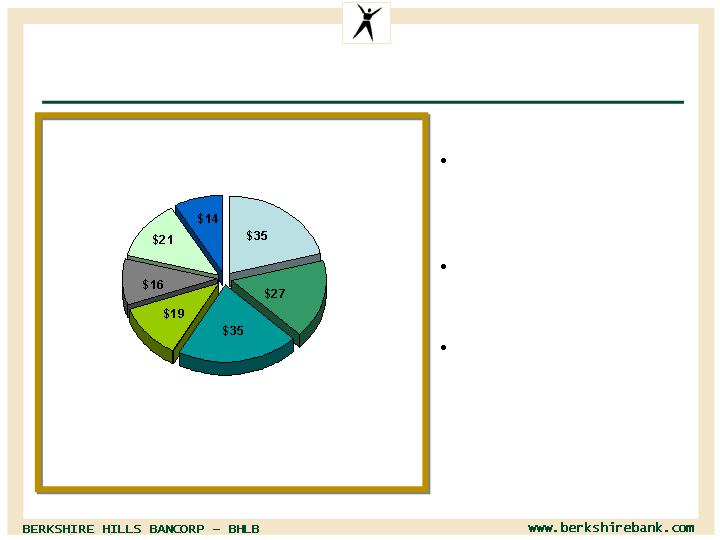
Diversified Construction and Development Loans
$132 million Commercial
C&D portfolio was 7% of
total loans at 6/30/08
No C&D non-accruing at
6/30/08
$35 million Consumer
Construction portfolio to
individuals for single
home construction
as of 6/30/08
(millions)
Other
Consumer
Residential
Builder
Single Family
Condo
Land
Hotel
Office
Slide 14

Seasoned Home Equity Portfolio
$174 million balance at 6/30/08 (9% of total loans)
66% of balance acquired with Woronoco ($86 million in
2005) and Factory Point ($29 million in 2007)
Conforming underwriting, maximum 80% CLTV
No sub prime or Alt A programs
Negligible delinquencies and charge-offs
Residential portfolio also conforming and performing well
Slide 15

Conservative Investment Portfolio
Unrealized loss of 21 basis points on $242 million total 6/30/08
No Government Sponsored Enterprise (GSE) equity securities except
FHLB Boston stock
$14 million corporate debt securities with $1.4 million unrealized loss
(includes $9 million trust preferred)
$3 million corporate equity securities with $0.1 million unrealized
gain
$108 million GSE/Agency MBS portfolio with $1.1 million unrealized
gain
$112 million municipal portfolio with $0.3 million unrealized loss
Slide 16

Solid Capital Footings
Tangible equity at 6.3% of assets at 6/30/08, up from 6.2% at year-end
2007
Core return on tangible equity of 19% in first half of 2008 – strong
tangible capital formation rate
Tangible book value of $14.36 at 6/30/08, growing at 8% annualized rate
in first half of 2008
Stock buybacks on 4.5% of outstanding shares in last three quarters
due to slower growth and surplus capital generation
Note: Equity to assets was 13.0% at 6/30/08 and 12/31/07. Book value per share was $31.78 and $31.15 at those dates, respectively.
Measures based on tangible equity are adjusted to subtract goodwill and intangible assets from equity (and from assets where applicable).
Core return on tangible equity is based on operating cash earnings as shown in the reconciliation table on the last page.
Slide 17
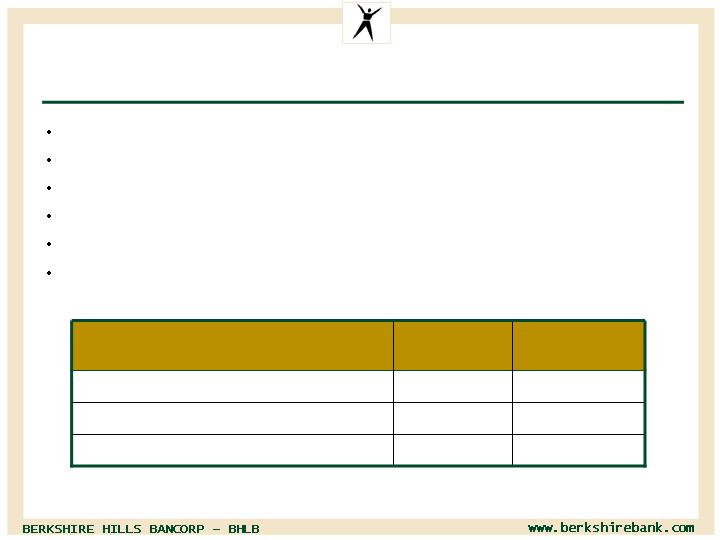
Why Invest in Berkshire Hills
Strong and experienced management team
Distinctive culture and core values
Strong credit culture and asset quality discipline
Above average growth in loans, deposits and fee income
Earnings performance at record levels and growing
Stock valuation metrics are attractive for long term return
260%
180%
Price/Tangible book
140%
80%
Price/Book
15.4X
12.0X
Price/EPS (BHLB 2008 est EPS; SNL trailing EPS)
SNL Bank
and Thrift
Berkshire
as of 7/22/08 ($25.99 BHLB Close)
(data rounded)
Slide 18

FOR QUESTIONS, PLEASE CONTACT:
David Gonci, Corporate Finance Officer
413-281-1973 - dgonci@berkshirebank.com
Ann-Marie Racine, Investor Relations Contact
413-236-3239 - aracine@berkshirebank.com
Forward Looking Statements
This presentation contains forward-looking statements (within the meaning of the Private Securities Litigation Reform
Act of 1995) which involve significant risks and uncertainties. Actual results may differ materially from the results
discussed in these forward-looking statements, including factors discussed in “Forward-Looking Statements” in the
Company’s 2007 Annual Report on Form 10-K and Quarterly Reports on Form 10-Q, which are available at the
Securities and Exchange Commission’s internet website (www.sec.gov) and to which reference is hereby made.
Except as required by law, the Company assumes no obligation to update any forward-looking statements, and undue
reliance should not be placed on these statements.
$14.36
$13.76
$15.70
Tangible book value per share (G/H)
10,385
10,493
8,713
Period end shares outstanding (thousands) (H)
149,131
144,385
136,820
Tangible stockholders’ equity (G)
(180,905)
(182,452)
(121,341)
Less: Goodwill and intangible assets
$330,036
$326,837
$258,161
Stockholders’ equity (period end)
0.94%
0.79%
0.83%
Average core return on assets (B/F)
$2,511
$2,262
$2,116
Average assets (millions) (F)
7.10%
6.17%
6.87%
Average core return on equity (B/E)
$331,400
$288,000
$255,700
Average stockholder’s equity (E)
$1.13
$1.90
$2.00
Core earnings per share (B/D)
10,420
9,370
8,726
Average diluted shares (thousands) (D)
13,873
20,819
19,592
Operating cash earnings (C)
2,103
3,058
2,035
Adj: Amort. intangible assets
11,770
17,761
17,557
Core Income (B)
(701)
(2,492)
(3,252)
Adj: Income taxes
683
2,956
904
Adj: All other non-core items
-
-
5,512
Adj: Loan loss allowance pool adjustment expense
26
3,762
3,130
Adj: Loss on securities, loans and borrowings
$11,762
$13,535
$11,263
Net Income (A)
6 Mo. 2008
FY 2007
FY 2006
(Dollars in thousands, except share data)
Note: Management uses non-GAAP financial measures to provide supplemental perspectives. They are not substitutes for GAAP
measures, and do not depict amounts that accrue directly to the benefit of stockholders. We calculate core income and related
measures in order to gauge the underlying earnings power of the Company. We calculate operating cash earnings to measure cash core
earnings (before amortization of intangibles), which we view as the underlying cash generation for the benefit of stockholders. The
efficiency ratio is adjusted for non-core income and expense because non-core items are not generally related to the efficiency of
operations. Average diluted shares for 2006 core income per share totaled 8,786,000.
www.berkshirebank.com
Reconciliation of Non-GAAP Financial Measures