
This presentation contains forward-looking statements (within the meaning of the Private Securities Litigation Reform Act of 1995) which involve significant risks
and uncertainties. Actual results may differ materially from the results discussed in these forward-looking statements, including factors discussed in “Forward-
Looking Statements” in the Company’s 2007 Annual Report on Form 10-K and Quarterly Reports on Form 10-Q, which are available at the Securities and Exchange
Commission’s internet website (www.sec.gov) and to which reference is hereby made. Except as required by law, the Company assumes no obligation to update
any forward-looking statements, and undue reliance should not be placed on these statements.
Forward Looking Statements
November 13, 2008
Sandler O’Neill + Partners
East Coast Financial Conference
Michael P. Daly
President and CEO
Phone: (413) 236-3194
Email: mdaly@berkshirebank.com
P.O. Box 1308, Pittsfield, MA 01202-1308 -- Executive Offices – 66 West Street, Pittsfield, MA 01201
David H. Gonci
Corporate Finance Officer
Phone: (413) 281-1973
Email: dgonci@berkshirebank.com
Kevin P. Riley
EVP and CFO
Phone: (413) 236-3195
Email: kriley@berkshirebank.com
1

Our Growing Regional Franchise
$2.6 billion in assets
48 total stores
38 bank branches
10 insurance offices
Three-state franchise
Massachusetts, New York and Vermont
Largest locally headquartered regional
financial services company in primary market
$800 million in wealth management assets
under management
Insurance agency with 100 professionals
Strong growth from organic, de novo and acquisition strategies
Distinctive culture as America’s Most Exciting Bank SM
2

Experienced Management Team
20
30
9
34
27
22
26
Total
Years of Experience
Health Care
Telecommunications
3
President, Berkshire
Insurance Group
John Millet
Bank of Boston
14
SVP, Wealth Management
Thomas Barney
Bank of America
2
SVP, Retail Banking
Sean Gray
Bank of America
2
EVP, Chief Risk Officer
Shepard Rainie
TD Banknorth
2
EVP, Commercial Banking
Michael Oleksak
KeyBank
1
EVP and CFO
Kevin Riley
Bank of Boston
22
President and CEO
Michael Daly
Former Vice-Chairman of General Electric
and retired CEO of Honeywell; Former
board member of JPMorgan Chase
Non-Executive Chairman of
the Board since 2002
Lawrence Bossidy
Background
BHLB
Title
Name
3

Delivering a Superior Customer Experience
Execution
Six Sigma
Productivity
Profitability
Our Brand
Promise
4

Building a Distinctive Culture
Our Vision
To be a world class
financial services
company through an
engaging and
exciting environment
where customers
want to do business
and employees want
to work.
Core Values
5
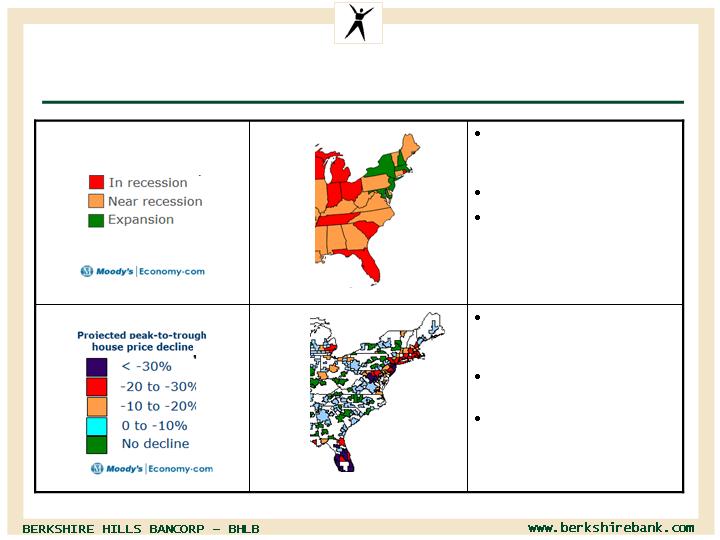
Attractive Markets – MA, NY, VT
Residential property
values more stable in
Western MA
Foreclosures remain
low
Albany prices –
continued appreciation
House Prices
Massachusetts
reported 1% economic
growth in September
Low unemployment
IBM and AMD
announce $6 billion
total New York Tech
Valley investments
(Jul/Oct 2008)
Economies
(As of May 2008)
(As of May 2008)
6
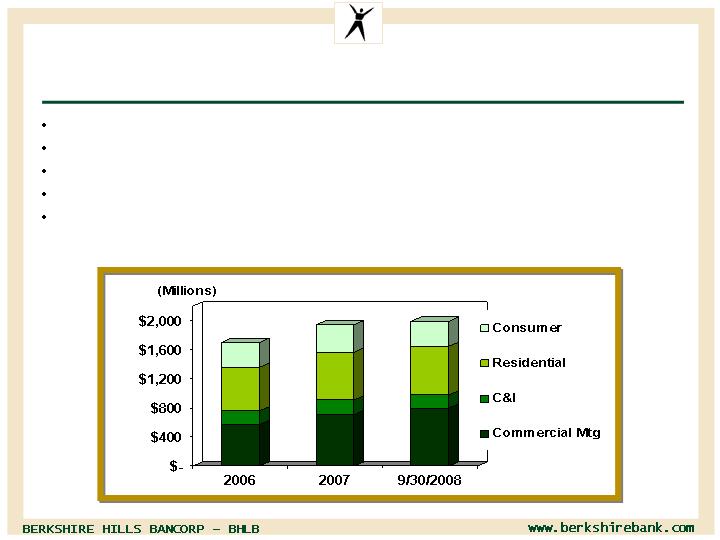
Loan Mix Managed for Quality Growth
5% organic CAGR excluding indirect auto
Higher growth in commercial real estate – 12% organic CAGR
Indirect lending running off at 37% annual rate
Residential and home equity focus on retail side
Strong credit disciplines - no high LTV or sub-prime or Alt A loan programs
17%
34%
9%
40%
$1,992
7

Diversified Commercial Loan Portfolio
100%
Total ($976 million as of 9/30/08)
12%
Services – All other
7%
Services – Health, education, religion
15%
Misc. commercial
10%
Retailers
7%
Apartments
9%
Real estate developers
13%
Lodging
27%
Commercial real estate - Rental (office, retail, etc.)
Loans are to relationships in and around our markets
Commercial construction only 7% of total loans
8
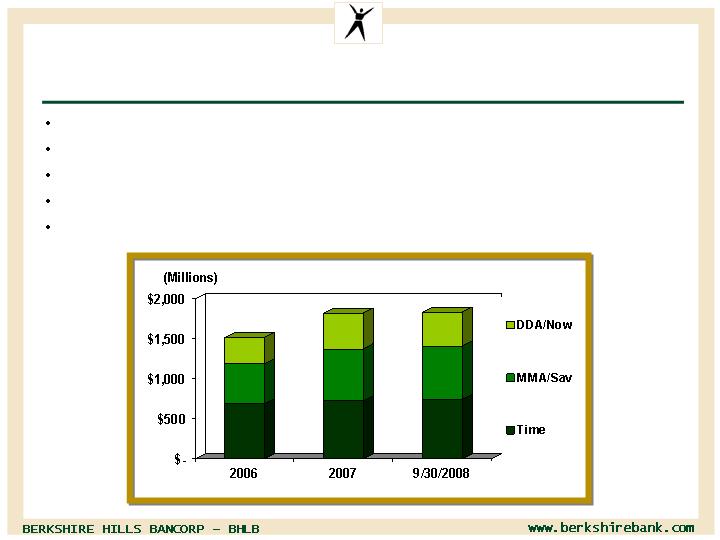
Favorable Deposit Growth
5% core deposit organic CAGR
Strong 28% growth in checking balances including Vermont
Targeted run-off of higher cost municipal and brokered deposits
Growing deposit base in New York and Pioneer Valley
Reduction in deposit costs contributing to higher net interest margin
23%
37%
40%
$1,837
9
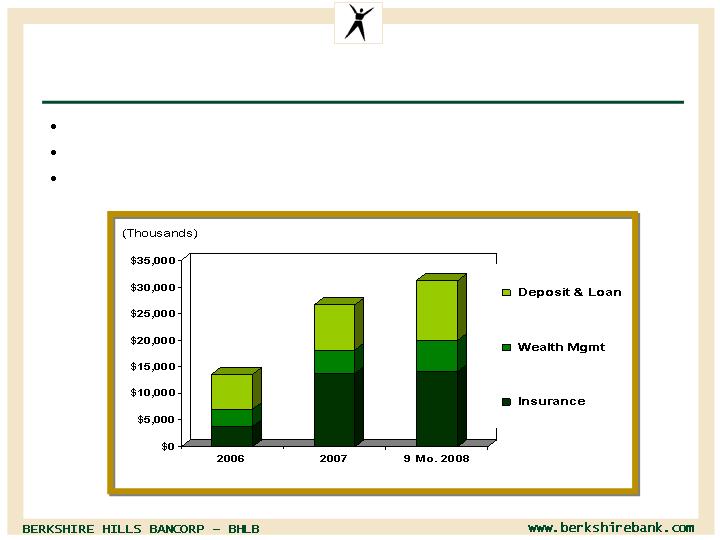
Fee Income Growing Strongly
Fees provide 30% of revenue
Fee growth 20% for 2008 YTD
Insurance and Wealth Management provide 64% of total fees
Annualized
36%
19%
45%
$31,250
10
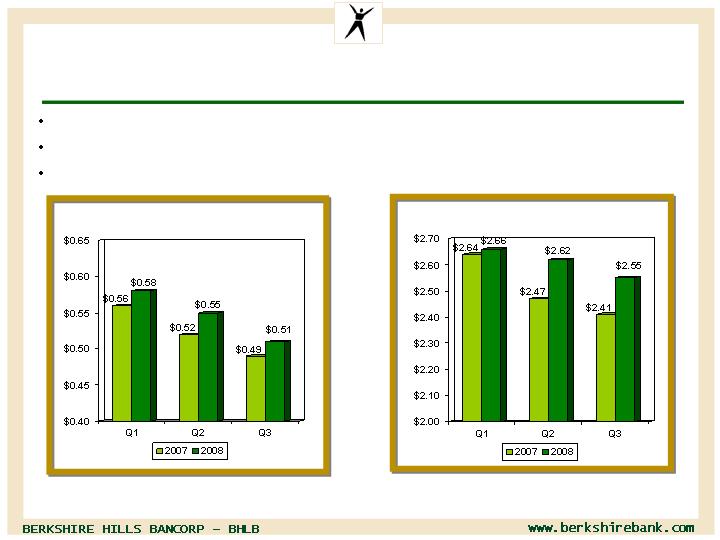
Record Revenues and Earnings per Share in 2008
Core EPS up 4%, pre-provision core EPS up 11%
Revenue growth from acquisitions and organic growth
Seasonal first half revenue and earnings from insurance business
Note: Core and GAAP EPS the same in all quarters except for 3Q07 (core $0.49 and GAAP $0.10) due to balance sheet and expense
restructuring and Factory Point merger integration costs. Core and GAAP revenue per share the same in all periods except for 3Q07 due to
balance sheet restructuring costs.
Core Earnings per Share
Core Revenue Per Share
11

Solid Nine Month 2008 Results
1.13%
0.44%
Non-performing assets / assets
0.31%
0.16%
Net loan charge-offs / loans
67.1%
61.1%
Efficiency ratio
11.3%
29.7%
Fee income / operating revenue
3.43%
3.45%
Net interest margin
6.3%
15.0%
Return on average tangible equity
5.0%
6.8%
Return on average equity
0.54%
0.90%
Return on average assets
(21.6%)
4.5%
Change in core EPS (year-over-year)
SNL Bank &
Thrift Median (1)
BHLB
Performance Measure
(1) Median value for all exchange traded banks and thrifts in SNL Financial’s data universe as of 10/31/08.
Exceeding industry performance on all measures
12

Net Interest Margin Highest Since 2003
Benefited from Factory Point acquisition and balance sheet restructuring in Q3 2007
Favorable shift in deposit composition in recent periods, reducing reliance on time
deposits and boosting transaction accounts acquired through commercial
relationships
Disciplined approach to loan pricing throughout the organization
13
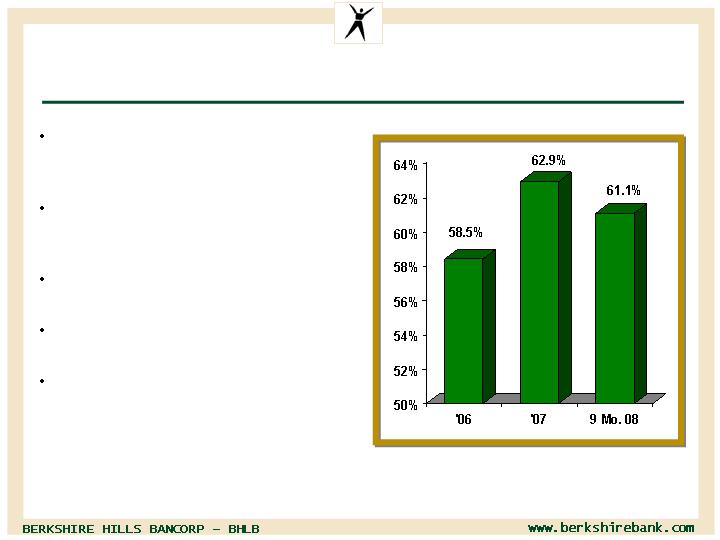
Positive Operating Leverage
and Improved Efficiency Ratio
Change in 2007 due to
insurance acquisition and de
novo branches
Bank ratio 58- 60% excluding
insurance and including 10
de novo branches
Benefiting from higher margins,
growth and expense control
Insurance ratio 67% due to
different revenue/cost mix
Six Sigma process engineering
enhances efficiency,
effectiveness, integration and
scalability
Note: Efficiency ratio is computed by dividing total tangible core non-interest expense by the sum of total net interest
income on a fully taxable equivalent basis and total core non-interest income.
14

Positive Operating Leverage Expected in Q4 2008
+4%
Core non-interest expense
+6%
Core non-interest income
+7%
Net interest income
Six consecutive quarters of net interest income growth
Non-interest income growing despite soft markets in insurance
and wealth management
Bottom line benefiting from maturing of 10 de novo branches
(Change compared to Q4 2007)
15
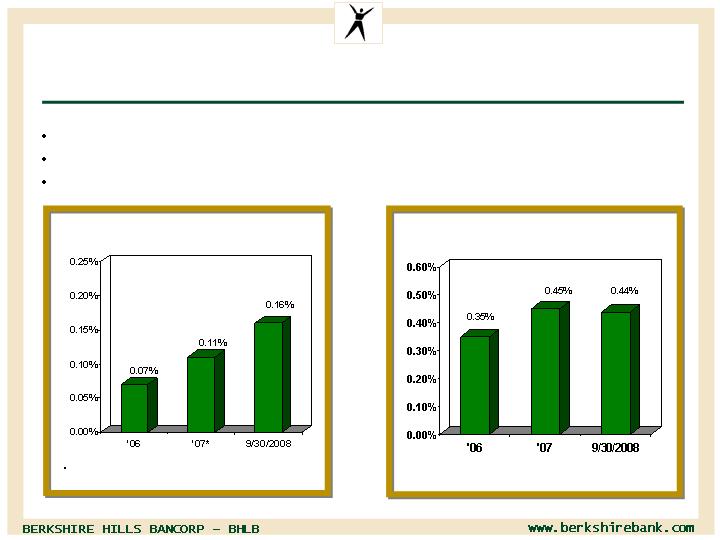
Solid Credit Quality
Excludes $4 million (0.23%) charge for one fraud related
commercial loan
Nonperforming Assets
to Total Assets
Net Charge-offs to Average Loans
Annualized
Total delinquencies only 1.00% of total loans at 9/30/08
Only four loans over $1 million totaling $6.8 million delinquent at 9/30/08
Delinquent and non-performing loan ratios down over last twelve months
16

Consistent Allowance Coverage
231%
1.14%
169%
2Q08
221%
182%
Allowance / Non-performing loans
1.15%
1.14%
Allowance / loans
132%
102%
Provision / charge-offs
3Q08
1Q08
Provision covering charge-offs and loan growth
Allowance increased by $5.5 million (40%) in Q3 2006
17
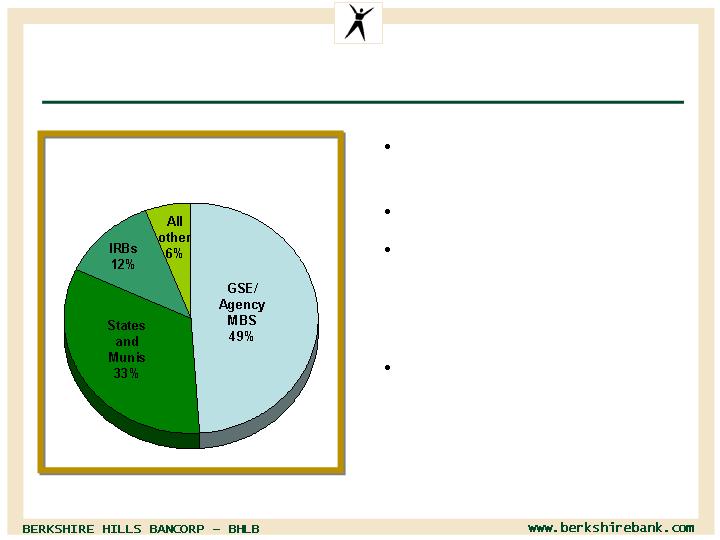
Conservative Investment Portfolio
No Fannie Mae or Freddie
Mac equities
No impairment write-offs
Corporate bonds total $14
million, all performing and
investment grade including
$9 million trust preferreds
Total investment portfolio
unrealized loss $4.2 million
at 09/30/08
Total Portfolio - $247 Million
9/30/08
18

Raising Capital to Support Growth
$232
Pro forma tangible equity
40
Application for TARP CPP
39
Follow-on stock offering w/over-allotment
$153
Tangible equity 09/30/08
(Millions)
Supplementing internal 15% tangible capital generation
Increasing tangible equity/assets to 9.4% pro forma from 6.4%. Goal
to remain above 7% after long term reinvestment
Increase tangible book value per share by 8% to $15.70 from $14.58
Note: GAAP equity increasing from $333 million to $411 million pro forma. GAAP equity/assets increasing to 15.6% from
13.0%. GAAP book value per share decreasing to $30.41from $31.71.
19

Success in M & A and de Novo Expansion
Jun 05
$769 MM in
assets
Extended franchise to
Springfield/Hartford corridor
Pioneer Valley, MA
(Springfield area)
Woronoco Bancorp,
Inc.
2005 to
2007
$158 MM in
Deposits as
of 9/30/08
Extended franchise to Northeast
New York – 10 de novo branches
Capital Region, NY
(Albany area)
De novo expansion
Oct 06
$9 MM in
insurance
revenues
Foundation for Berkshire
Insurance Group
Western MA
5 Western MA
insurance agencies
Sep 07
$339 MM in
assets
Extended franchise to Southern
Vermont
Manchester, VT
Factory Point
Bancorp, Inc
Jan 08
$50 MM
assets under
management
Established wealth management
presence in NY
Albany, NY
The Center for
Financial Planning
Date
Assets/
Value
Strategic Accomplishment
Location
Acquired
Business
Proven acquiror with a track record of successful integration
Successful 10 branch New York de novo investment
20
Favorable Valuation Compared to Peers
Note: Pricing as of 11/03/08. BHLB book value pricing ratios include adjustments for October stock offering.
2008 estimated EPS is from First Call Median EPS estimates
Price /
12.9
171
88
322
2,566
BHLB
Pittsfield, MA
26.88
Berkshire Hills Bancorp, Inc.
15.7
273
159
Peer median
16.0
280
223
474
2,725
TMP
Ithaca, NY
49.00
Tompkins Financial Corporation
12.8
249
159
349
2,768
WASH
Westerly, RI
21.92
Washington Trust Bancorp, Inc.
14.6
267
156
476
3,477
INDB
Rockland, MA
29.26
Independent Bank Corp.
17.1
340
159
833
4,767
CBU
De Witt, NY
25.53
Community Bank System, Inc.
15.5
320
215
905
5,335
NBTB
Norwich, NY
27.83
NBT Bancorp Inc.
19.3
267
118
1,896
9,008
FNFG
Lockport, NY
16.00
First Niagara Financial Group, Inc.
2008
EPS
(%)
TBV
(%)
Book
Value
(%)
Market
Cap.
($mm)
Total
Assets
($mm)
Ticker
City, State
Price
Company
Pricing multiples below peers
21

Why Invest in
Strong and experienced management team
Distinctive culture and core values
Favorable position in attractive markets
Strong credit culture and asset quality discipline
Above average growth in loans, deposits and fee income
Diversified revenues with strong commercial components
Earnings performance at record levels and growing
Performance driven with improving profitability measures
Strategy and track record as a regional consolidator, growing
and diversifying our financial services offerings and pursuing
a leading share in attractive Northeastern markets
Stock valuation metrics are attractive for long term return
22