Exhibit 99.2
| Investor Conference NYSE:BHLB November 29, 2012 Creating Shareholder Value |
| Agenda 11:30 a.m. Registration 12:00 p.m. Lunch 12:45 p.m. Welcome and Presentations by the Chairman of the Board, President and members of Executive Management 3:00 p.m. Reception 11 Wall Street New York, NY Location |
| Forward Looking Statements The information disclosed in this document includes various forward-looking statements that are made in reliance upon the safe harbor provisions of the Private Securities Litigation Reform Act of 1995 with respect to credit quality (including delinquency trends and the allowance for loan and lease losses), corporate objectives, and other financial and business matters. The words "anticipates"; "projects"; "intends"; "estimates"; "expects"; "believes"; "plans"; "may"; "will"; "should"; "could"; and other similar expressions are intended to identify such forward-looking statements are necessarily speculative and speak only as of the date made, and are subject to numerous assumptions, risks, and uncertainties, all of which may change over time. Actual results could differ materially from such forward-looking statements. In addition to the risk factors disclosed elsewhere in this document, the following factors, among others, could cause the Company's actual results to differ materially and adversely from such forward-looking statements: changes in the financial services industry and the U.S. and global capital markets; changes in economic conditions nationally, regionally and in the Company's markets; the nature and timing of actions of the Federal Reserve Board and other regulators; the nature and timing of legislation affecting the financial services industry; changes in the levels of market interest rates; pricing pressures on the loan and deposit products; changes in asset quality and credit risk; inflation; customer borrowing, repayment, investment and deposit practices; customer disintermediation; competitive conditions; the inability to realize cost savings or revenues or to implement integration plans and other consequences associated with mergers, acquisitions and divestitures; customers' acceptance of the Company's products and services; and competition. The above-listed risk factors are not necessarily exhaustive, particularly as to possible future events, and new risk factors may emerge from time to time. You should refer to our periodic and current reports filed with the Securities and Exchange Commission, or "SEC," for further information on other factors, which could cause actual results to be significantly different from those expressed or implied by these forward-looking statements. Certain events may occur that could cause the Company's actual results to be materially different than those described in the Company's periodic filings with the Securities and Exchange Commission. Any statements made by the Company that are not historical facts should be considered to be forward-looking statements. The Company is not obligated to update and does not undertake to update any of its forward-looking statements made herein. Annualized, pro forma, projected and estimated numbers are used for illustrative purpose only, are not forecasts and may not reflect actual results. |
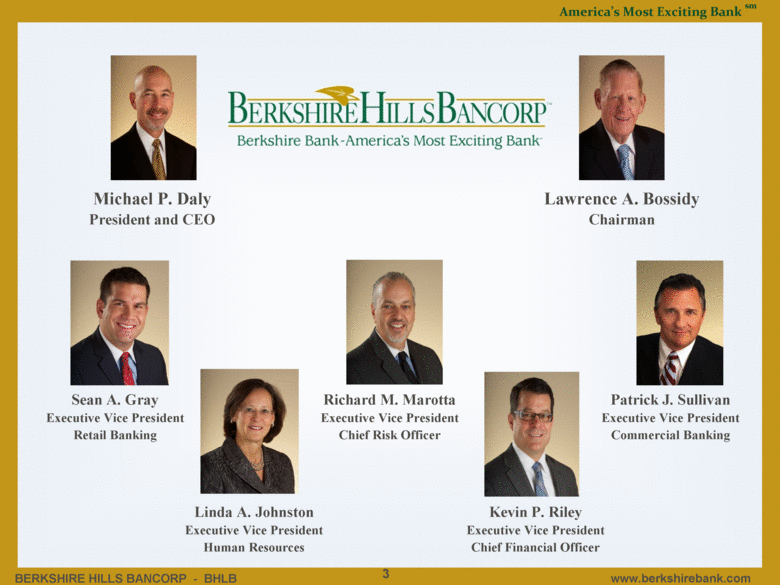
| Lawrence A. Bossidy Chairman Michael P. Daly President and CEO Sean A. Gray Executive Vice President Retail Banking Richard M. Marotta Executive Vice President Chief Risk Officer Kevin P. Riley Executive Vice President Chief Financial Officer Patrick J. Sullivan Executive Vice President Commercial Banking Linda A. Johnston Executive Vice President Human Resources 3 |
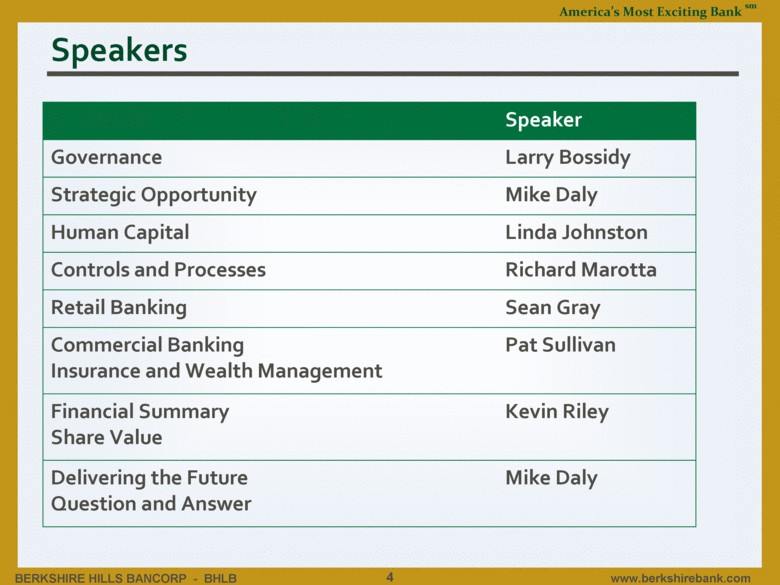
| Speakers Speaker Governance Larry Bossidy Strategic Opportunity Mike Daly Human Capital Linda Johnston Controls and Processes Richard Marotta Retail Banking Sean Gray Commercial Banking Insurance and Wealth Management Pat Sullivan Financial Summary Share Value Kevin Riley Delivering the Future Question and Answer Mike Daly 4 |
| Economy and Governance Lawrence A. Bossidy Chairman |
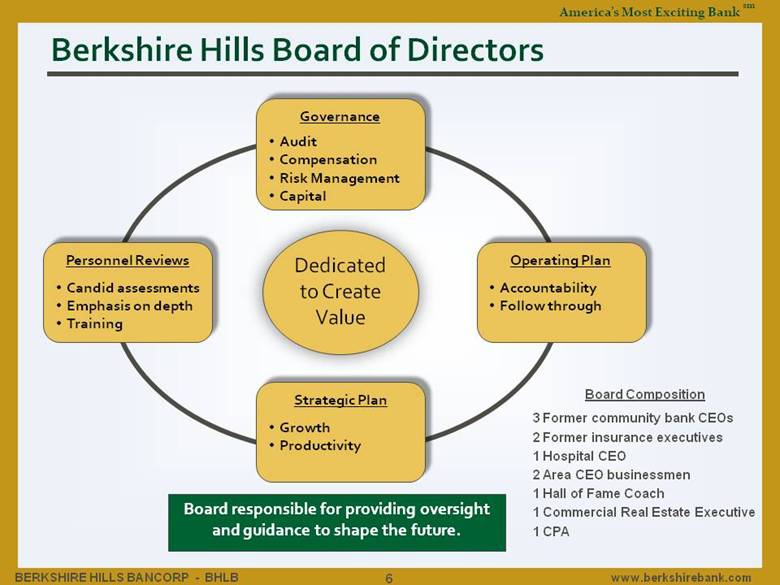
| Berkshire Hills Board of Directors Governance Audit Compensation Risk Management Capital Operating Plan Accountability Follow through Strategic Plan Growth Productivity Personnel Reviews Candid assessments Emphasis on depth Training Dedicated to Create Value Board responsible for providing oversight and guidance to shape the future. Board Composition 3 Former community bank CEOs 2 Former insurance executives 1 Hospital CEO 2 Area CEO businessmen 1 Hall of Fame Coach 1 Commercial Real Estate Executive 1 CPA 6 |
| The Strategic Opportunity Michael P. Daly President and CEO |
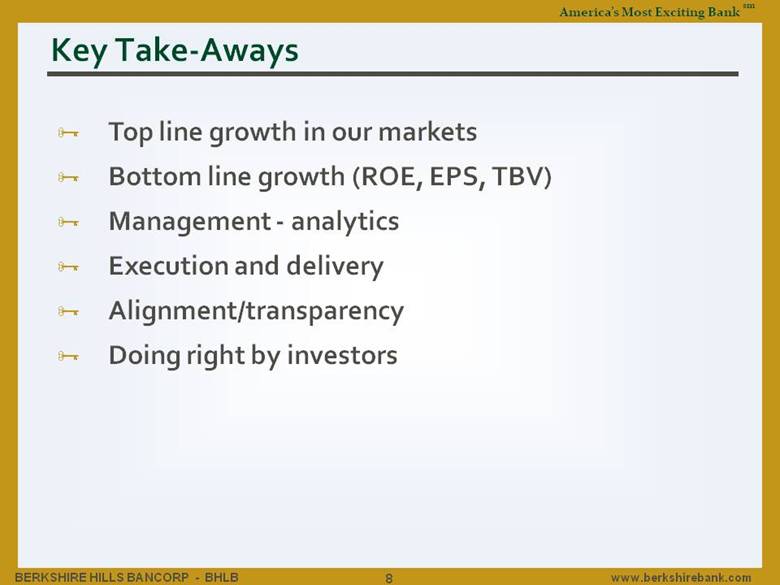
| Key Take-Aways Top line growth in our markets Bottom line growth (ROE, EPS, TBV) Management - analytics Execution and delivery Alignment/transparency Doing right by investors 8 |
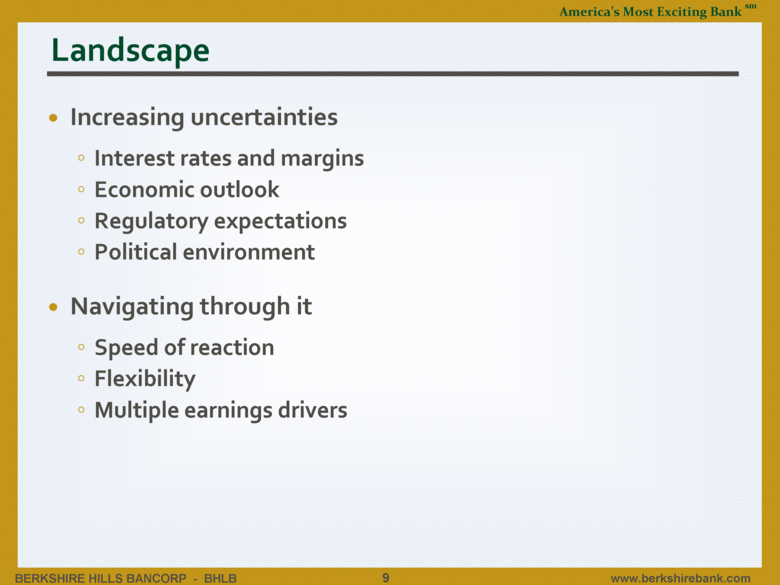
| Landscape Increasing uncertainties Interest rates and margins Economic outlook Regulatory expectations Political environment Navigating through it Speed of reaction Flexibility Multiple earnings drivers 9 |
| BHLB Profile $5.5 billion regional bank Market cap approaching $600 million Strong revenue and earnings growth Quality balance sheet 73 Branches in MA, NY, CT and VT 10 Commercial and residential lending offices in central and eastern MA Retail and commercial banking, insurance and wealth management Experienced, energetic management team Distinctive brand and culture 10 |
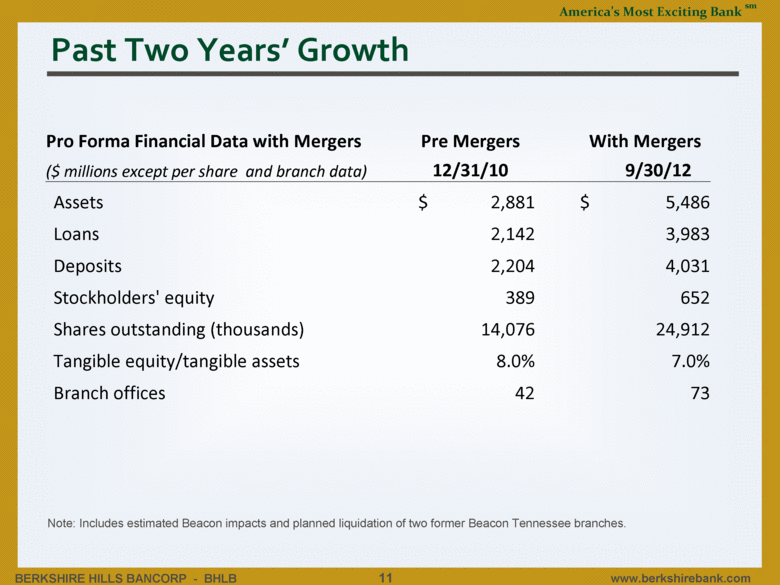
| Past Two Years’ Growth Pro Forma Financial Data with Mergers Pre Mergers With Mergers ($ millions except per share and branch data) 12/31/10 9/30/12 Assets $ 2,881 $ 5,486 Loans 2,142 3,983 Deposits 2,204 4,031 Stockholders' equity 389 652 Shares outstanding (thousands) 14,076 24,912 Tangible equity/tangible assets 8.0% 7.0% Branch offices 42 73 Note: Includes estimated Beacon impacts and planned liquidation of two former Beacon Tennessee branches. 11 |
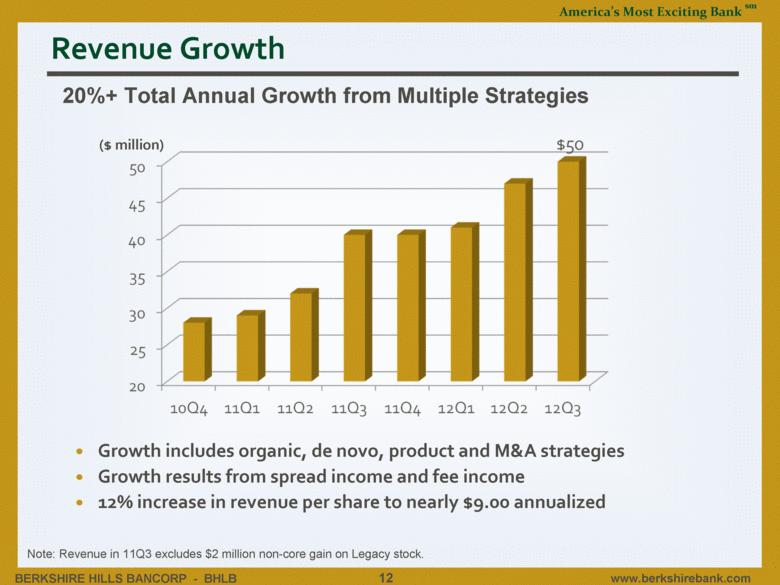
| Revenue Growth 20%+ Total Annual Growth from Multiple Strategies ($ million) Note: Revenue in 11Q3 excludes $2 million non-core gain on Legacy stock. Growth includes organic, de novo, product and M&A strategies Growth results from spread income and fee income 12% increase in revenue per share to nearly $9.00 annualized 12 |
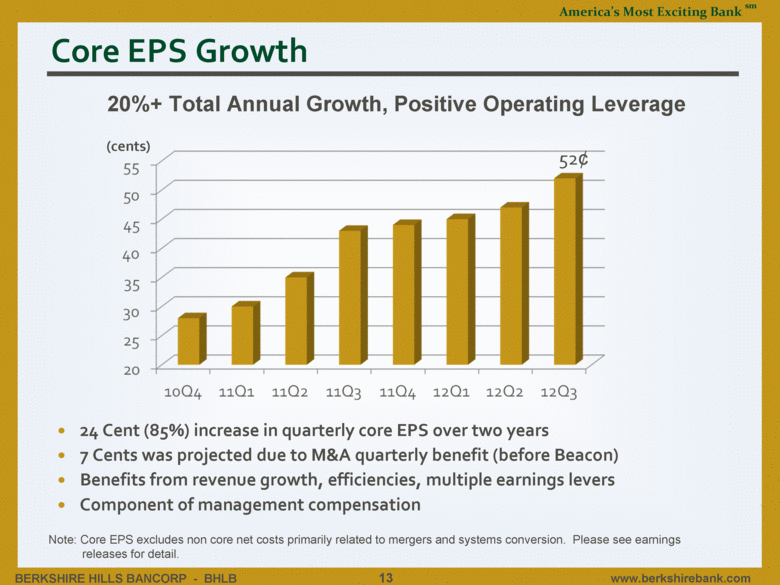
| Core EPS Growth 20%+ Total Annual Growth, Positive Operating Leverage (cents) 52¢ 24 Cent (85%) increase in quarterly core EPS over two years 7 Cents was projected due to M&A quarterly benefit (before Beacon) Benefits from revenue growth, efficiencies, multiple earnings levers Component of management compensation 13 Note: Core EPS excludes non core net costs primarily related to mergers and systems conversion. Please see earnings releases for detail. |
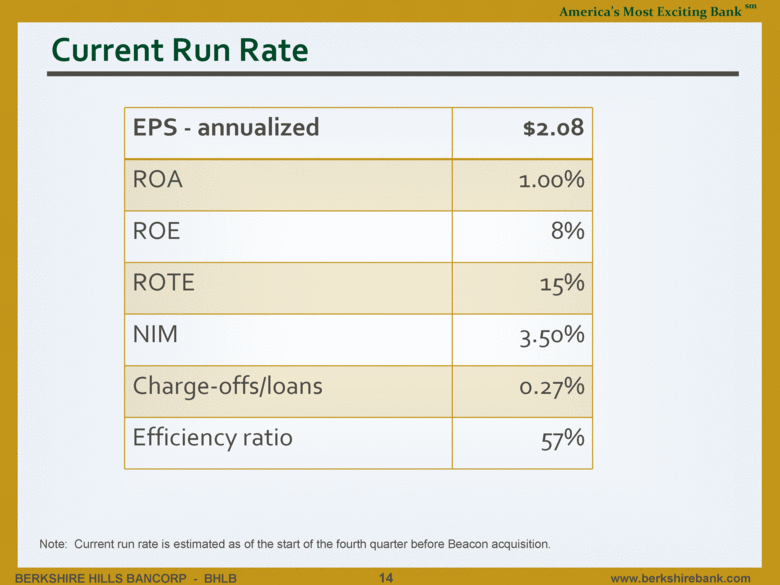
| Current Run Rate Note: Current run rate is estimated as of the start of the fourth quarter before Beacon acquisition. EPS - annualized $2.08 ROA 1.00% ROE 8% ROTE 15% NIM 3.50% Charge-offs/loans 0.27% Efficiency ratio 57% 14 |
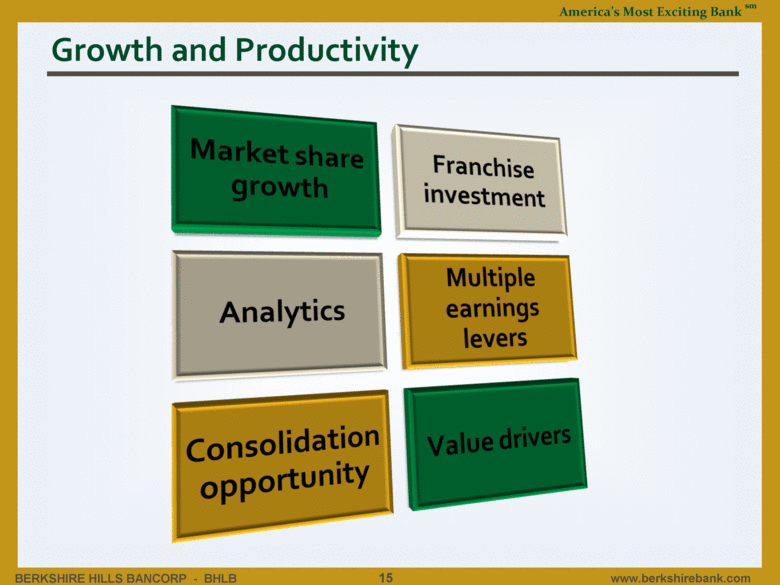
| Growth and Productivity 15 |
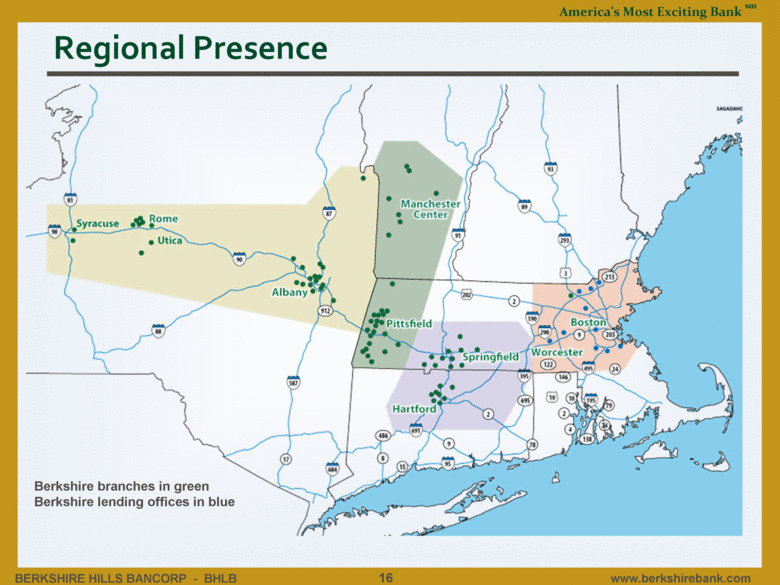
| Regional Presence Berkshire branches in green Berkshire lending offices in blue 16 |
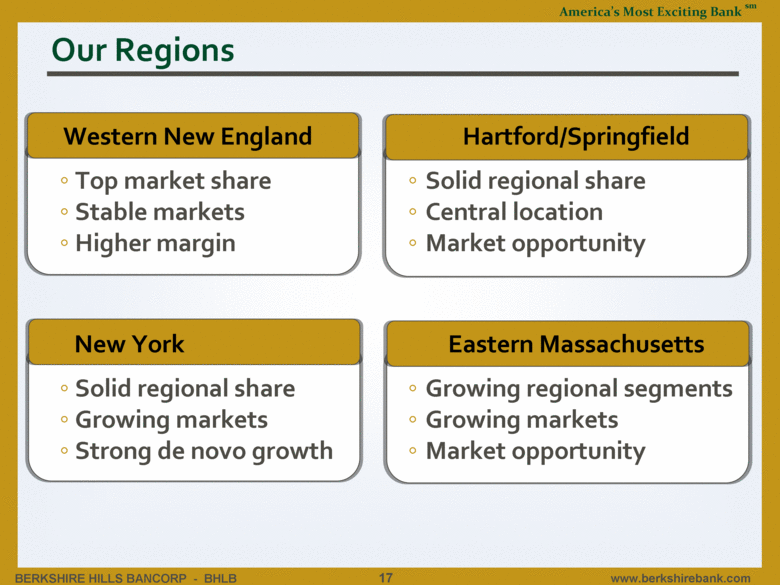
| Our Regions Western New England Top market share Stable markets Higher margin New York Solid regional share Growing markets Strong de novo growth Hartford/Springfield Solid regional share Central location Market opportunity Eastern Massachusetts Growing regional segments Growing markets Market opportunity 17 |
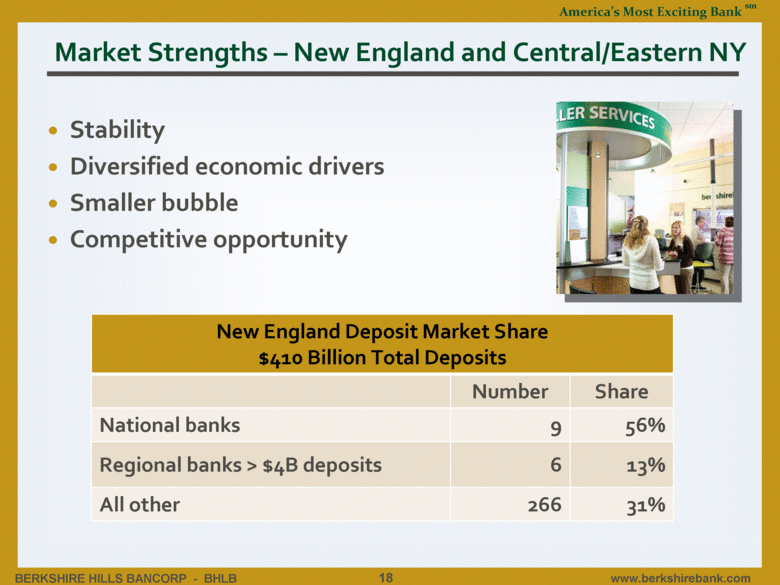
| Market Strengths – New England and Central/Eastern NY Stability Diversified economic drivers Smaller bubble Competitive opportunity New England Deposit Market Share $410 Billion Total Deposits Number Share National banks 9 56% Regional banks > $4B deposits 6 13% All other 266 31% 18 |
| Multiple Earnings Levers – Positive Operating Leverage Revenue Levers Organic volume Multiple business lines Commercial Banking Insurance, Wealth Management Retail Banking Mortgage, Small Business Geography M&A Scalability Data Technology Six Sigma 19 Six Sigma is a registered service mark and trademark of Motorola Inc. |
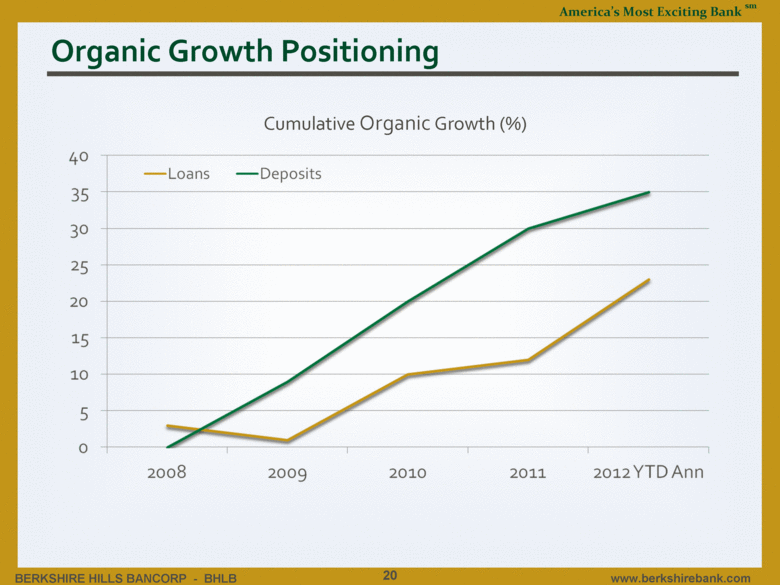
| Organic Growth Positioning 20 Cumulative Organic Growth (%) |
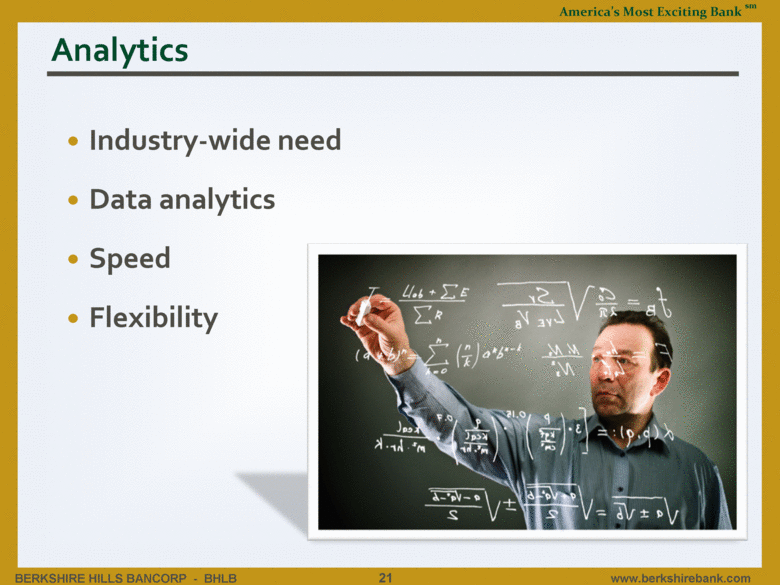
| Analytics Industry-wide need Data analytics Speed Flexibility 21 |
| Franchise Investment Executive and senior leadership Regional headquarters Core systems conversion Project Management Office Most M&A integration complete 22 |
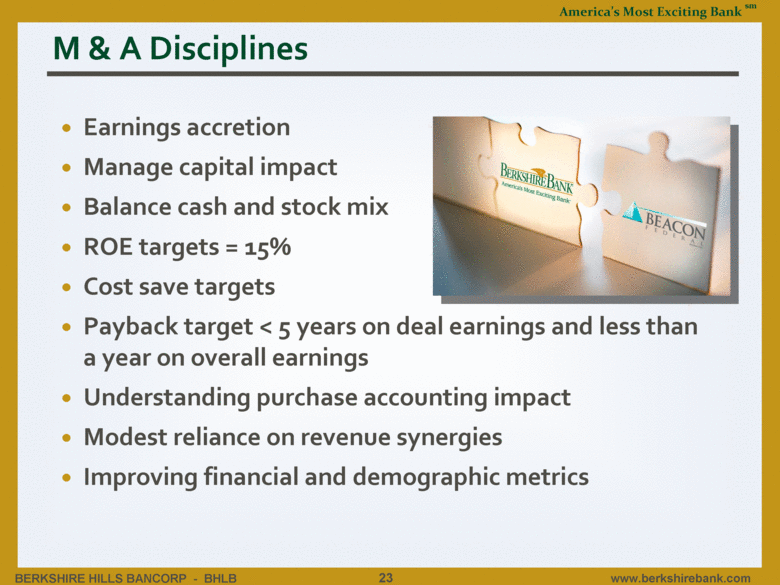
| M & A Disciplines Earnings accretion Manage capital impact Balance cash and stock mix ROE targets = 15% Cost save targets Payback target < 5 years on deal earnings and less than a year on overall earnings Understanding purchase accounting impact Modest reliance on revenue synergies Improving financial and demographic metrics 23 |
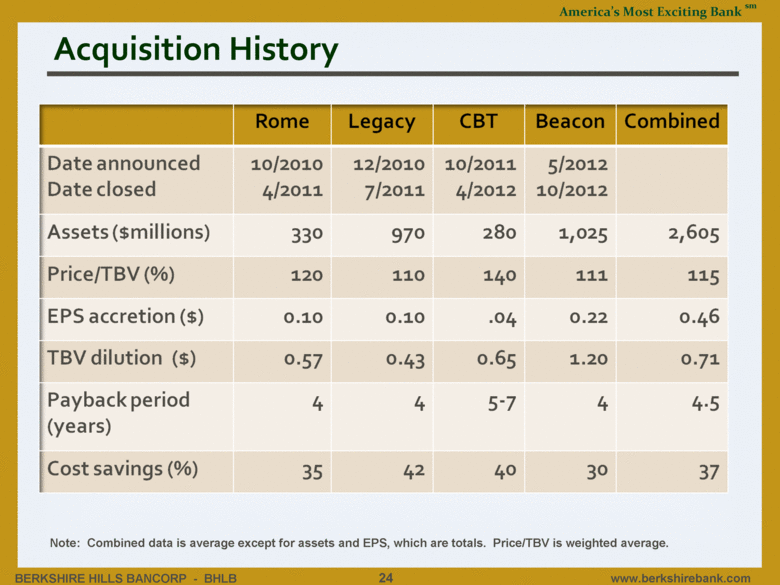
| Acquisition History 24 Note: Combined data is average except for assets and EPS, which are totals. Price/TBV is weighted average. |
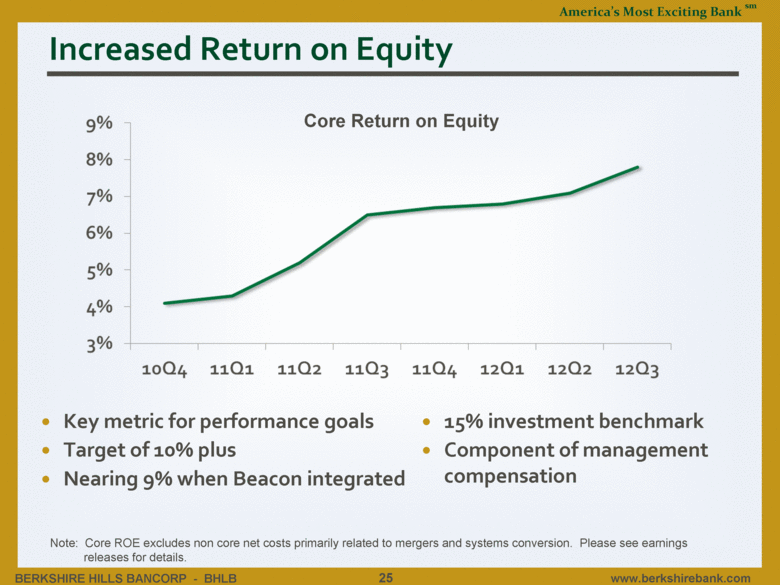
| Increased Return on Equity Core Return on Equity Key metric for performance goals Target of 10% plus Nearing 9% when Beacon integrated 15% investment benchmark Component of management compensation 25 Note: Core ROE excludes non core net costs primarily related to mergers and systems conversion. Please see earnings releases for details. |
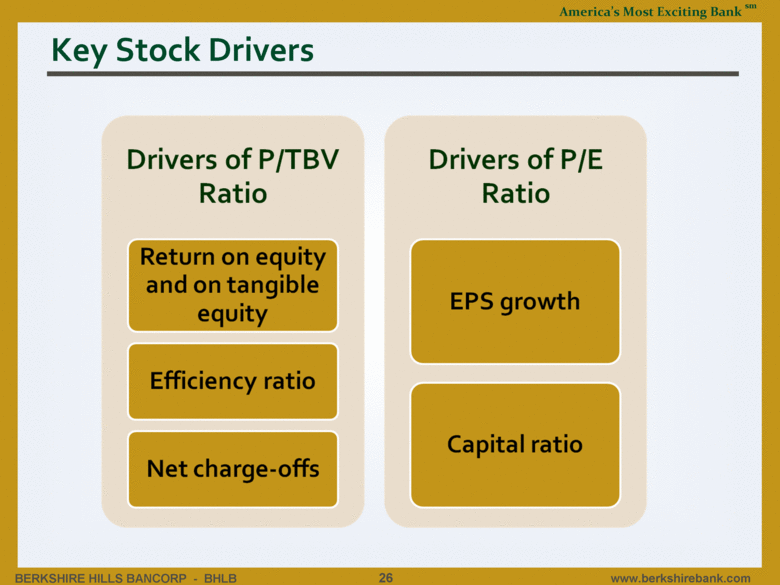
| Key Stock Drivers 26 |
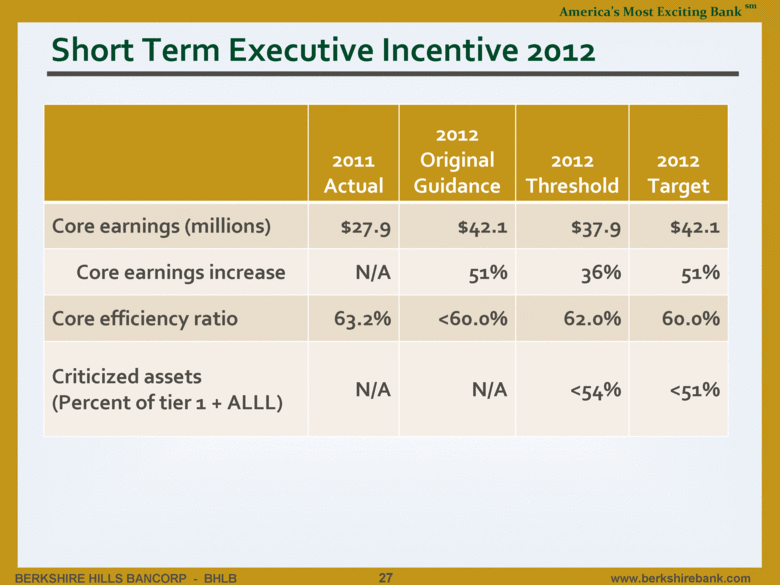
| Short Term Executive Incentive 2012 2011 Actual 2012 Original Guidance 2012 Threshold 2012 Target Core earnings (millions) $27.9 $42.1 $37.9 $42.1 Core earnings increase N/A 51% 36% 51% Core efficiency ratio 63.2% <60.0% 62.0% 60.0% Criticized assets (Percent of tier 1 + ALLL) N/A N/A <54% <51% 27 |
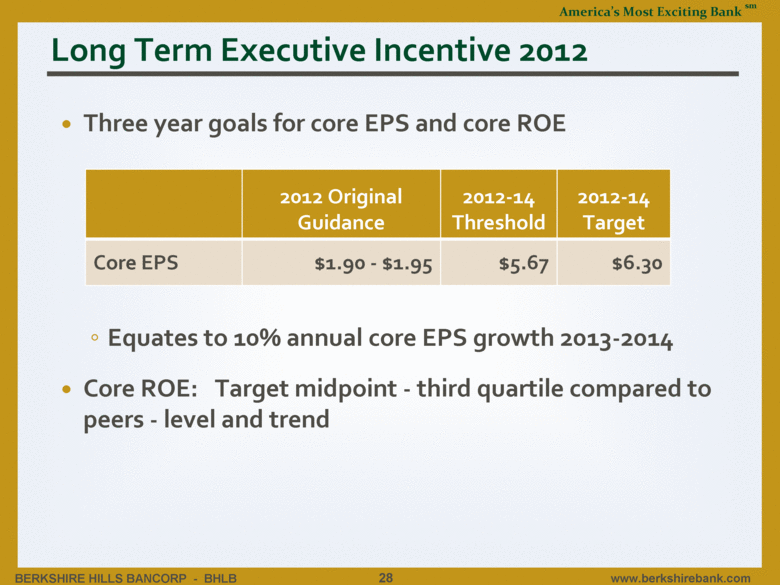
| Long Term Executive Incentive 2012 2012 Original Guidance 2012-14 Threshold 2012-14 Target Core EPS $1.90 - $1.95 $5.67 $6.30 Three year goals for core EPS and core ROE Equates to 10% annual core EPS growth 2013-2014 Core ROE: Target midpoint - third quartile compared to peers - level and trend 28 |
| Human Capital Linda A. Johnston Executive Vice President |
| Fast-Paced, Performance Driven Highly seasoned executive and senior management team Focus on talent Building depth across the organization Hired expert teams in business lines 30 |
| Culture and Brand Performance culture Driven to succeed Pay for results RIGHT values – success the RIGHT way People assessed on results and behaviors Performance management and talent assessment 31 |
| People Development Succession planning Predictive Index, 360 tools AMEB U Leadership training series Developing formal trainee programs 32 |
| Creating Shareholder Value Importance of earnings and profitability Bottom line drives our success and investment in business Clear expectations company-wide Rewards tied to results Understanding of what’s needed for success 33 |
| Controls and Processes Richard M. Marotta Chief Risk Officer |
| Culture and Values Create the Platform AMEB culture and RIGHT values provide for an efficient delivery platform Flexibility... Work Hard, Play Hard, Rest Hard Credit administration and pricing model Scalability... Respect, Integrity, Guts Core conversion, reserve, allowance, Moody’s adjusted risk based analytics Sustainability... Having Fun, Teamwork Strong ERM process, Six Sigma, COSO risk-based 5-level analytic framework Flexible, Scalable and Sustainable Balanced AMEB RISK 35 |
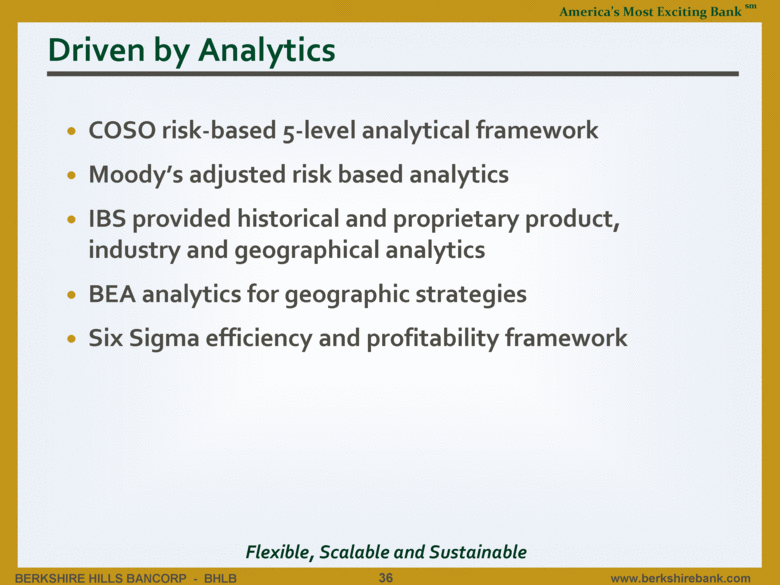
| Driven by Analytics COSO risk-based 5-level analytical framework Moody’s adjusted risk based analytics IBS provided historical and proprietary product, industry and geographical analytics BEA analytics for geographic strategies Six Sigma efficiency and profitability framework 36 Flexible, Scalable and Sustainable |
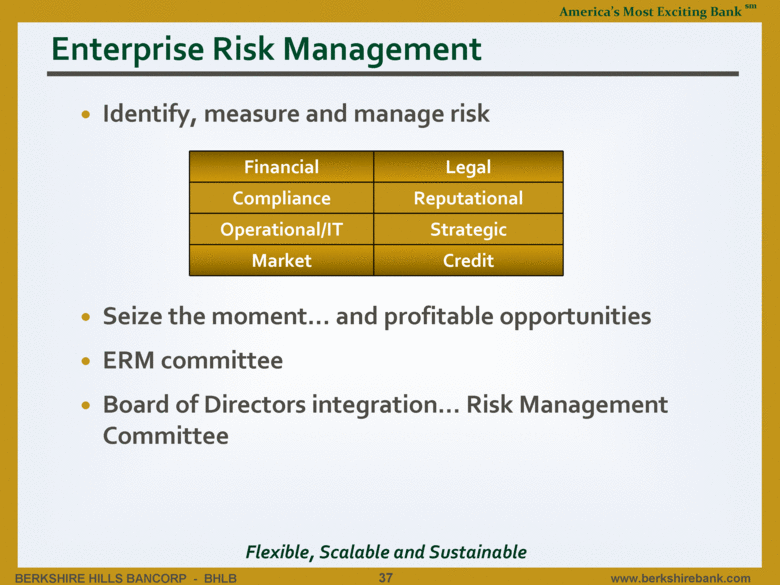
| Enterprise Risk Management Identify, measure and manage risk Seize the moment... and profitable opportunities ERM committee Board of Directors integration... Risk Management Committee Financial Legal Compliance Reputational Operational/IT Strategic Market Credit 37 Flexible, Scalable and Sustainable |
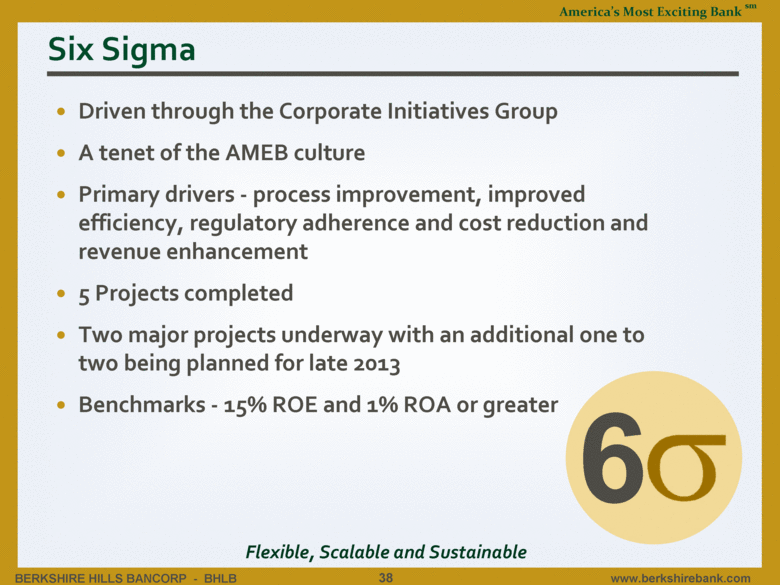
| Six Sigma Driven through the Corporate Initiatives Group A tenet of the AMEB culture Primary drivers - process improvement, improved efficiency, regulatory adherence and cost reduction and revenue enhancement 5 Projects completed Two major projects underway with an additional one to two being planned for late 2013 Benchmarks - 15% ROE and 1% ROA or greater 38 Flexible, Scalable and Sustainable 6 |
| Core Conversion IBS platform provides for long term growth System flexibility provides easy implementation of new product types, sets and integration Reduces time / cost of acquisitions and conversions Integrates entire company on common platform DATA, DATA, DATA... improves management and clarity of day-to-day and long term strategies Allows for the next steps... data warehouse and CRM 39 Flexible, Scalable and Sustainable |
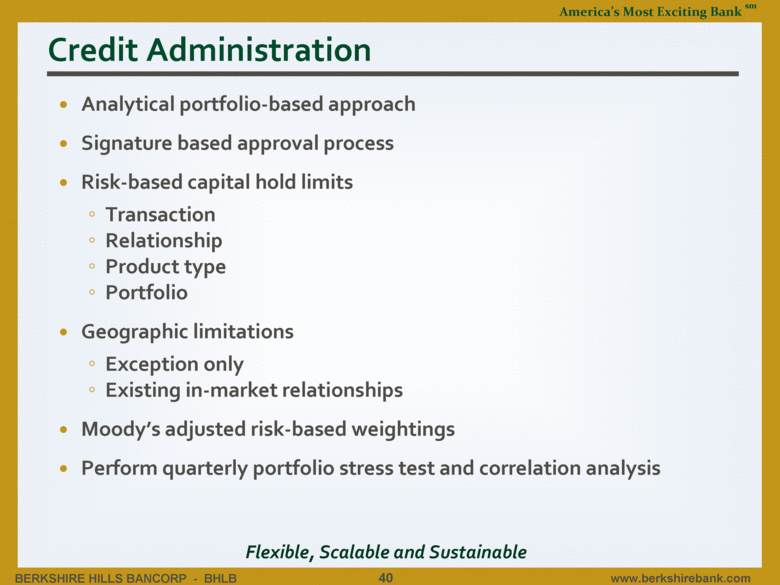
| Credit Administration Analytical portfolio-based approach Signature based approval process Risk-based capital hold limits Transaction Relationship Product type Portfolio Geographic limitations Exception only Existing in-market relationships Moody’s adjusted risk-based weightings Perform quarterly portfolio stress test and correlation analysis 40 Flexible, Scalable and Sustainable |
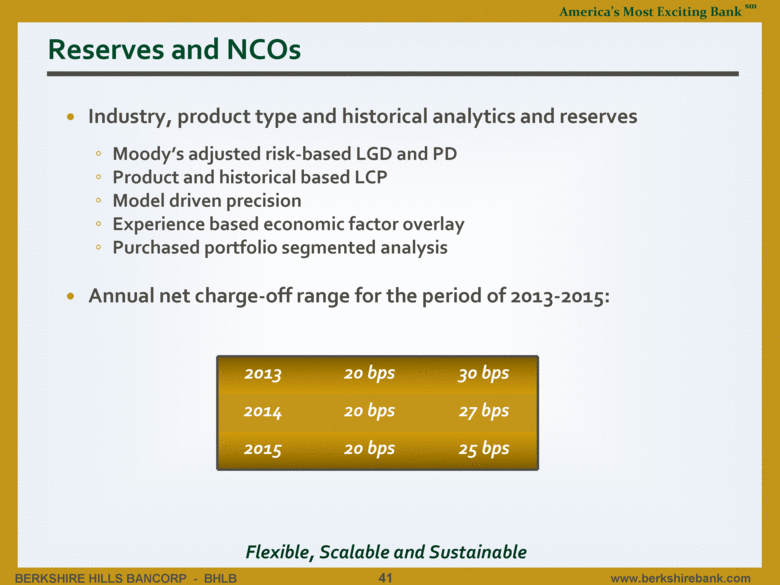
| Reserves and NCOs Industry, product type and historical analytics and reserves Moody’s adjusted risk-based LGD and PD Product and historical based LCP Model driven precision Experience based economic factor overlay Purchased portfolio segmented analysis Annual net charge-off range for the period of 2013-2015: 2013 20 bps 30 bps 2014 20 bps 27 bps 2015 20 bps 25 bps Flexible, Scalable and Sustainable 41 |
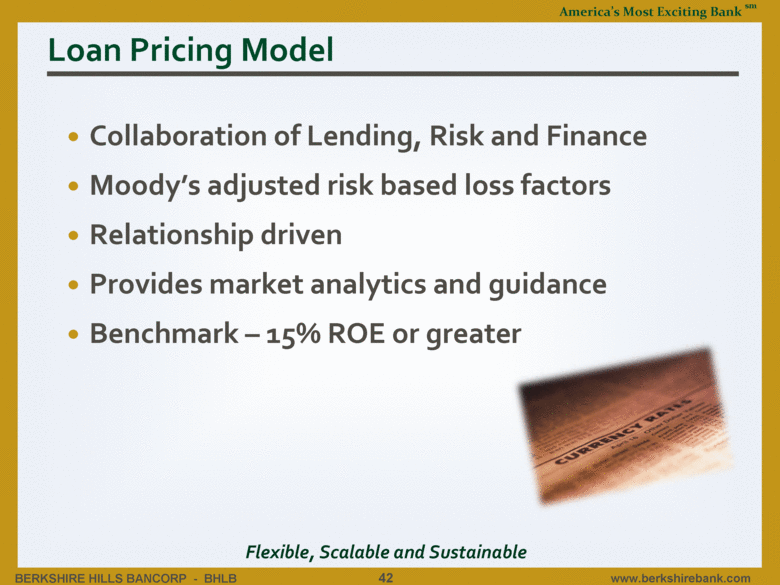
| Loan Pricing Model Collaboration of Lending, Risk and Finance Moody’s adjusted risk based loss factors Relationship driven Provides market analytics and guidance Benchmark – 15% ROE or greater 42 Flexible, Scalable and Sustainable |
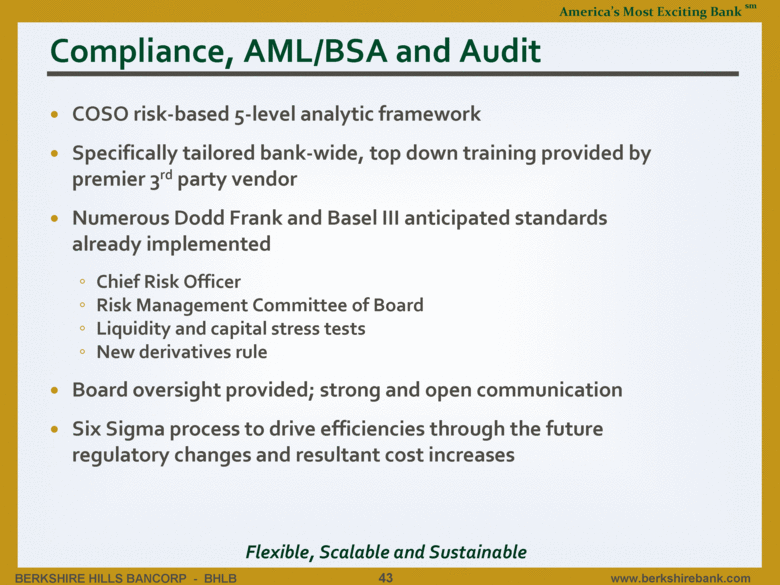
| Compliance, AML/BSA and Audit COSO risk-based 5-level analytic framework Specifically tailored bank-wide, top down training provided by premier 3rd party vendor Numerous Dodd Frank and Basel III anticipated standards already implemented Chief Risk Officer Risk Management Committee of Board Liquidity and capital stress tests New derivatives rule Board oversight provided; strong and open communication Six Sigma process to drive efficiencies through the future regulatory changes and resultant cost increases 43 Flexible, Scalable and Sustainable |
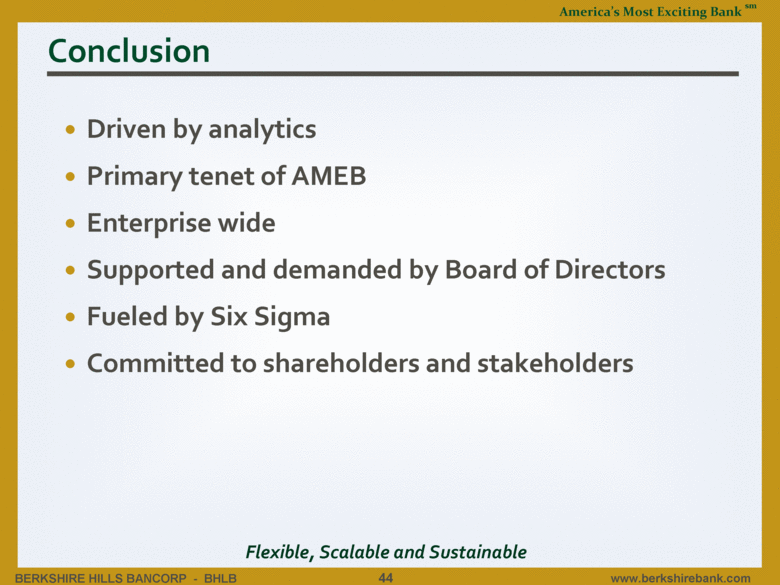
| Conclusion Driven by analytics Primary tenet of AMEB Enterprise wide Supported and demanded by Board of Directors Fueled by Six Sigma Committed to shareholders and stakeholders 44 Flexible, Scalable and Sustainable |
| Retail Banking Sean A. Gray Executive Vice President |
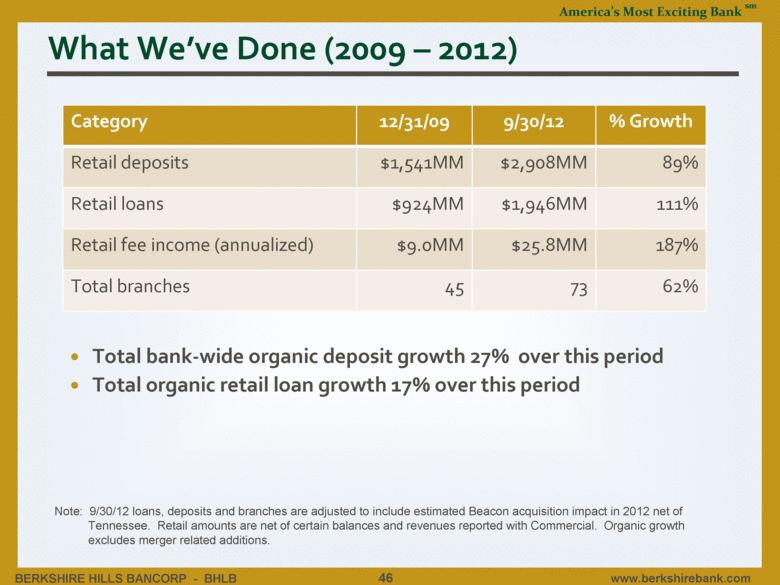
| What We’ve Done (2009 – 2012) Category 12/31/09 9/30/12 % Growth Retail deposits $1,541MM $2,908MM 89% Retail loans $924MM $1,946MM 111% Retail fee income (annualized) $9.0MM $25.8MM 187% Total branches 45 73 62% Total bank-wide organic deposit growth 27% over this period Total organic retail loan growth 17% over this period 46 Note: 9/30/12 loans, deposits and branches are adjusted to include estimated Beacon acquisition impact in 2012 net of Tennessee. Retail amounts are net of certain balances and revenues reported with Commercial. Organic growth excludes merger related additions. |
| Competitive Strengths 2012 Initiatives Branch expansion Greenpark acquisition AMEB U execution M&A handbook, CBT, Beacon execution Core conversion upgrade Brand build-out Retail Core Strengths Balanced scorecards Integrated cross sales Performance management Differentiated model Relationship selling Expense management De novo execution Organic growth M&A integration 47 |
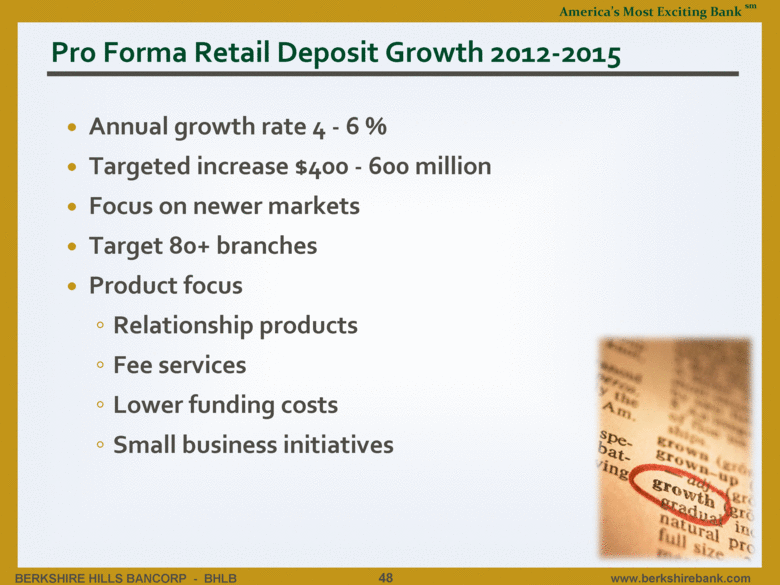
| Pro Forma Retail Deposit Growth 2012-2015 Annual growth rate 4 - 6 % Targeted increase $400 - 600 million Focus on newer markets Target 80+ branches Product focus Relationship products Fee services Lower funding costs Small business initiatives 48 |
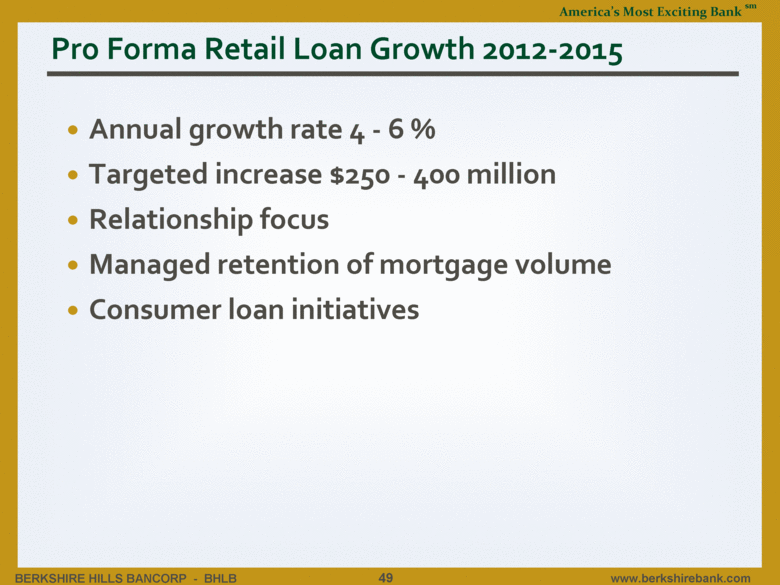
| Pro Forma Retail Loan Growth 2012-2015 Annual growth rate 4 - 6 % Targeted increase $250 - 400 million Relationship focus Managed retention of mortgage volume Consumer loan initiatives 49 |
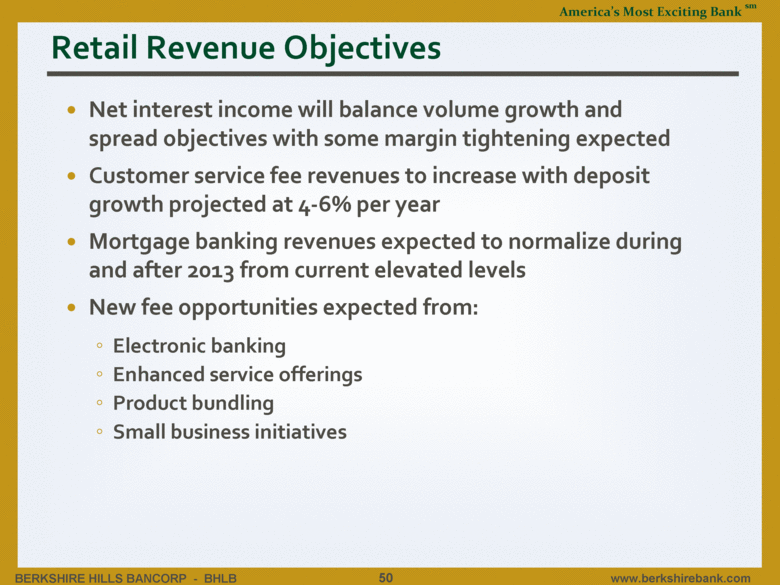
| Retail Revenue Objectives Net interest income will balance volume growth and spread objectives with some margin tightening expected Customer service fee revenues to increase with deposit growth projected at 4-6% per year Mortgage banking revenues expected to normalize during and after 2013 from current elevated levels New fee opportunities expected from: Electronic banking Enhanced service offerings Product bundling Small business initiatives 50 |
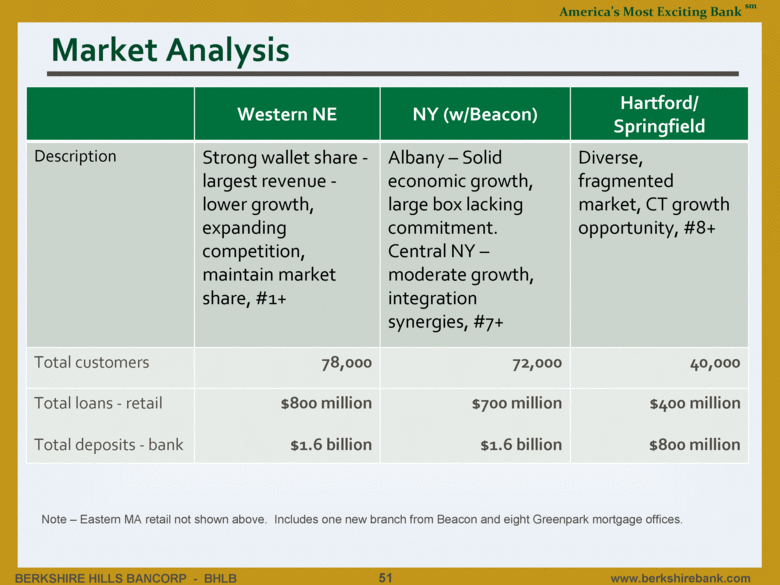
| Market Analysis Western NE NY (w/Beacon) Hartford/Springfield Description Strong wallet share - largest revenue - lower growth, expanding competition, maintain market share, #1+ Albany – Solid economic growth, large box lacking commitment. Central NY – moderate growth, integration synergies, #7+ Diverse, fragmented market, CT growth opportunity, #8+ Total customers 78,000 72,000 40,000 Total loans - retail Total deposits - bank $800 million $1.6 billion $700 million $1.6 billion $400 million $800 million 51 Note – Eastern MA retail not shown above. Includes one new branch from Beacon and eight Greenpark mortgage offices. |
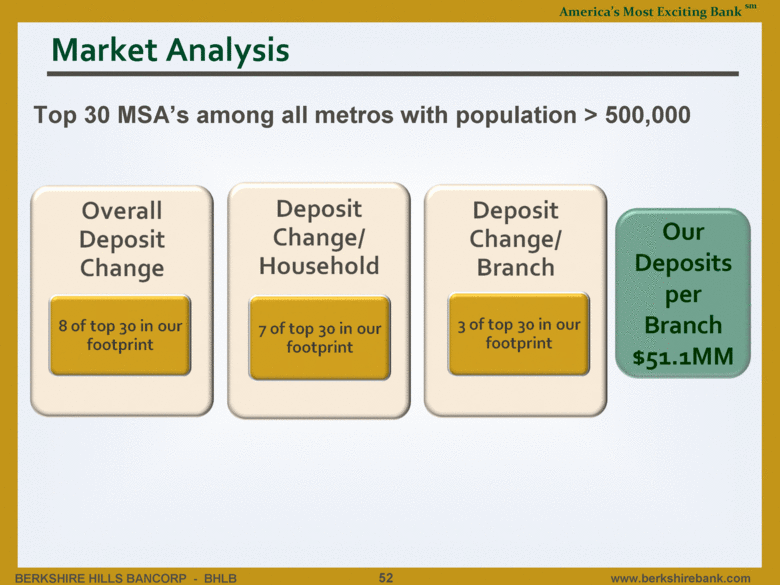
| Market Analysis Our Deposits per Branch $51.1MM Top 30 MSA’s among all metros with population > 500,000 52 |
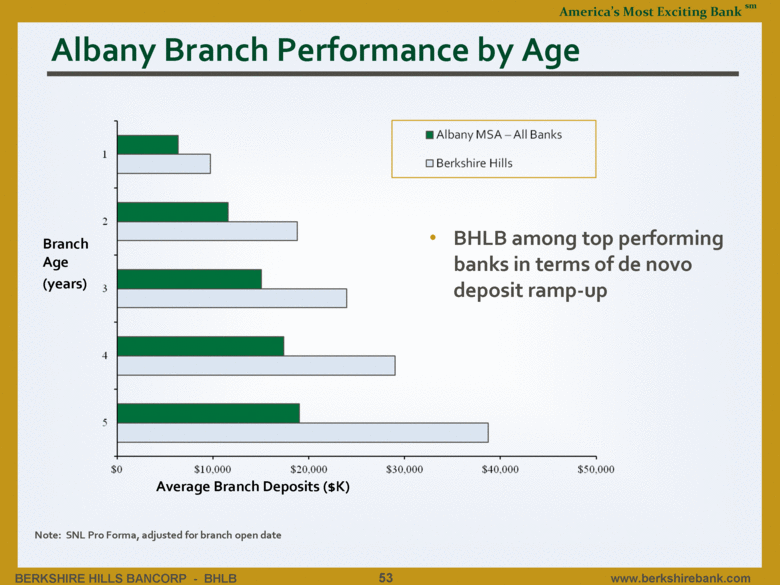
| Albany Branch Performance by Age BHLB among top performing banks in terms of de novo deposit ramp-up Branch Age (years) Average Branch Deposits ($K) Note: SNL Pro Forma, adjusted for branch open date 53 |
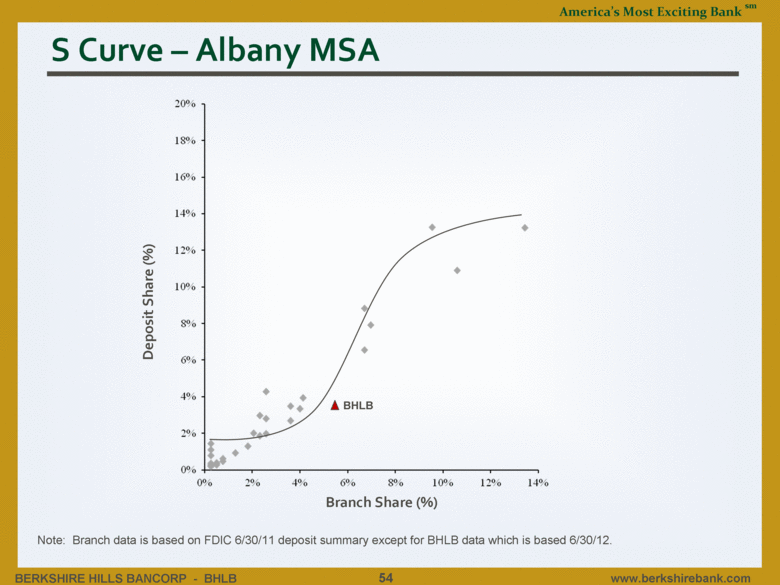
| S Curve – Albany MSA Note: Branch data is based on FDIC 6/30/11 deposit summary except for BHLB data which is based 6/30/12. Deposit Share (%) 54 BHLB Branch Share (%) |
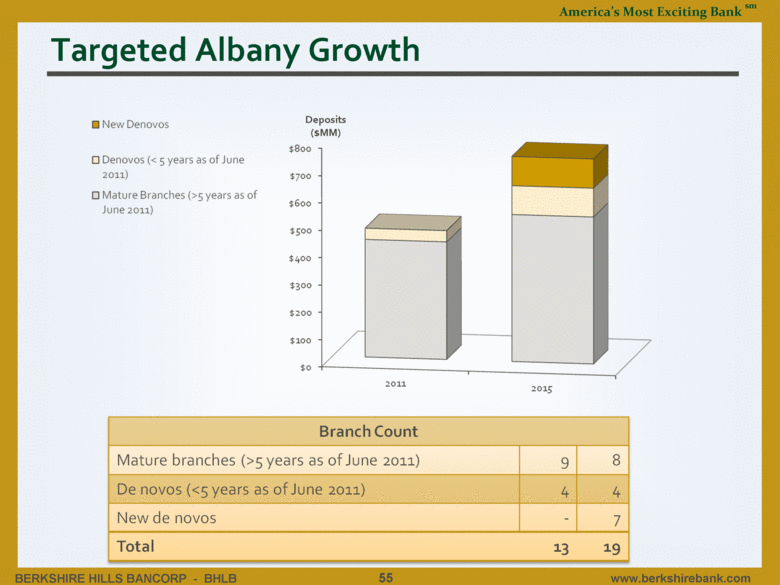
| Targeted Albany Growth Deposits ($MM) 55 Mature branches (>5 years as of June 2011) 9 8 De novos (<5 years as of June 2011) 4 4 New de novos - 7 Total 13 19 |
| AMEB Brand People, attitude, energy Three value propositions No two customers are alike One size does not fit all Life should be exciting. Let us help. Geno Auriemma - “Life is Exciting, Let us Help” 56 |
| AMEB Brand Teamwork, excellence and excitement. That’s what I expect from my team, and now I can expect that from my bank. Berkshire Bank, America’s Most Exciting Bank! 57 |
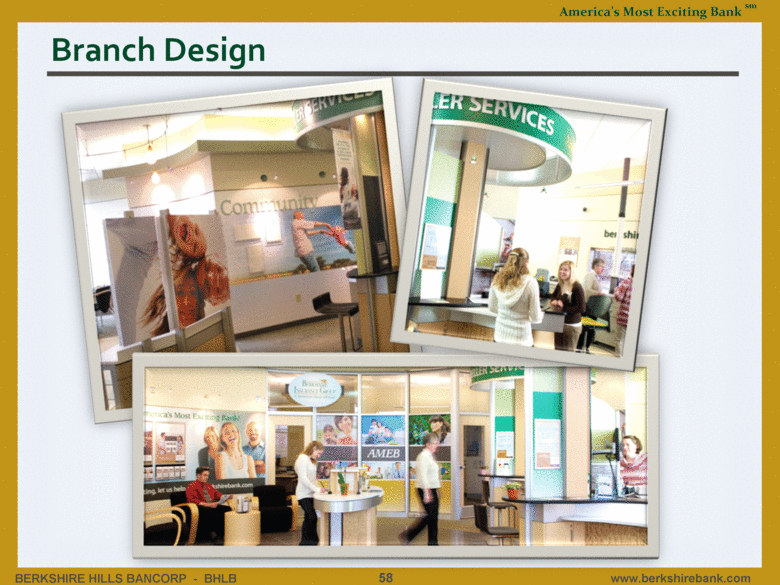
| Branch Design 58 |
| AMEB Branch Difference Customer friendly design with enhanced teller technology More personalized service Faster transactions Improved accuracy Less wait time and a better customer experience Only bank in northeast to feature new technology for daily transactions Smaller size requirements allow for greater selection of new locations 62% usage AMEB Café 13% of new accounts come from Community Room with increased branch traffic of 22% 59 |
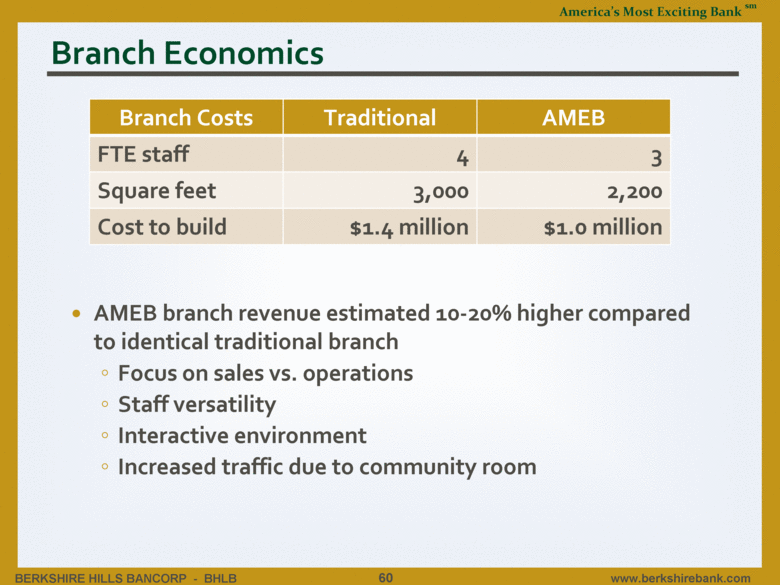
| Branch Economics Branch Costs Traditional AMEB FTE staff 4 3 Square feet 3,000 2,200 Cost to build $1.4 million $1.0 million AMEB branch revenue estimated 10-20% higher compared to identical traditional branch Focus on sales vs. operations Staff versatility Interactive environment Increased traffic due to community room 60 |
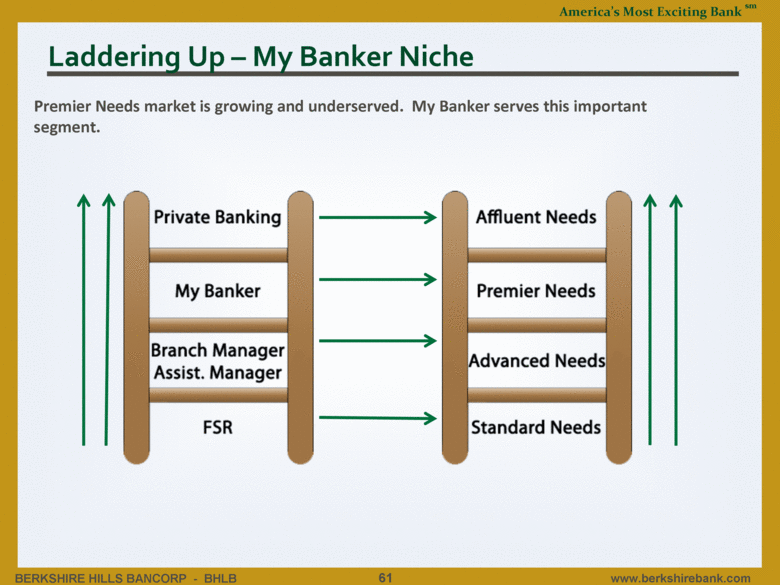
| Laddering Up – My Banker Niche Premier Needs market is growing and underserved. My Banker serves this important segment. 61 |
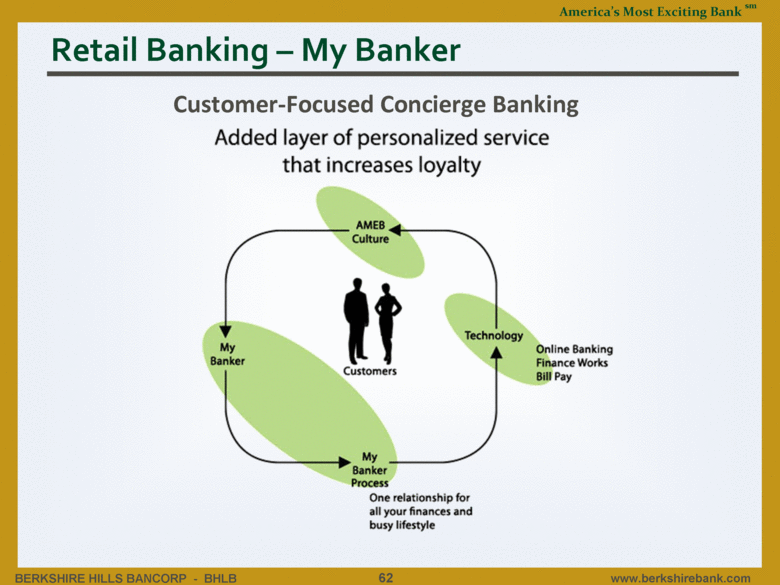
| Retail Banking – My Banker Customer-Focused Concierge Banking 62 |
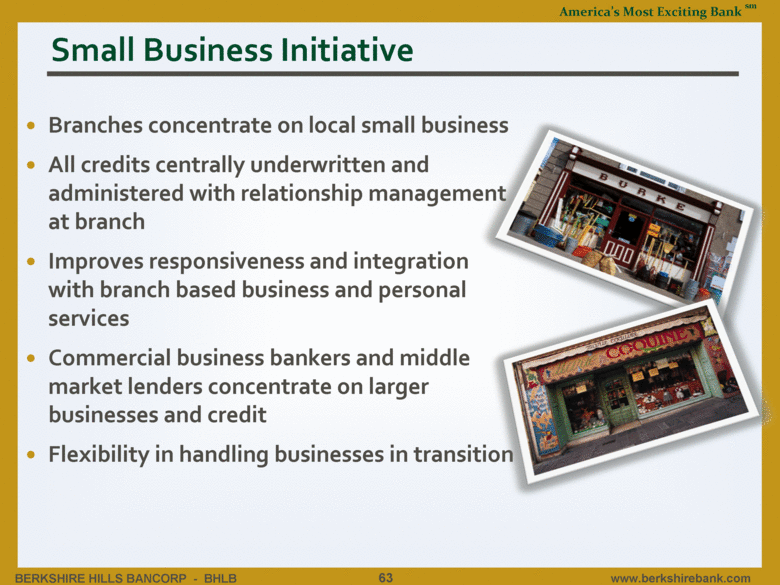
| Small Business Initiative 63 Branches concentrate on local small business All credits centrally underwritten and administered with relationship management at branch Improves responsiveness and integration with branch based business and personal services Commercial business bankers and middle market lenders concentrate on larger businesses and credit Flexibility in handling businesses in transition |
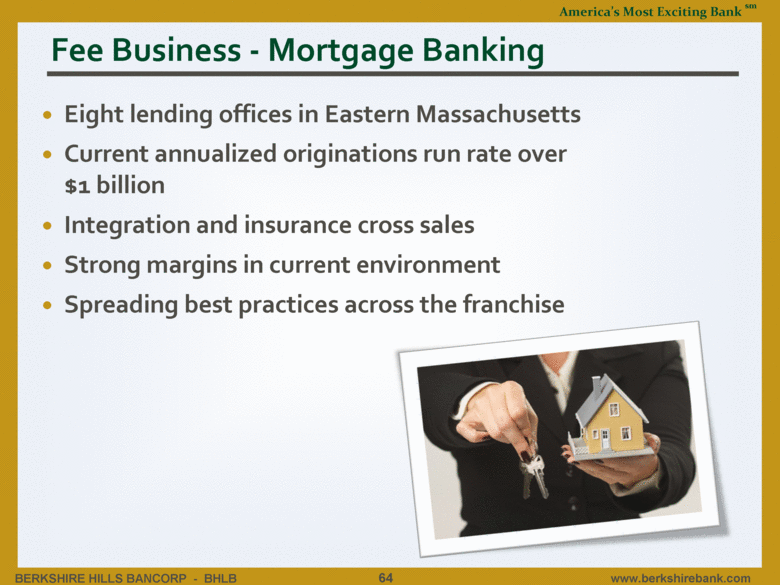
| Fee Business - Mortgage Banking Eight lending offices in Eastern Massachusetts Current annualized originations run rate over $1 billion Integration and insurance cross sales Strong margins in current environment Spreading best practices across the franchise 64 |
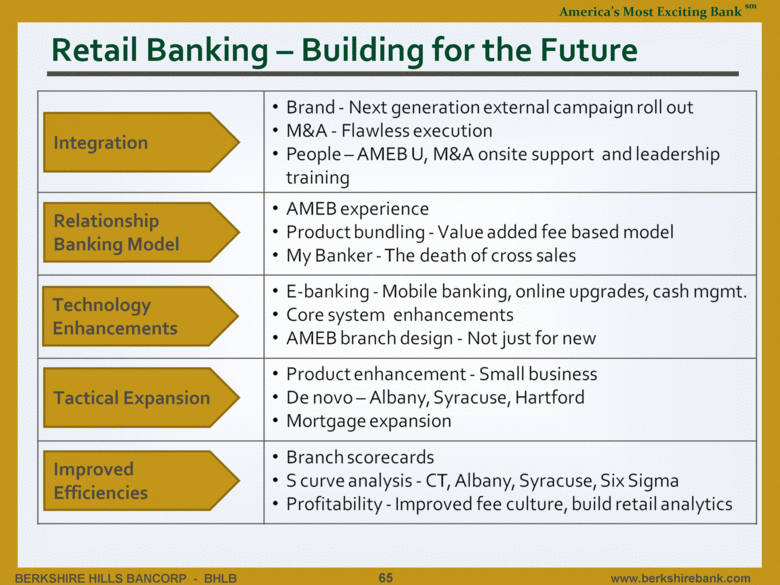
| Retail Banking – Building for the Future Integration Relationship Banking Model Technology Enhancements Tactical Expansion Improved Efficiencies 65 Brand - Next generation external campaign roll out M&A - Flawless execution People – AMEB U, M&A onsite support and leadership training AMEB experience Product bundling - Value added fee based model My Banker - The death of cross sales E-banking - Mobile banking, online upgrades, cash mgmt. Core system enhancements AMEB branch design - Not just for new Product enhancement - Small business De novo – Albany, Syracuse, Harford Mortgage expansion Branch scorecards S curve analysis - CT, Albany, Syracuse, Six Sigma Profitability - Improved fee culture, build retail analytics |
| Commercial Banking Patrick J. Sullivan Executive Vice President |
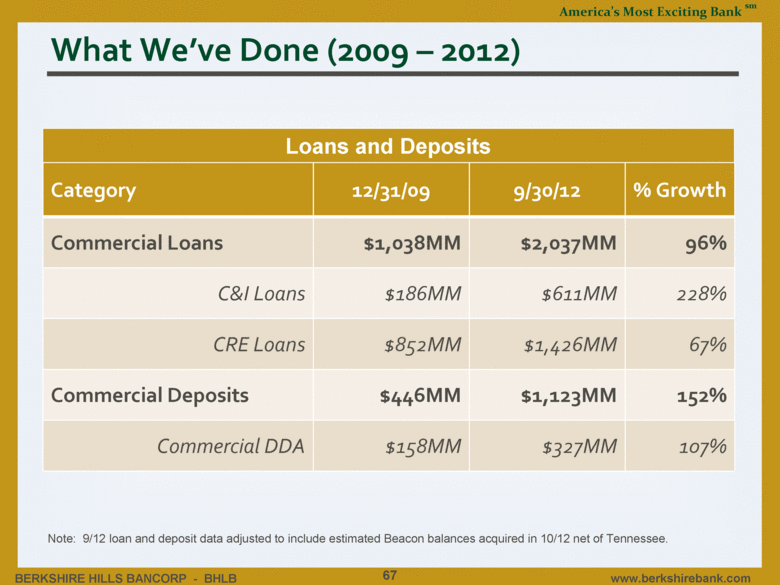
| What We’ve Done (2009 – 2012) 67 Note: 9/12 loan and deposit data adjusted to include estimated Beacon balances acquired in 10/12 net of Tennessee. Category 12/31/09 9/30/12 % Growth Commercial Loans $1,038MM $2,037MM 96% C&I Loans $186MM $611MM 228% CRE Loans $852MM $1,426MM 67% Commercial Deposits $446MM $1,123MM 152% Commercial DDA $158MM $327MM 107% Loans and Deposits |
| What We’ve Done (2009 – 2012) 68 Note: Loan and deposit data adjusted to include Beacon balances acquired in 10/12. Category 12/31/09 9/30/12 % Growth Total Revenue (annualized) $33MM $60MM 82% Fee Income (annualized) $2,219M $5,450M 146% Loan & Swap Fees $1,561M $3,387M 117% Cash Management $554M $1,681M 203% Revenue and Fee Income |
| Our Competitive Advantage Geography Community based bank with product sophistication Continuity to market and strong market leadership Responsive risk management culture Visibility of retail distribution and foundation support 69 |
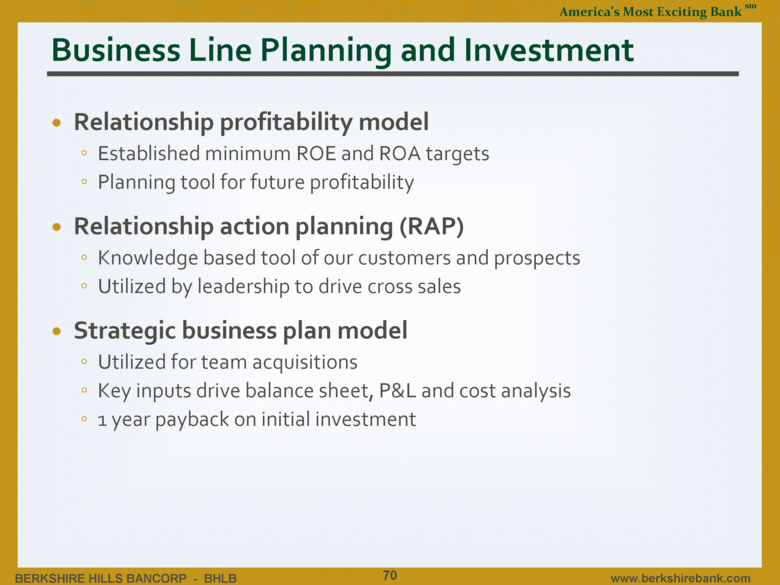
| Business Line Planning and Investment Relationship profitability model Established minimum ROE and ROA targets Planning tool for future profitability Relationship action planning (RAP) Knowledge based tool of our customers and prospects Utilized by leadership to drive cross sales Strategic business plan model Utilized for team acquisitions Key inputs drive balance sheet, P&L and cost analysis 1 year payback on initial investment 70 |
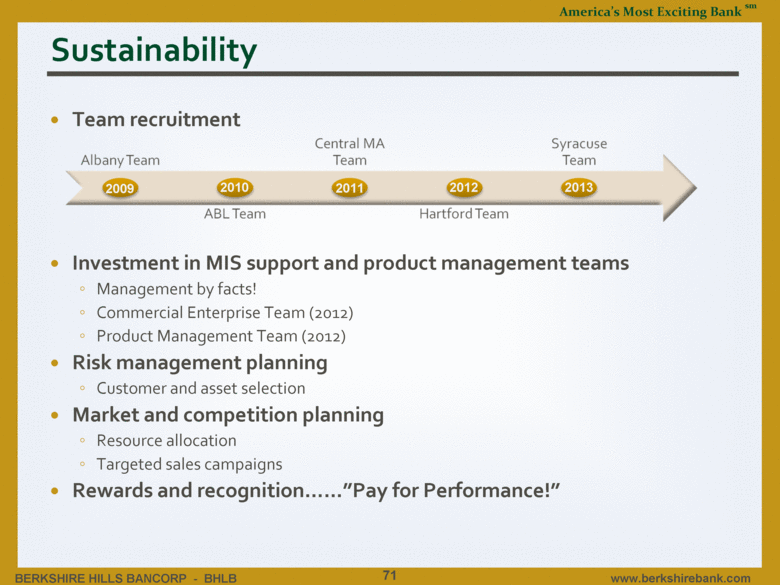
| Sustainability Team recruitment Investment in MIS support and product management teams Management by facts! Commercial Enterprise Team (2012) Product Management Team (2012) Risk management planning Customer and asset selection Market and competition planning Resource allocation Targeted sales campaigns Rewards and recognition”Pay for Performance!” 71 2009 2010 2011 2012 2013 |
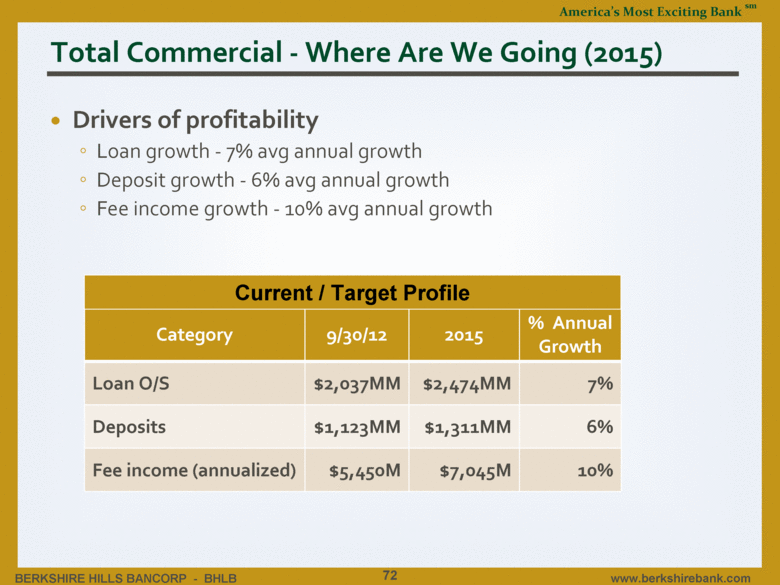
| Total Commercial - Where Are We Going (2015) Drivers of profitability Loan growth - 7% avg annual growth Deposit growth - 6% avg annual growth Fee income growth - 10% avg annual growth 72 Category 9/30/12 2015 % Annual Growth Loan O/S $2,037MM $2,474MM 7% Deposits $1,123MM $1,311MM 6% Fee income (annualized) $5,450M $7,045M 10% Current / Target Profile |
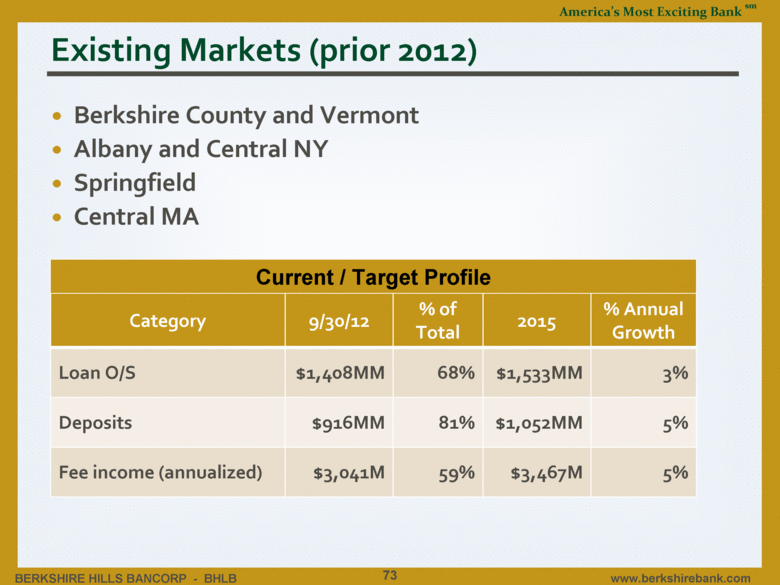
| Existing Markets (prior 2012) Berkshire County and Vermont Albany and Central NY Springfield Central MA 73 Category 9/30/12 % of Total 2015 % Annual Growth Loan O/S $1,408MM 68% $1,533MM 3% Deposits $916MM 81% $1,052MM 5% Fee income (annualized) $3,041M 59% $3,467M 5% Current / Target Profile |
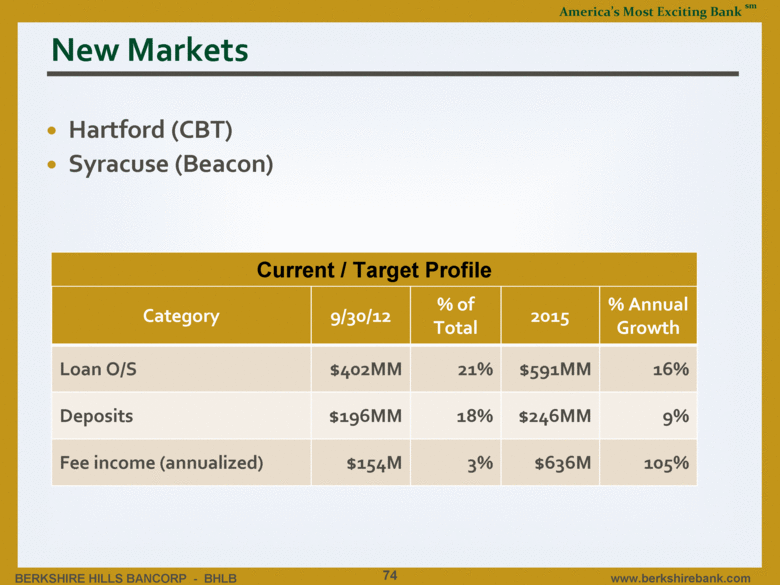
| New Markets Hartford (CBT) Syracuse (Beacon) 74 Category 9/30/12 % of Total 2015 % Annual Growth Loan O/S $402MM 21% $591MM 16% Deposits $196MM 18% $246MM 9% Fee income (annualized) $154M 3% $636M 105% Current / Target Profile |
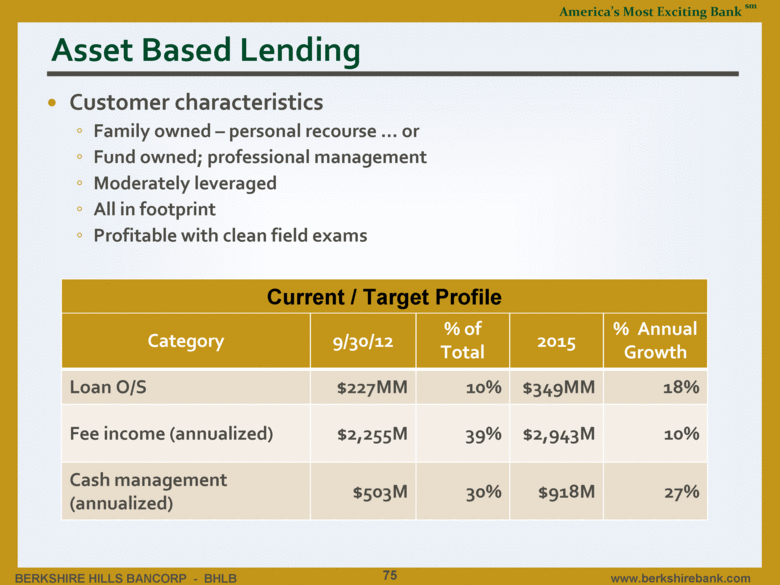
| Asset Based Lending Customer characteristics Family owned – personal recourse... or Fund owned; professional management Moderately leveraged All in footprint Profitable with clean field exams 75 Category 9/30/12 % of Total 2015 % Annual Growth Loan O/S $227MM 10% $349MM 18% Fee income (annualized) $2,255M 39% $2,943M 10% Cash management (annualized) $503M 30% $918M 27% Current / Target Profile |
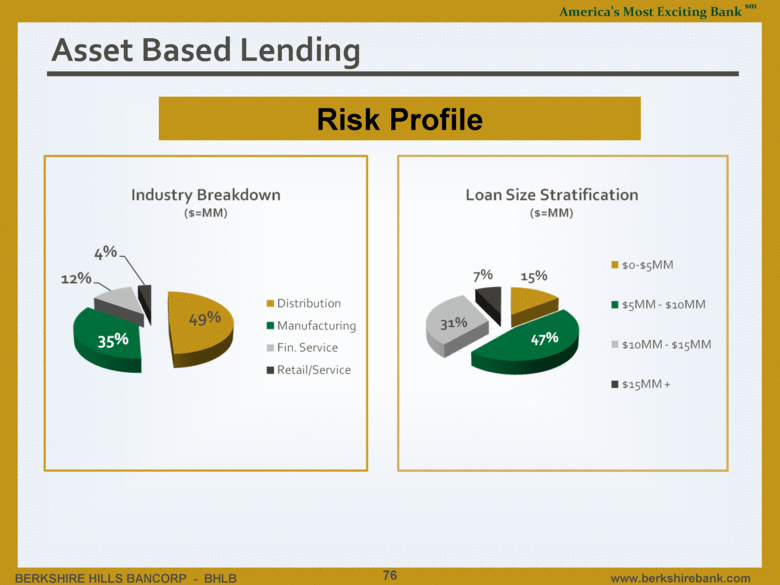
| Asset Based Lending 76 Risk Profile |
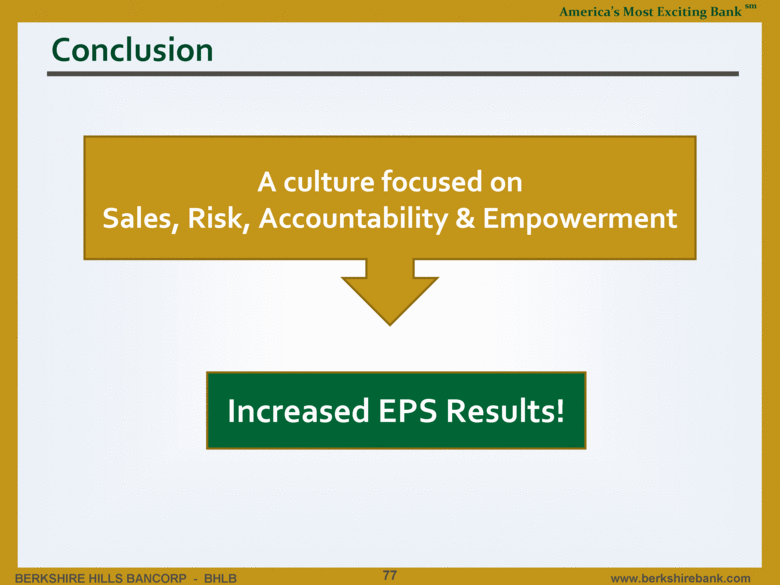
| Conclusion 77 A culture focused on Sales, Risk, Accountability & Empowerment Increased EPS Results! |
| Insurance and Wealth Management Patrick J. Sullivan Executive Vice President |
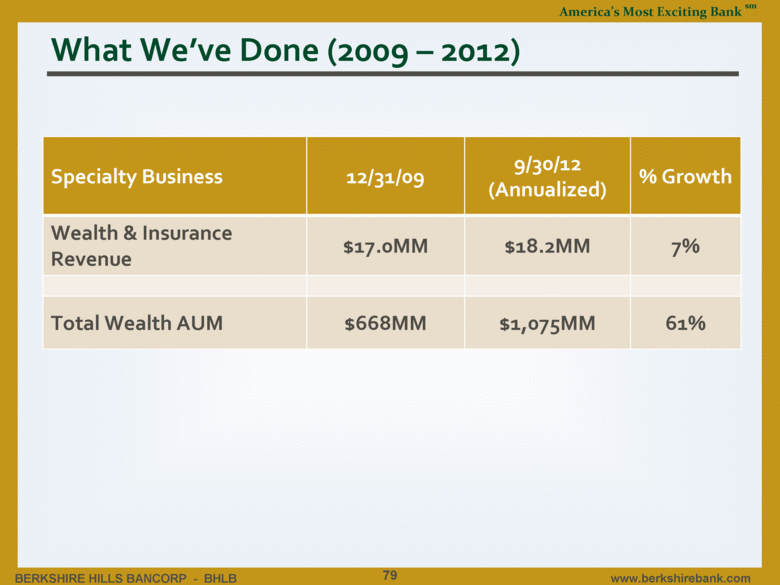
| What We’ve Done (2009 – 2012) Specialty Business 12/31/09 9/30/12 (Annualized) % Growth Wealth & Insurance Revenue $17.0MM $18.2MM 7% Total Wealth AUM $668MM $1,075MM 61% 79 |
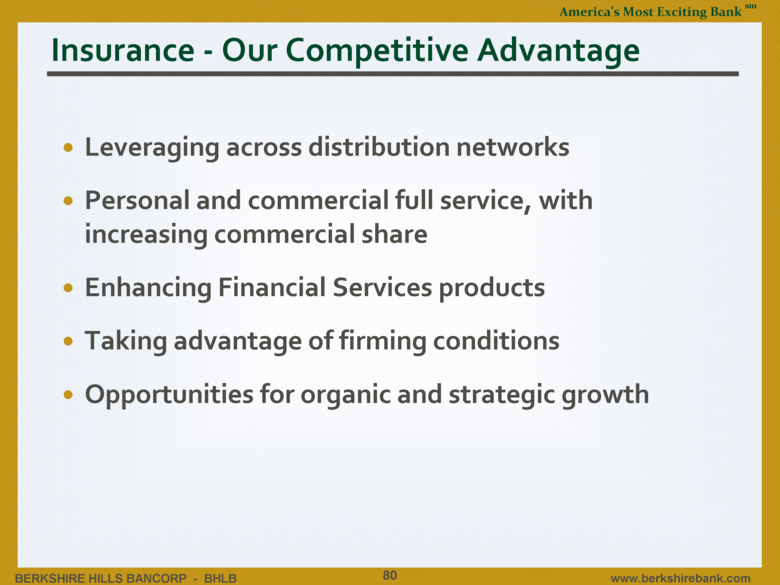
| Insurance - Our Competitive Advantage Leveraging across distribution networks Personal and commercial full service, with increasing commercial share Enhancing Financial Services products Taking advantage of firming conditions Opportunities for organic and strategic growth 80 |
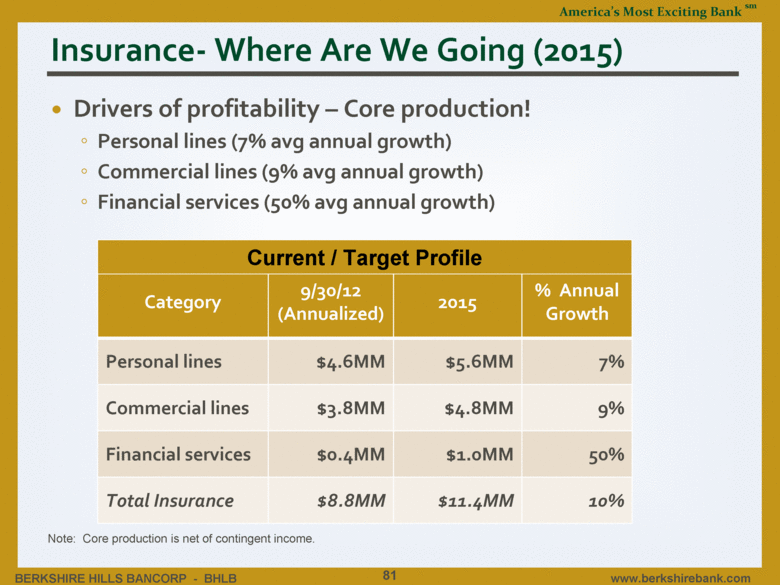
| Insurance- Where Are We Going (2015) Drivers of profitability – Core production! Personal lines (7% avg annual growth) Commercial lines (9% avg annual growth) Financial services (50% avg annual growth) 81 Category 9/30/12 (Annualized) 2015 % Annual Growth Personal lines $4.6MM $5.6MM 7% Commercial lines $3.8MM $4.8MM 9% Financial services $0.4MM $1.0MM 50% Total Insurance $8.8MM $11.4MM 10% Current / Target Profile Note: Core production is net of contingent income. |
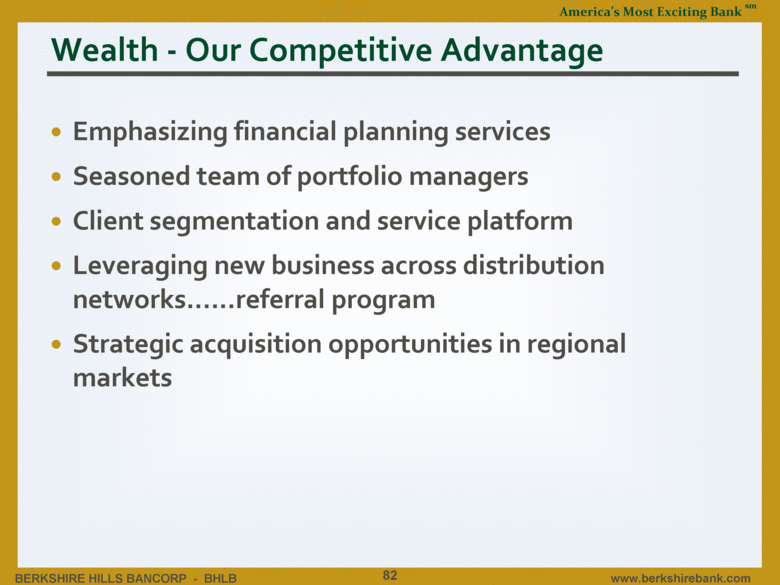
| Wealth - Our Competitive Advantage Emphasizing financial planning services Seasoned team of portfolio managers Client segmentation and service platform Leveraging new business across distribution networks......referral program Strategic acquisition opportunities in regional markets 82 |
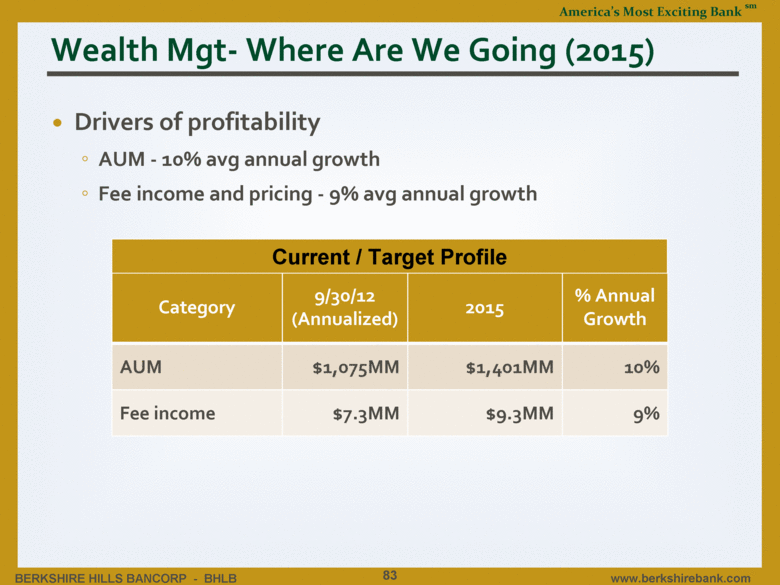
| Wealth Mgt- Where Are We Going (2015) Drivers of profitability AUM - 10% avg annual growth Fee income and pricing - 9% avg annual growth 83 Category 9/30/12 (Annualized) 2015 % Annual Growth AUM $1,075MM $1,401MM 10% Fee income $7.3MM $9.3MM 9% Current / Target Profile |
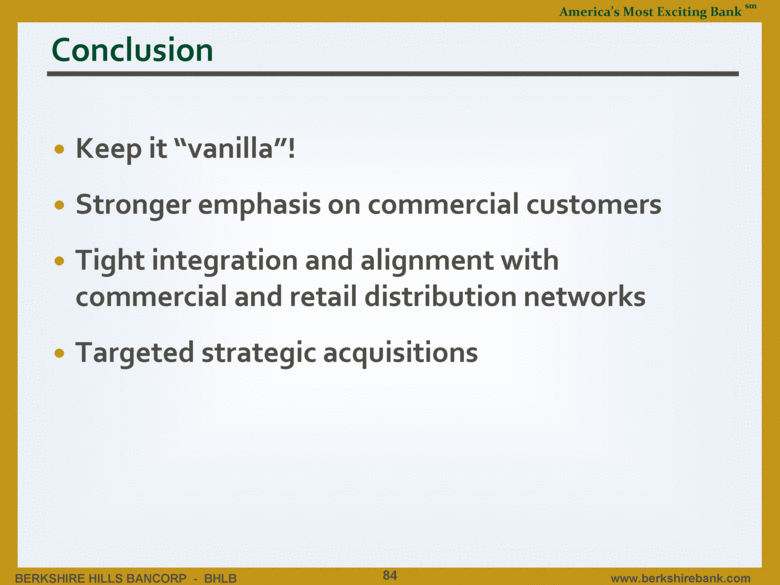
| Conclusion Keep it “vanilla”! Stronger emphasis on commercial customers Tight integration and alignment with commercial and retail distribution networks Targeted strategic acquisitions 84 |
| Financials Kevin P. Riley Chief Financial Officer |
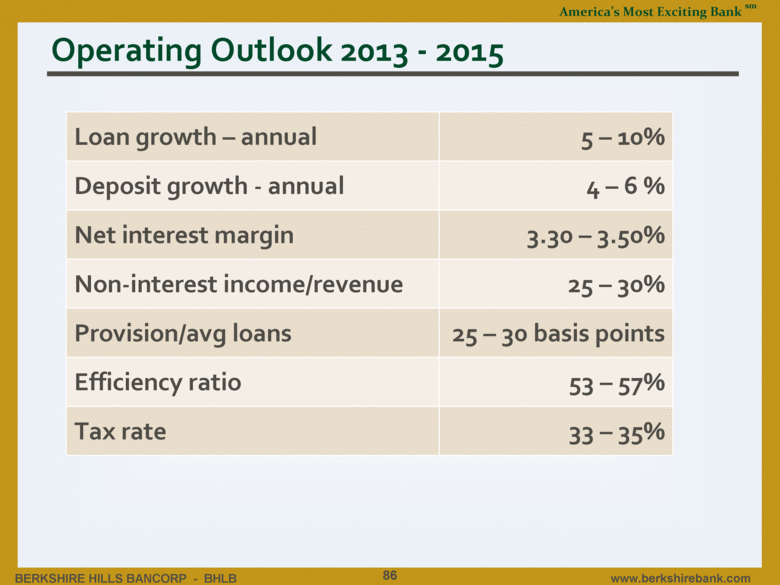
| Operating Outlook 2013 - 2015 Loan growth – annual 5 – 10% Deposit growth - annual 4 – 6 % Net interest margin 3.30 – 3.50% Non-interest income/revenue 25 – 30% Provision/avg loans 25 – 30 basis points Efficiency ratio 53 – 57% Tax rate 33 – 35% 86 |
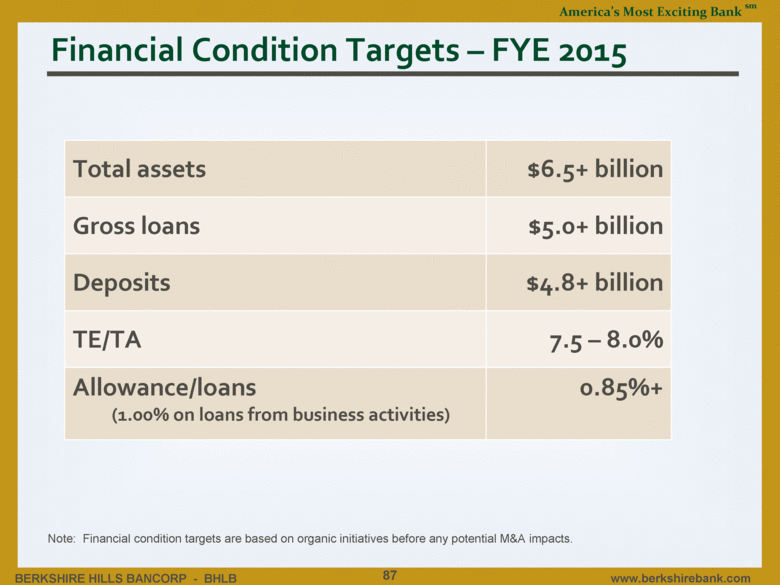
| Financial Condition Targets – FYE 2015 Total assets $6.5+ billion Gross loans $5.0+ billion Deposits $4.8+ billion TE/TA 7.5 – 8.0% Allowance/loans (1.00% on loans from business activities) 0.85%+ Note: Financial condition targets are based on organic initiatives before any potential M&A impacts. 87 |
| Performance Targets Note: Current run rate estimated as of 10/1/12 before Beacon acquisition except that TBVPS adjusted for estimated Beacon impact. 88 Current Run Rate 2015 Range Target Revenue $200MM $250-275MM 7-10% growth in 2015 EPS $2.08 $2.70 - $2.90 $3.00 run rate at YE 2015 ROA 1.00% 1.05 – 1.08% 1.10% goal ROE 8.0% 9.5 – 9.8% 10% run rate at YE 2015 ROTE 15.0% 14 – 16% 14 – 16% TBVPS $14.75 - $15.00 $18 - $21 $20 at YE 2015 |
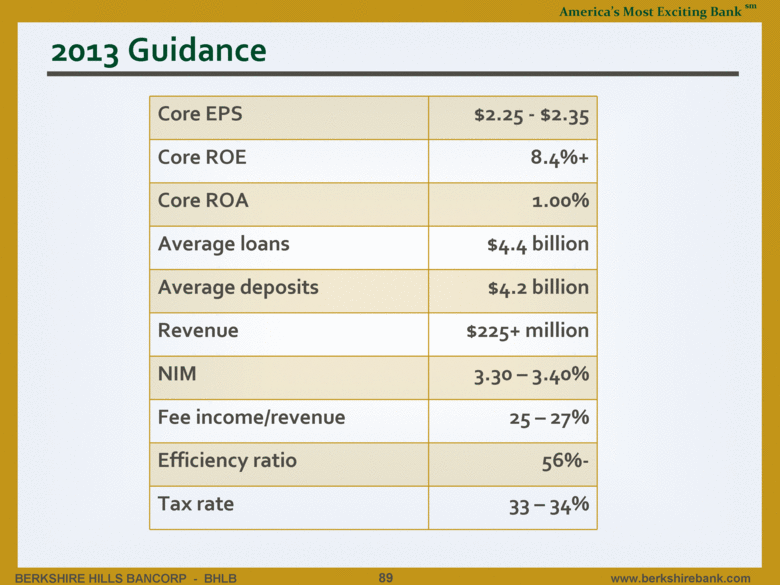
| 2013 Guidance 89 Core EPS $2.25 - $2.35 Core ROE 8.4%+ Core ROA 1.00% Average loans $4.4 billion Average deposits $4.2 billion Revenue $225+ million NIM 3.30 – 3.40% Fee income/revenue 25 – 27% Efficiency ratio 56%- Tax rate 33 – 34% |
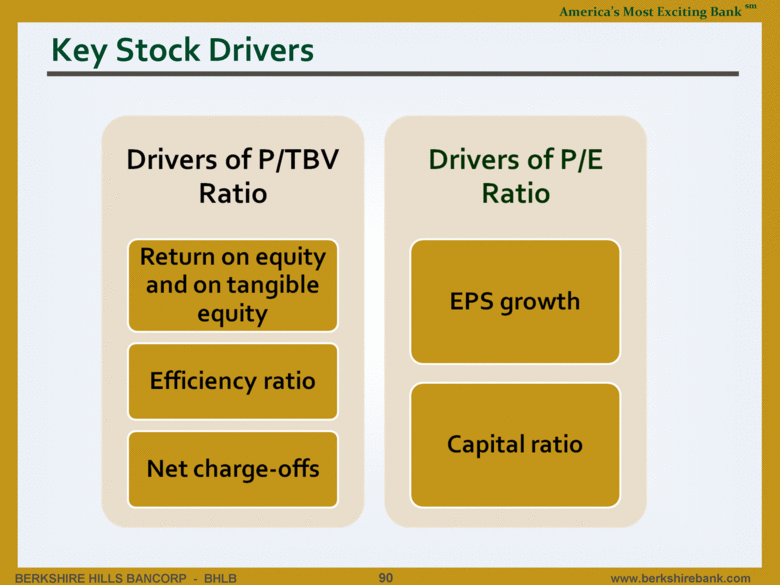
| Key Stock Drivers 90 |
| Two Stock Valuation Scenarios 91 Earnings Driven 2012 Key P/E Driver: Projected EPS Growth (2 Years) 7.00% Suggested P/E Multiple 13.5 Core EPS $2.80 Suggested Price $37.30 TBV Driven 2012 Key P/TBV Multiple 1.7 TBV/Share $20.00 Suggested Price $34.00 |
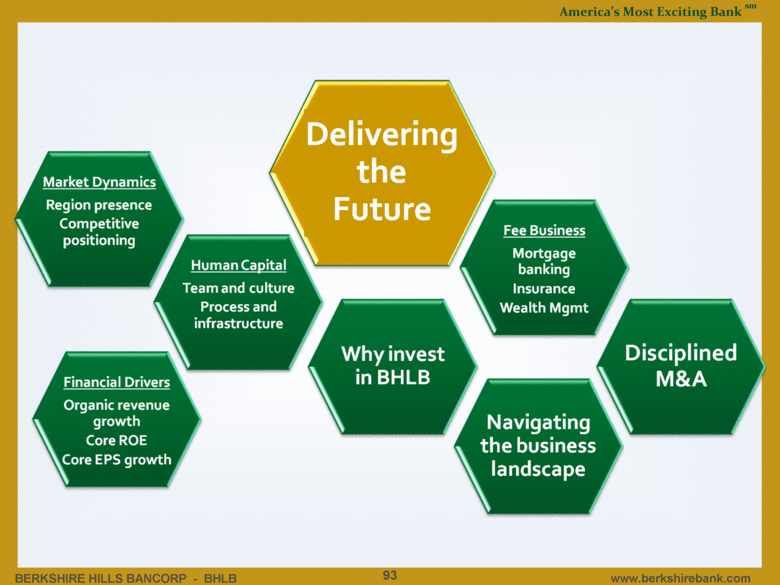
| Delivering the Future Michael P. Daly President and CEO |
| 93 America’s Most Exciting Bank sm |
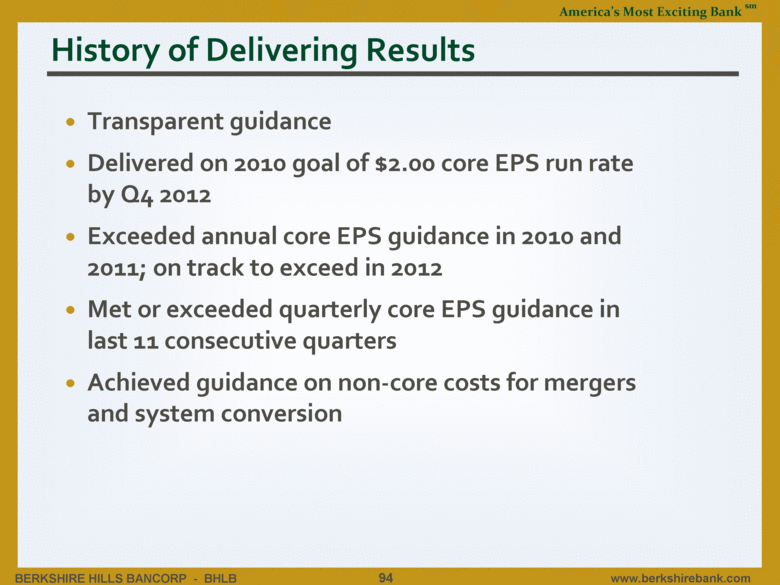
| History of Delivering Results Transparent guidance Delivered on 2010 goal of $2.00 core EPS run rate by Q4 2012 Exceeded annual core EPS guidance in 2010 and 2011; on track to exceed in 2012 Met or exceeded quarterly core EPS guidance in last 11 consecutive quarters Achieved guidance on non-core costs for mergers and system conversion 94 |
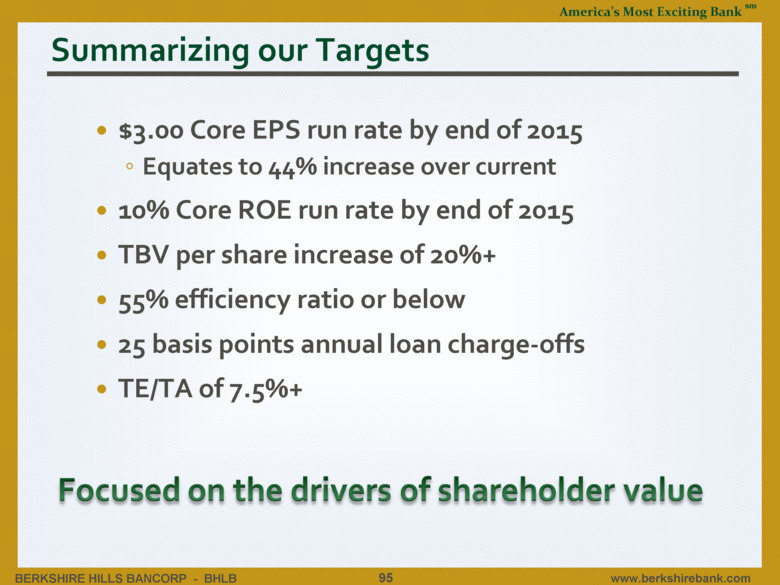
| Summarizing our Targets $3.00 Core EPS run rate by end of 2015 Equates to 44% increase over current 10% Core ROE run rate by end of 2015 TBV per share increase of 20%+ 55% efficiency ratio or below 25 basis points annual loan charge-offs TE/TA of 7.5%+ 95 |
| Why Invest in BHLB Shareholder return Growth and performance Record for results Experienced team Strong financial condition Higher market cap - increasing stock profile 100% buy ratings 96 |
| Q&A 97 |
| Non-GAAP Financial Measures This presentation references non-GAAP financial measures incorporating tangible equity and related measures, and core earnings excluding merger and other non-recurring costs. These measures are commonly used by investors in evaluating business combinations and financial condition. GAAP earnings are lower than core earnings primarily due to non-recurring merger and systems conversion related expenses. Reconciliations are in earnings releases at www.berkshirebank.com. 98 |
| If you have any questions, please contact: David Gonci P.O. Box 1308 Pittsfield, MA 01202 Investor Relations Officer (413) 281-1973 dgonci@berkshirebank.com Committed to the RIGHT core values: Respect Integrity Guts Having Fun Teamwork |
