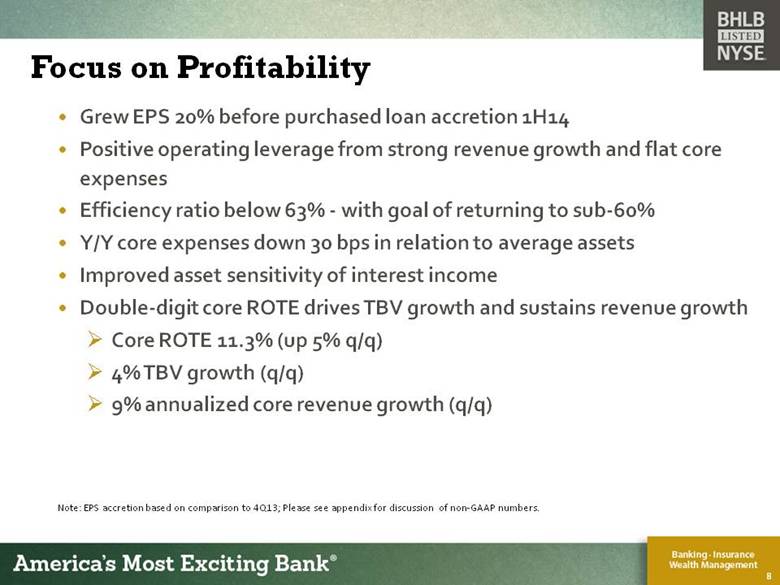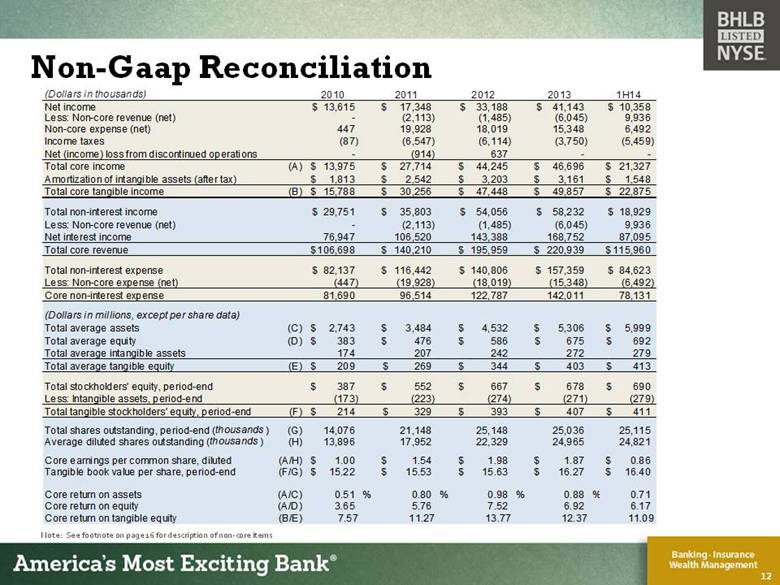
| Non-Gaap Reconciliation Note: See footnote on page 16 for description of non-core items 12 (Dollars in thousands) 2010 2011 2012 2013 1H14 Net income 13,615 $ 17,348 $ 33,188 $ 41,143 $ 10,358 $ Less: Non-core revenue (net) - (2,113) (1,485) (6,045) 9,936 Non-core expense (net) 447 19,928 18,019 15,348 6,492 Income taxes (87) (6,547) (6,114) (3,750) (5,459) Net (income) loss from discontinued operations - (914) 637 - - Total core income (A) 13,975 $ 27,714 $ 44,245 $ 46,696 $ 21,327 $ Amortization of intangible assets (after tax) 1,813 $ 2,542 $ 3,203 $ 3,161 $ 1,548 $ Total core tangible income (B) 15,788 $ 30,256 $ 47,448 $ 49,857 $ 22,875 $ Total non-interest income 29,751 $ 35,803 $ 54,056 $ 58,232 $ 18,929 $ Less: Non-core revenue (net) - (2,113) (1,485) (6,045) 9,936 Net interest income 76,947 106,520 143,388 168,752 87,095 Total core revenue 106,698 $ 140,210 $ 195,959 $ 220,939 $ 115,960 $ Total non-interest expense 82,137 $ 116,442 $ 140,806 $ 157,359 $ 84,623 $ Less: Non-core expense (net) (447) (19,928) (18,019) (15,348) (6,492) Core non-interest expense 81,690 96,514 122,787 142,011 78,131 (Dollars in millions, except per share data) Total average assets (C) 2,743 $ 3,484 $ 4,532 $ 5,306 $ 5,999 $ Total average equity (D) 383 $ 476 $ 586 $ 675 $ 692 $ Total average intangible assets 174 207 242 272 279 Total average tangible equity (E) 209 $ 269 $ 344 $ 403 $ 413 $ Total stockholders' equity, period-end 387 $ 552 $ 667 $ 678 $ 690 $ Less: Intangible assets, period-end (173) (223) (274) (271) (279) Total tangible stockholders' equity, period-end (F) 214 $ 329 $ 393 $ 407 $ 411 $ Total shares outstanding, period-end ( thousands ) (G) 14,076 21,148 25,148 25,036 25,115 Average diluted shares outstanding ( thousands ) (H) 13,896 17,952 22,329 24,965 24,821 Core earnings per common share, diluted (A/H) 1.00 $ 1.54 $ 1.98 $ 1.87 $ 0.86 $ Tangible book value per share, period-end (F/G) 15.22 $ 15.53 $ 15.63 $ 16.27 $ 16.40 $ Core return on assets (A/C) 0.51 % 0.80 % 0.98 % 0.88 % 0.71 Core return on equity (A/D) 3.65 5.76 7.52 6.92 6.17 Core return on tangible equity (B/E) 7.57 11.27 13.77 12.37 11.09 |


