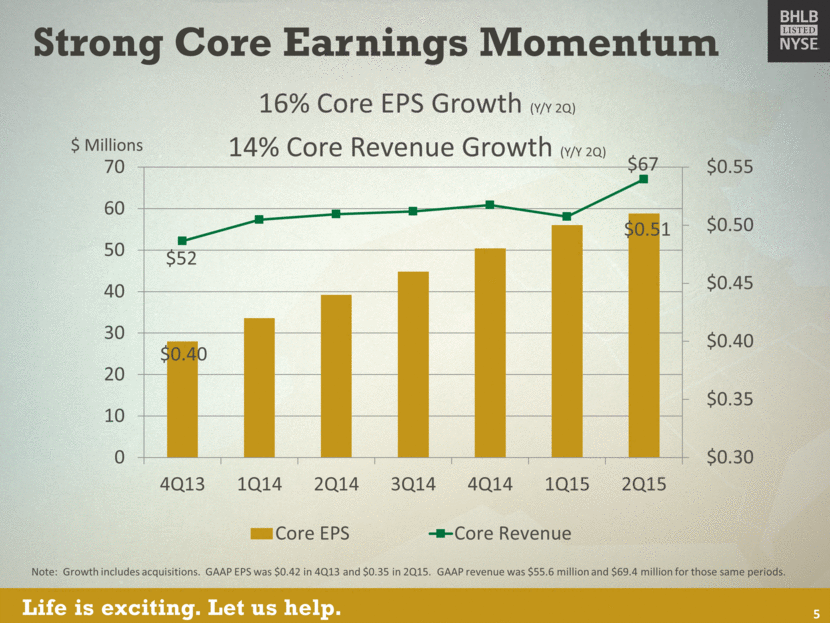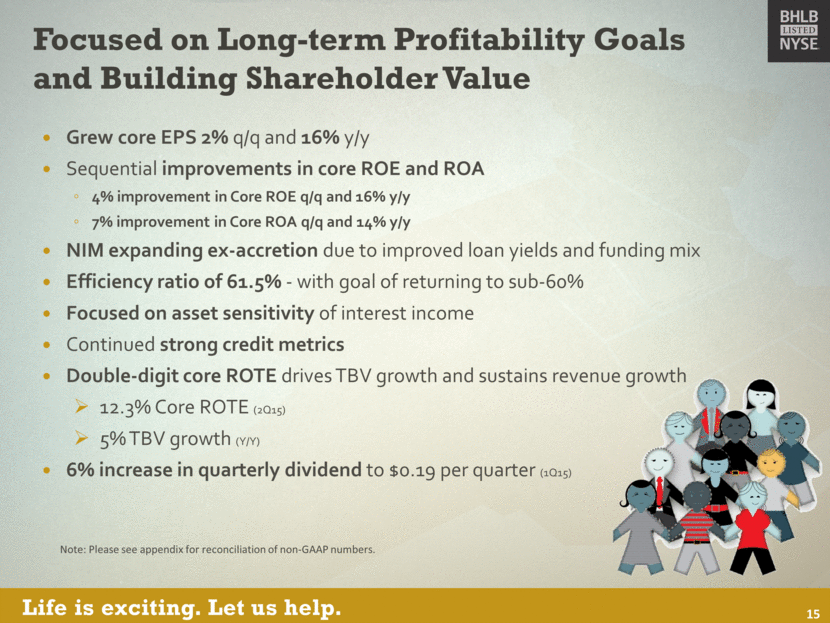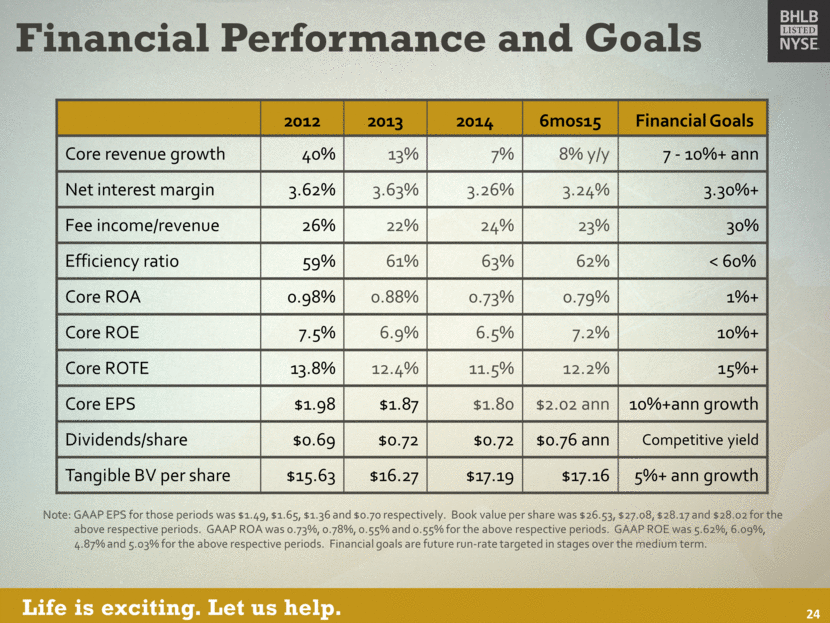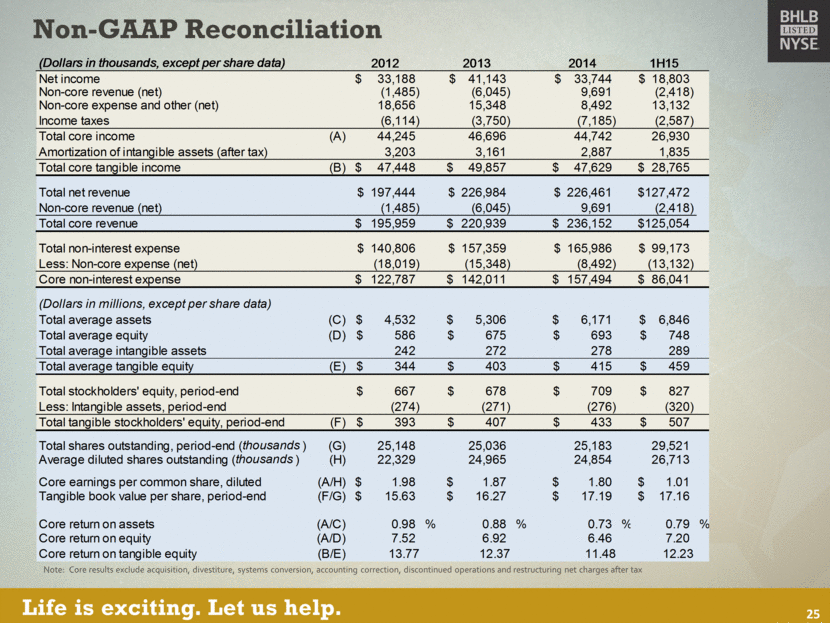
| Non-GAAP Reconciliation Note: Core results exclude acquisition, divestiture, systems conversion, accounting correction, discontinued operations and restructuring net charges after tax 25 (Dollars in thousands, except per share data) 2012 2013 2014 1H15 Net income 33,188 $ 41,143 $ 33,744 $ 18,803 $ Non-core revenue (net) (1,485) (6,045) 9,691 (2,418) Non-core expense and other (net) 18,656 15,348 8,492 13,132 Income taxes (6,114) (3,750) (7,185) (2,587) Total core income (A) 44,245 46,696 44,742 26,930 Amortization of intangible assets (after tax) 3,203 3,161 2,887 1,835 Total core tangible income (B) 47,448 $ 49,857 $ 47,629 $ 28,765 $ Total net revenue 197,444 $ 226,984 $ 226,461 $ 127,472 $ Non-core revenue (net) (1,485) (6,045) 9,691 (2,418) Total core revenue 195,959 $ 220,939 $ 236,152 $ 125,054 $ Total non-interest expense 140,806 $ 157,359 $ 165,986 $ 99,173 $ Less: Non-core expense (net) (18,019) (15,348) (8,492) (13,132) Core non-interest expense 122,787 $ 142,011 $ 157,494 $ 86,041 $ (Dollars in millions, except per share data) Total average assets (C) 4,532 $ 5,306 $ 6,171 $ 6,846 $ Total average equity (D) 586 $ 675 $ 693 $ 748 $ Total average intangible assets 242 272 278 289 Total average tangible equity (E) 344 $ 403 $ 415 $ 459 $ Total stockholders' equity, period-end 667 $ 678 $ 709 $ 827 $ Less: Intangible assets, period-end (274) (271) (276) (320) Total tangible stockholders' equity, period-end (F) 393 $ 407 $ 433 $ 507 $ Total shares outstanding, period-end ( thousands ) (G) 25,148 25,036 25,183 29,521 Average diluted shares outstanding ( thousands ) (H) 22,329 24,965 24,854 26,713 Core earnings per common share, diluted (A/H) 1.98 $ 1.87 $ 1.80 $ 1.01 $ Tangible book value per share, period-end (F/G) 15.63 $ 16.27 $ 17.19 $ 17.16 $ Core return on assets (A/C) 0.98 % 0.88 % 0.73 % 0.79 % Core return on equity (A/D) 7.52 6.92 6.46 7.20 Core return on tangible equity (B/E) 13.77 12.37 11.48 12.23 |

