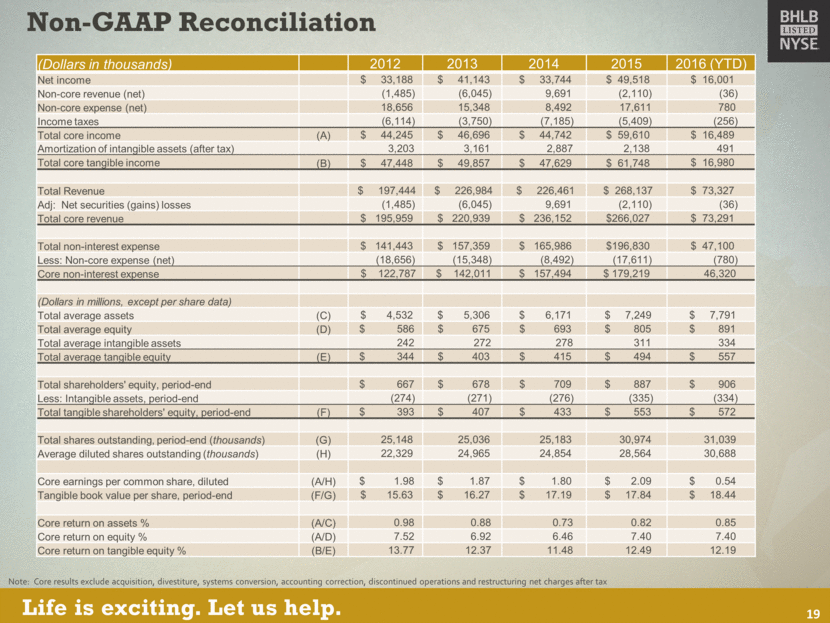
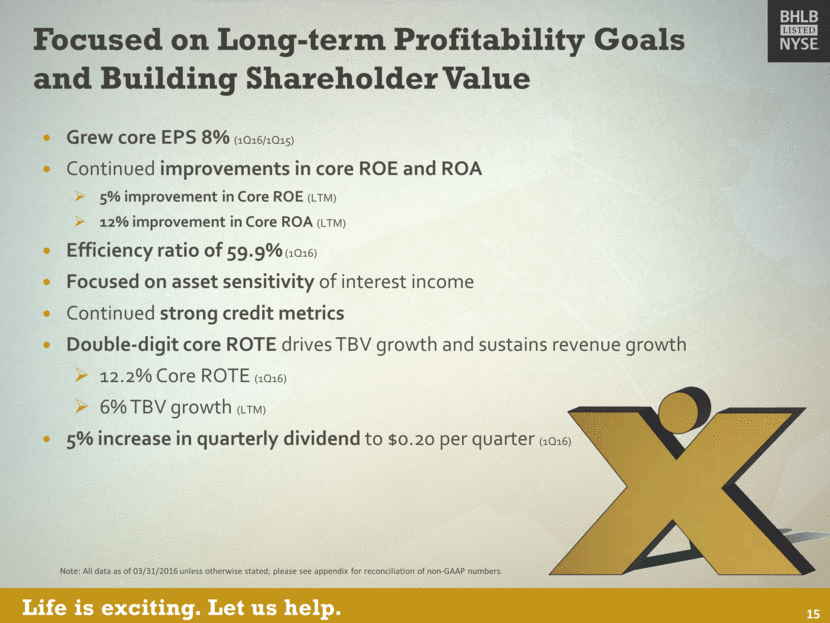
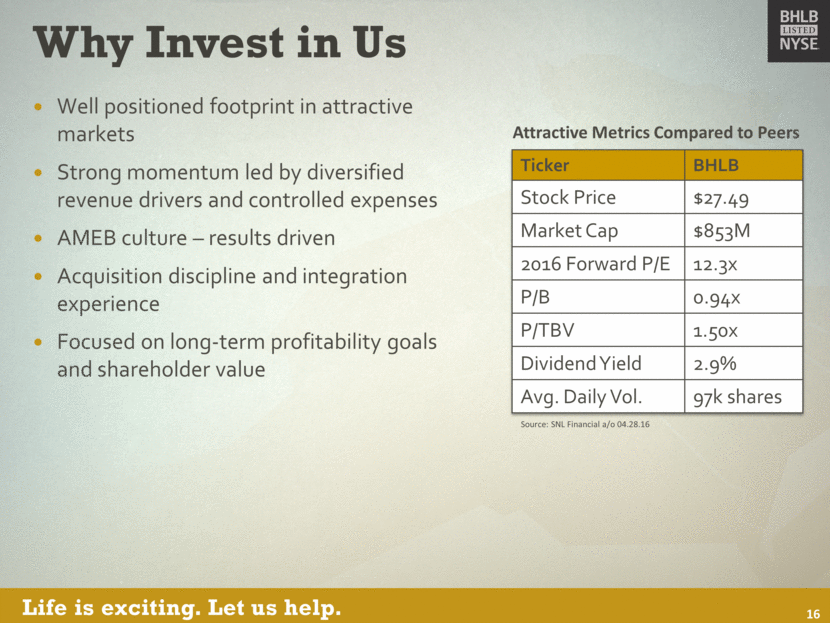
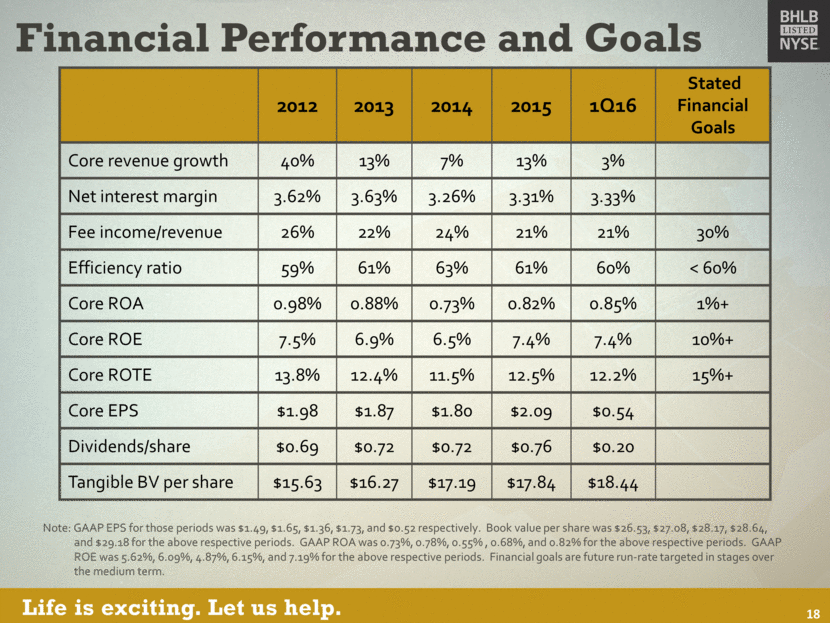
Non-GAAP Reconciliation Note: Core results exclude acquisition, divestiture, systems conversion, accounting correction, discontinued operations and restructuring net charges after tax 19 (Dollars in thousands) 2012 2013 2014 2015 2016 (YTD) Net income $ 33,188 $ 41,143 $ 33,744 $ 49,518 $ 16,001 Non-core revenue (net) (1,485) (6,045) 9,691 (2,110) (36) Non-core expense (net) 18,656 15,348 8,492 17,611 780 Income taxes (6,114) (3,750) (7,185) (5,409) (256) Total core income (A) $ 44,245 $ 46,696 $ 44,742 $ 59,610 $ 16,489 Amortization of intangible assets (after tax) 3,203 3,161 2,887 2,138 491 Total core tangible income (B) $ 47,448 $ 49,857 $ 47,629 $ 61,748 $ 16,980 Total Revenue $ 197,444 $ 226,984 $ 226,461 $ 268,137 $ 73,327 Adj: Net securities (gains) losses (1,485) (6,045) 9,691 (2,110) (36) Total core revenue $ 195,959 $ 220,939 $ 236,152 $266,027 $ 73,291 Total non-interest expense $ 141,443 $ 157,359 $ 165,986 $196,830 $ 47,100 Less: Non-core expense (net) (18,656) (15,348) (8,492) (17,611) (780) Core non-interest expense $ 122,787 $ 142,011 $ 157,494 $ 179,219 46,320 (Dollars in millions, except per share data) Total average assets (C) $ 4,532 $ 5,306 $ 6,171 $ 7,249 $ 7,791 Total average equity (D) $ 586 $ 675 $ 693 $ 805 $ 891 Total average intangible assets 242 272 278 311 334 Total average tangible equity (E) $ 344 $ 403 $ 415 $ 494 $ 557 Total shareholders' equity, period-end $ 667 $ 678 $ 709 $ 887 $ 906 Less: Intangible assets, period-end (274) (271) (276) (335) (334) Total tangible shareholders' equity, period-end (F) $ 393 $ 407 $ 433 $ 553 $ 572 Total shares outstanding, period-end (thousands) (G) 25,148 25,036 25,183 30,974 31,039 Average diluted shares outstanding (thousands) (H) 22,329 24,965 24,854 28,564 30,688 Core earnings per common share, diluted (A/H) $ 1.98 $ 1.87 $ 1.80 $ 2.09 $ 0.54 Tangible book value per share, period-end (F/G) $ 15.63 $ 16.27 $ 17.19 $ 17.84 $ 18.44 Core return on assets % (A/C) 0.98 0.88 0.73 0.82 0.85 Core return on equity % (A/D) 7.52 6.92 6.46 7.40 7.40 Core return on tangible equity % (B/E) 13.77 12.37 11.48 12.49 12.19
