 Keefe, Bruyette & Woods, Inc. Michael P. Daly President and Chief Executive Officer Boston, June 15, 2006 New York, June 16, 2006 Exhibit 99.1 |
 Cautionary Statement Statements contained in this presentation contain forward-looking statements within the meaning of the Private Securities Litigation Reform Act of 1995. These statements are based on the beliefs and expectations of management as well as the assumptions made using information currently available to management. Since these statements reflect the views of management concerning future events, these statements involve risks, uncertainties and assumptions. These risks and uncertainties include among others, changes in market interest rates and general and regional economic conditions, changes in government regulations, changes in accounting principles and the quality or composition of the loan and investment portfolios and other factors that may be described in Berkshire Hills Bancorp, Inc.’s quarterly reports on Form 10-Q for the quarters ended March 31, June 30 and September 30 and in its 2005 annual report on Form 10-K, each filed with the Securities and Exchange Commission, which are available at the Securities and Exchange Commission’s internet website (www.sec.gov) and to which reference is hereby made. Therefore, actual future results may differ significantly from results discussed in the forward-looking statements. You are cautioned not to place undue reliance on any forward-looking statements, which speak only as of June 15 and 16, 2006. Except as required by applicable law or regulation, Berkshire Hills Bancorp, Inc. undertakes no obligation to update any forward-looking statements, to reflect events or circumstances that occur after June 15 and 16, 2006. |
 3 “Transitioning to a Regional Bank” Fundamentals Culture and people Balance sheet growth Asset liability management Non-interest income growth Efficiencies Asset quality Capital allocation |
 4 “Transitioning to a Regional Bank” Culture and People Attract and retain the best people Strengthen team, stay focused, stretch, pay for performance Continually strengthen board Instill culture of enthusiasm, teamwork and energy “Recognizing the people within our organization and giving our employees the latitude to make decisions and become part of the equation translates into better customer service. When people want to come to work, they are energetic and engaged. You can’t fake that kind of commitment.” CEO Michael P. Daly — VBO Magazine |
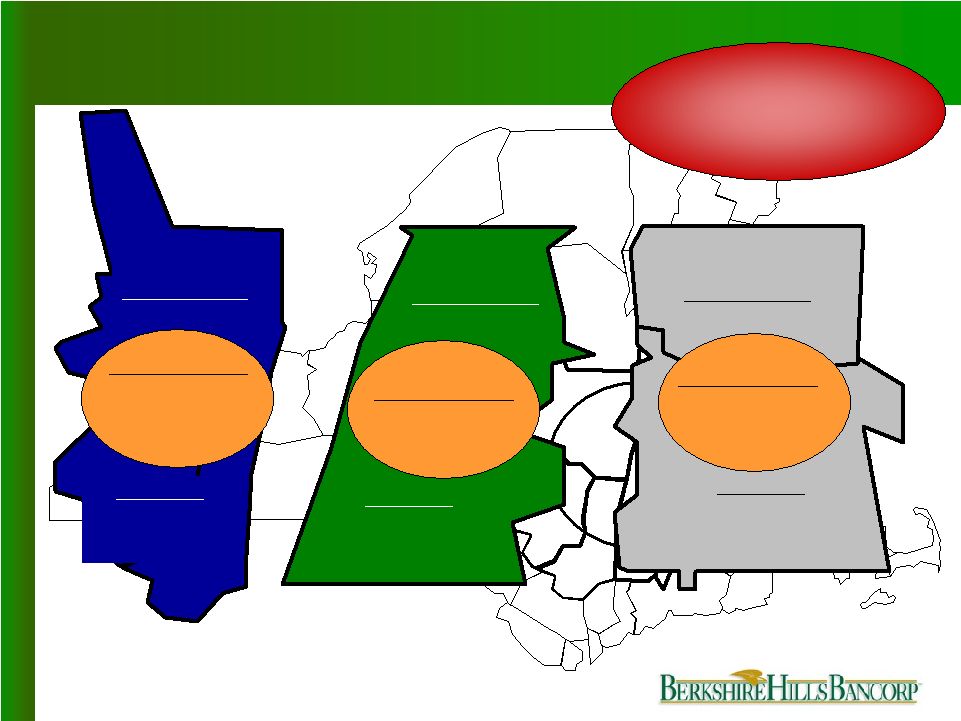
 5 “Transitioning to a Regional Bank” State chartered savings bank with commercial bank balance sheet Ownership profile – March 31, 2006 Institutional holders 37% Insiders* 10% Individuals 47% Foundation 6% Corporate profile – March 31, 2006 Market capitalization $300 million Assets $2.1 billion Loans $1.44 billion Deposits $1.45 billion Employees 414 FTE’s Operations 24 full-service branches 10 free standing ATMs *Not including options Profile Berkshire County, MA Pioneer Valley, MA Capital Region, NY |
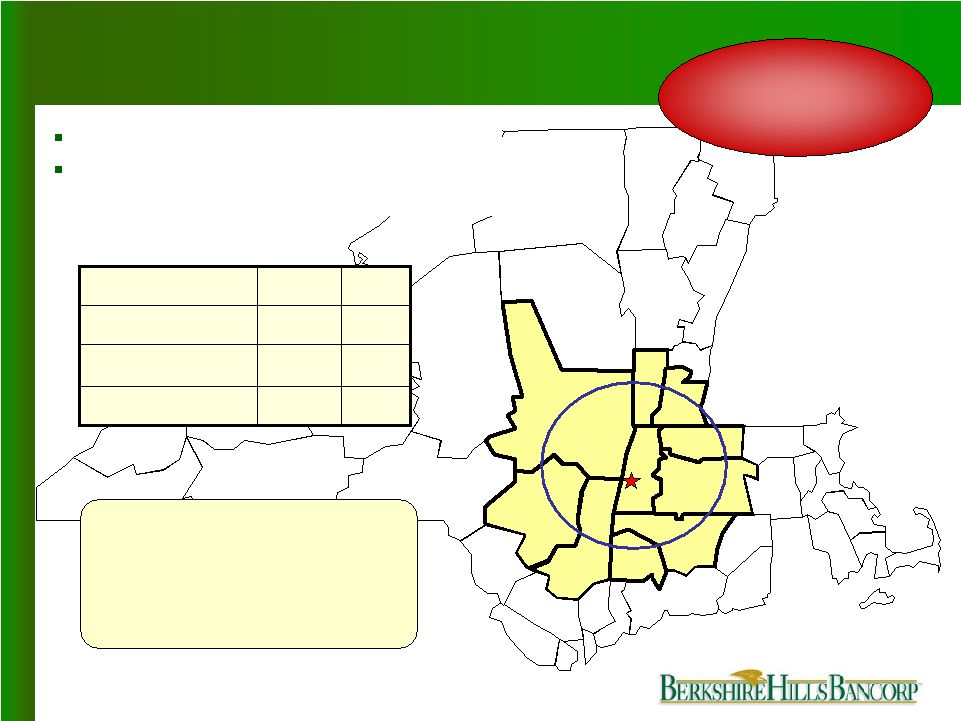
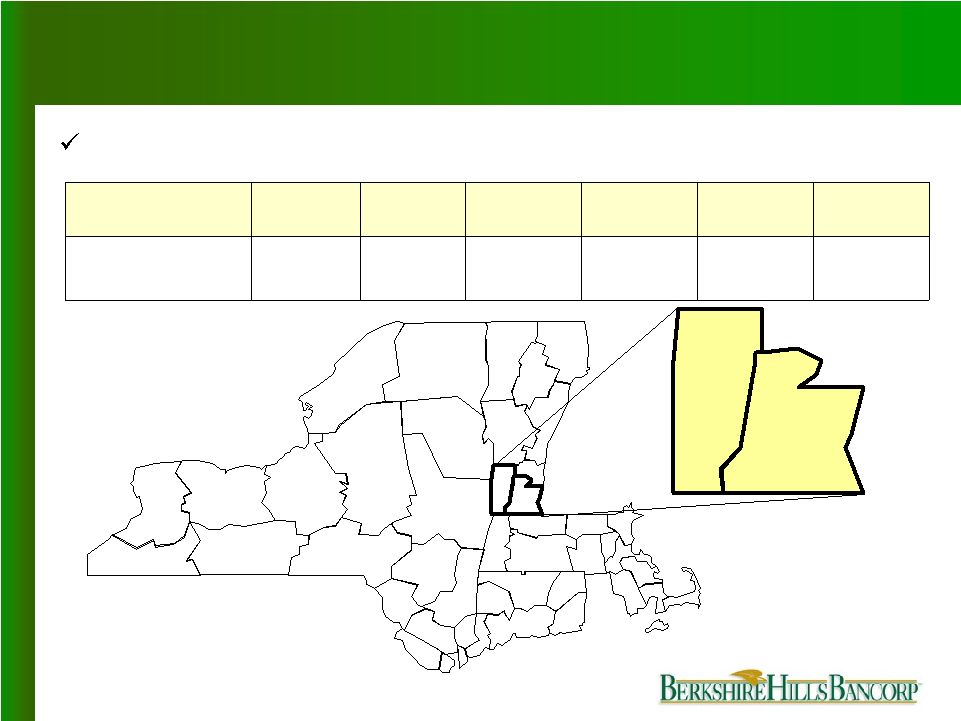
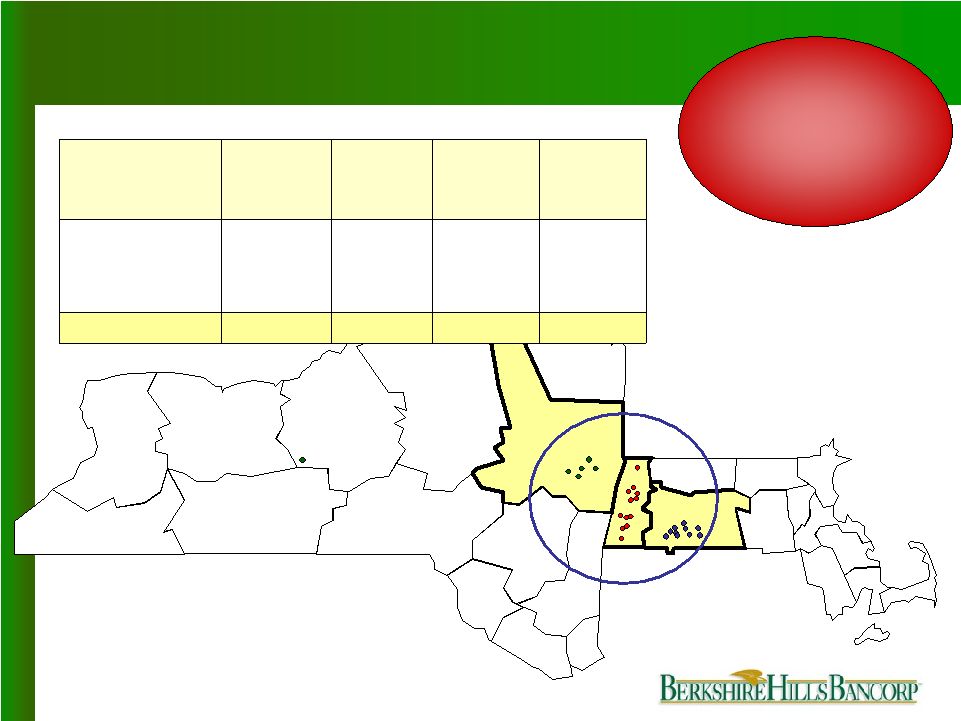 6 “Transitioning to a Regional Bank” $1,451 $67 $511 $873 3/31/06 Deposits (millions) 24 3 10 11 12/31/05 Branches $41 6 New York State $1,371 27 Total 12/31/05 Deposits (millions) 6/15/06 Branches Market 10 11 $473 $857 Pioneer Valley Berkshire County Primary Market Area Our values will drive our success in expanded markets |
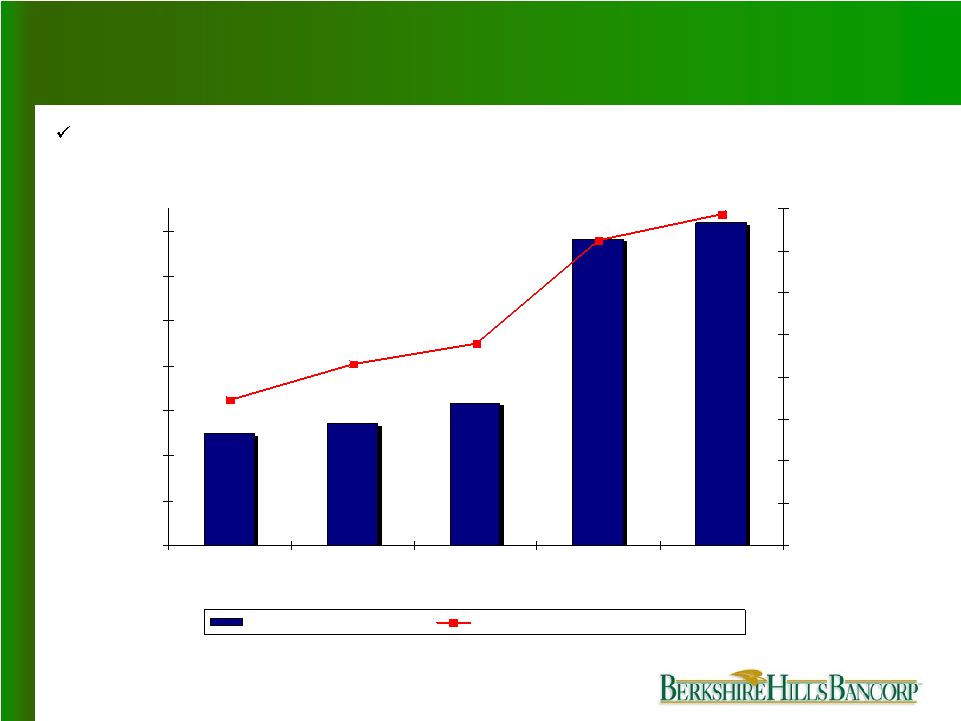
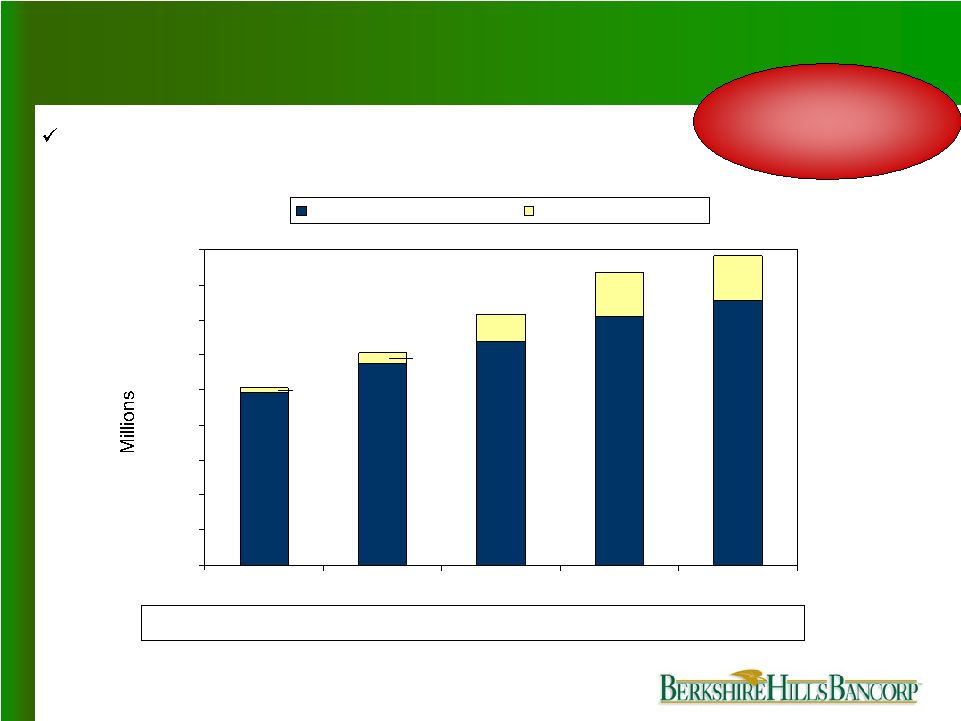
 7 “Transitioning to a Regional Bank” Total Deposit Growth 7% CAGR prior to expanded market 63% 61% 58% 56% 58% 24% 23% 21% 22% 22% 20% 19% 16% 17% 19% $0 $200 $400 $600 $800 $1,000 $1,200 $1,400 $1,600 $1,800 2002 2003 2004 2005 3/31/2006 Core Time <$100 Time >$100 $830 $782 $846 $1,371 $1,451 21% Total deposit compound annual growth rate 7% Total deposit compound annual growth rate excluding Woronoco Note: Core excludes all time accounts and gross core excludes time accounts over $100M. 81% 83% 84% 81% 80% |
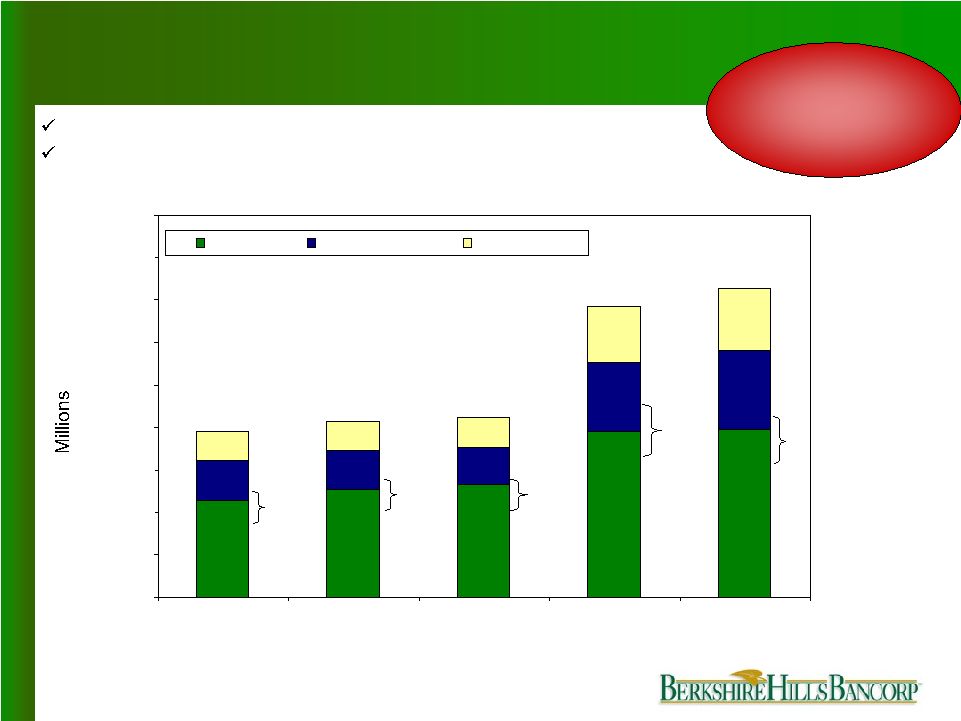
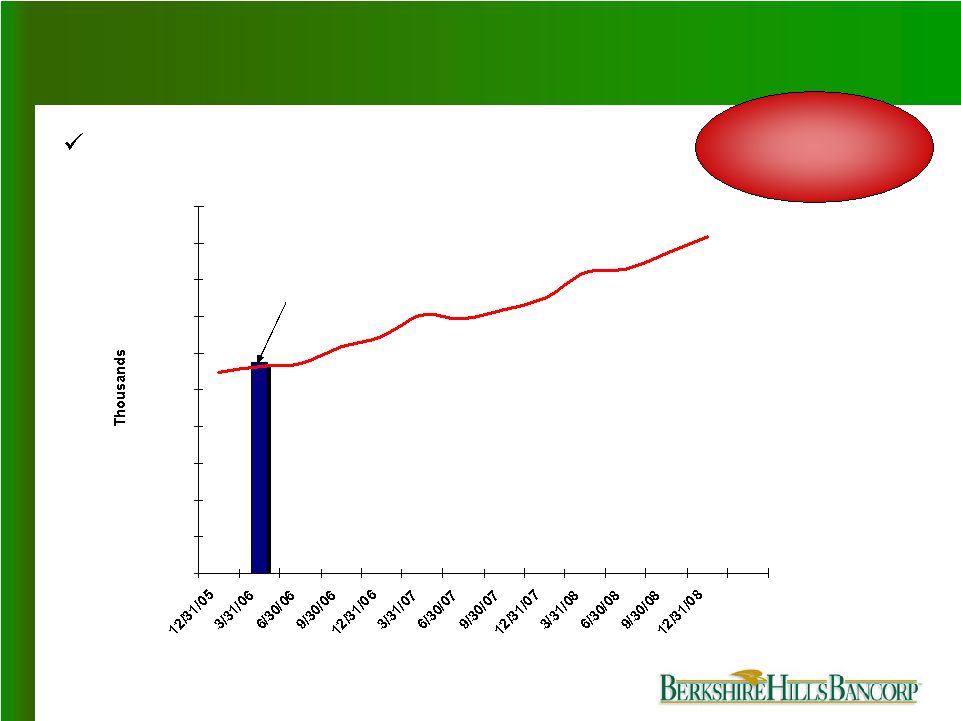
 8 “Transitioning to a Regional Bank” Total Deposits – Actual vs. Plan 13% 15% 13% Plan CAGR through 2008 $1,134 11% $817 $796 Total core $1,662 20% $1,160 $1,104 Total gross core $2,000 23% $1,451 $1,371 Total deposits Plan 12/31/2008 Annualized growth 1Q2006 Actual 3/31/2006 Actual 12/31/2005 Millions 23% Total deposits annualized growth through 3/31/06 13% CAGR 2005 - 2008 |
 9 “Transitioning to a Regional Bank” Total Loan Growth Relationship building 41% 40% 50% 47% 45% 38% 39% 28% 34% 33% 22% 19% 22% 21% 21% $0 $200 $400 $600 $800 $1,000 $1,200 $1,400 $1,600 2002 2003 2004 2005 3/31/2006 Commercial Residential Consumer $1,416 $723 $792 $828 $1,449 24% Total loan compound annual growth rate 9% Total loan compound annual growth rate excluding Woronoco and mortgage securitizations 12% Total commercial loan compound annual growth rate excluding Woronoco |
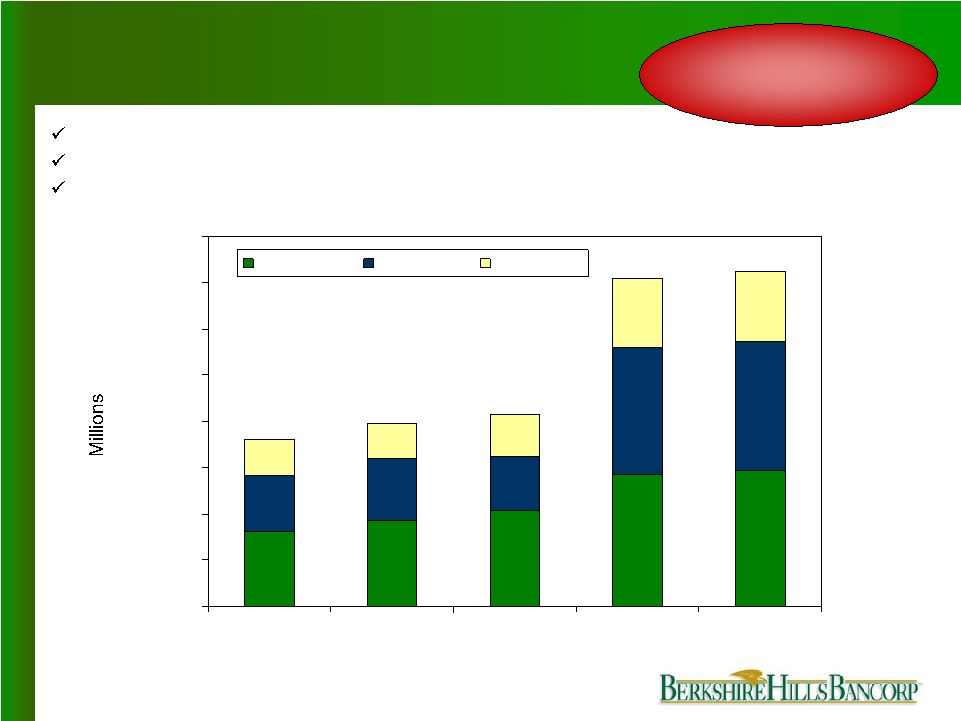
 10 “Transitioning to a Regional Bank” Total Loans – Actual vs. Plan 19% CAGR 2005-2008 9% Total loans annualized growth through 3/31/06 13% $792 4% $556 $549 Residential 25% 16% 19% Plan CAGR through 2008 $1,110 14% $589 $570 Commercial $459 9% $304 $297 Consumer $2,361 9% $1,449 $1,416 Total loans Plan 12/31/2008 Annualized growth 1Q2006 Actual 3/31/2006 Actual 12/31/2005 Millions |
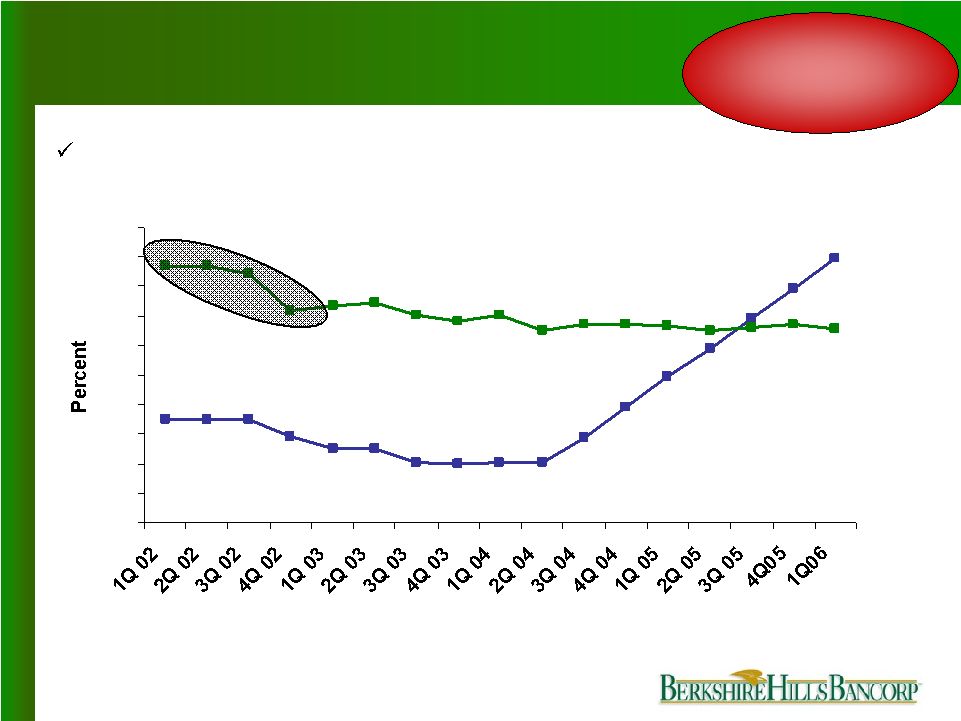   11 “Transitioning to a Regional Bank” Stable margins against rising rates and flattening yield curve Asset Liability Management 1.01 1.25 3.27 3.26 3.73 4.36 1.74 2.94 4.47 3.26 0 0.5 1 1.5 2 2.5 3 3.5 4 4.5 5 Net Interest Margin Effective Fed Funds Sub-Prime Sale Effective interest rate risk management |
 12 “Transitioning to a Regional Bank” $4,998 $5,431 $14,376 $13,660 $6,362 10.91% 12.63% 18.50% 13.62% 19.75% $0 $2,000 $4,000 $6,000 $8,000 $10,000 $12,000 $14,000 2002 2003 2004 4Q05 Annualized 1Q06 Annualized 4.00% 6.00% 8.00% 10.00% 12.00% 14.00% 16.00% 18.00% 20.00% NII ex. of security gains NII ex security gains/Total income Main drivers of non-interest income: wealth management, insurance, loan service and customer service fees Non-Interest Income – Historic Growth |
 13 “Transitioning to a Regional Bank” Non-Interest Income – Actual vs. Plan 19% CAGR 2005-2008 21% Annualized growth through 3/31/06 $22,926 $18,735 $16,162 $13,660 $0 $2,500 $5,000 $7,500 $10,000 $12,500 $15,000 $17,500 $20,000 $22,500 $25,000 Actual $14,376 Note: Quarterly income annualized, exclusive of security gains |
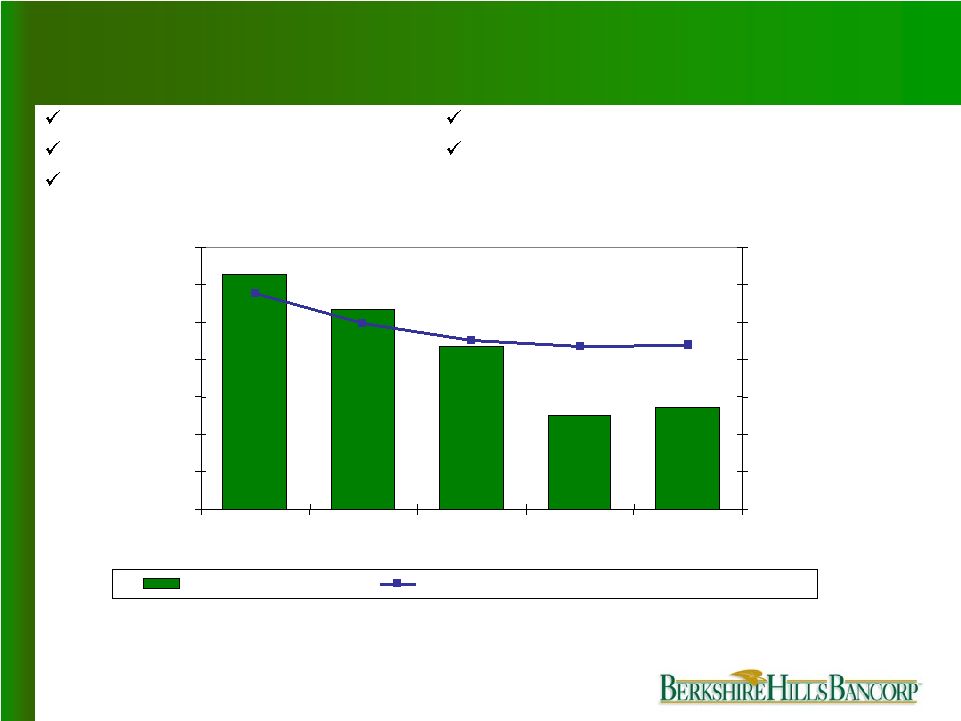 14 “Transitioning to a Regional Bank” Operating Efficiencies Reorganization Sale of sub-prime loans Sale of EastPoint Technologies (1) Exclusive of merger and conversion expenses, other non-recurring items, and amortization of intangible assets (2) Exclusive of merger and conversion expenses and other non-recurring items Achieved 37% cost saves - WRO acq Six Sigma 57.48% 57.03% 60.66% 62.73% 64.55% 2.20% 2.18% 2.25% 2.49% 2.89% 52.00% 54.00% 56.00% 58.00% 60.00% 62.00% 64.00% 66.00% 2002 2003 2004 2005 1Q2006 0.00% 0.50% 1.00% 1.50% 2.00% 2.50% 3.00% 3.50% Efficiency ratio (1) Non-Interest expense/ Average assets (2) |
     15 “Transitioning to a Regional Bank” Maintaining Operating Efficiencies Established “Office of Process Improvement” Six Sigma established as the primary tool Hired 2 certified Black Belts 11 employees certified as Green Belts 9 additional Green Belt candidates in progress Primary focus on improving customer satisfaction levels Profitability |
 16 “Transitioning to a Regional Bank” Asset Quality Reduce credit risk Portfolio well protected… Positioned for growth 2.22% 2.22% 2.21% 2.02% 2.04% C&I Allowance/Loans 0.90% 0.92% 1.13% 1.13% 1.43% Total Allowance/Loans 0.07% 10.96X% 1.44% 0.08% $1,186 2005 0.15% 8.10X% 1.47% 0.14% $1,152 2004 0.35% 2.80X% 1.43% 0.40% $3,199 2003 0.87% 2.76X% 1.17% 0.72% $5,241 2002 0.06% 14.42X% 1.40% 0.06% $908 1Q2006 NCOs/avg. loans (annualized) Allowance/NPLs CRE Allowance/loans NPAs/loans + REO NPAs (000s) |
 17 “Transitioning to a Regional Bank” Expansion Woronoco acquisition De novo branches Fee income Divested sub-prime auto loans 2000 - 2003 Divested technology company 2004 Stock buybacks Strategic Capital Allocation Invested for future growth and returned capital to shareholders |
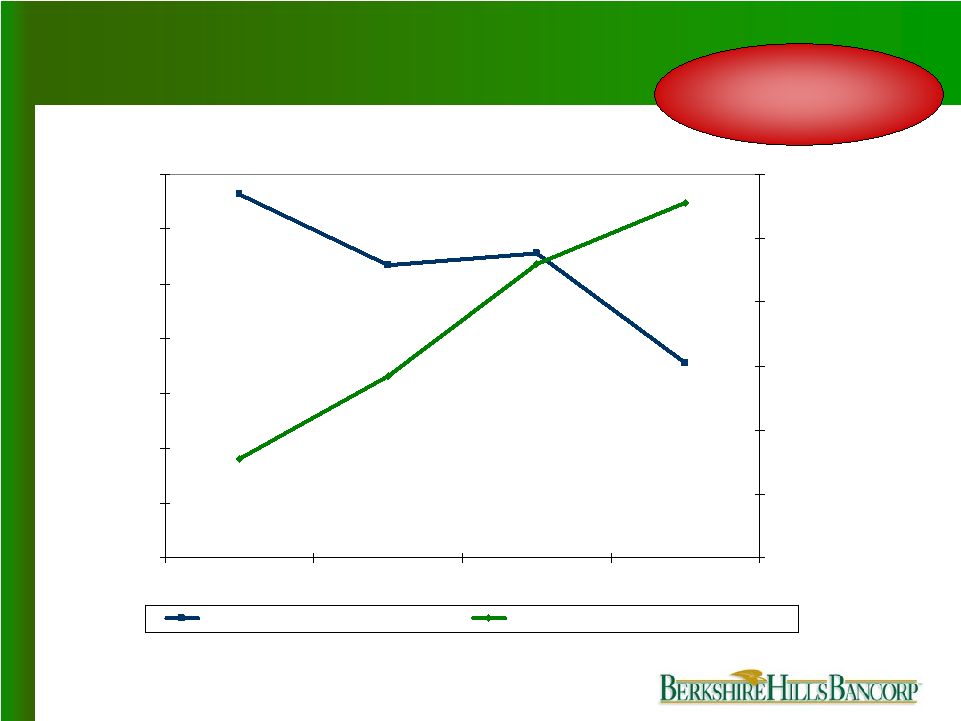 18 “Transitioning to a Regional Bank” Strategic Capital Allocation Effectively employed excess capital 10.63% 7.56% 9.35% 9.55% $1.31 $1.57 $2.11 $1.92 4.00% 5.00% 6.00% 7.00% 8.00% 9.00% 10.00% 11.00% 2002 2003 2004 2005 $1.00 $1.20 $1.40 $1.60 $1.80 $2.00 $2.20 Tangible equity/tangible assets Core diluted earnings per share core |
 19 “Transitioning to a Regional Bank” Where We Are Now 57.48 57.00 60.66 62.73 64.55 Efficiency ratio % 3/31/06* 12/31/05* 2004 2003 2002 3.36 7.89 13.49 0.96 1.02 0.98 0.87 0.81 0.76 Core Tangible ROA % 7.64 9.06 7.28 1.54 ROE 0.94 0.89 0.80 0.20 ROA 3.61 7.97 Key Measures ** *Annualized **Please see appendix for reconciliation of non-GAAP financial measures 3.27 3.37 4.18 Net interest margin (FTE)% 12.63 9.36 6.28 Core Tangible ROE % Successful turnaround |
 20 “Transitioning to a Regional Bank” Competition Regional bank niche opportunity Capital Region Under $1.5 Billion 48 banks & CUs $30 Billion + 6 - B of A, Citizens HSBC, Key, M&T, & Banknorth $1.5 - $30 Billion 4 – First Niagara, NBT, Trustco & Berkshire Bank Berkshire County Under $1.5 Billion 19 banks & CUs $30 Billion + 2- Citizens & Banknorth $1.5 - $30 Billion 1 – Berkshire Bank Pioneer Valley Under $1.5 Billion 39 banks & CUs $30 Billion + 4 – B of A, Citizens, Sovereign & Banknorth $1.5 - $30 Billion 2 – Chittenden & Berkshire Bank |
 21 “Transitioning to a Regional Bank” $4,000 $3,500 $800 Mortgage originations (2004) (millions) 2,801 3,185 2,418 Population/ branch $13,900 $9,100 $2,700 Deposits 6/05 (millions) 3.46% 2.23% -1.65% 5 Year projected growth $49,634 618 Pioneer Valley Capital Region Berkshire County $46,954 133 $51,351 818 Median HH income Population (000s) Regional growth opportunity Retail Banking Opportunities in contiguous markets |
 22 “Transitioning to a Regional Bank” Regional Growth Extend our success beyond Berkshire County Market area includes multi-state region Building market share in attractive, under-served markets 0 11 >$30 billion 2 11 $1.5 - $30 billion 157 74 <$1.5 billion C/Us Banks # of Regional Banks with headquarters in this market: 1 Berkshire Bank |
 23 “Transitioning to a Regional Bank” Retail Banking – Deposit Gathering Double number of branches by 2008 De novo branching Only regional bank headquartered in expanded market area v 27 11 10 6 6/15/06 30 11 10 9 12/31/06 Plan 50 24 Total 11 11 Berkshire County 10 3 12/31/05 18 Pioneer Valley 21 New York 12/31/08 Plan Projected Yr End |
 24 “Transitioning to a Regional Bank” Retail Banking – Deposit Gathering Strategy and goals Maintain Berkshire County dominance Branding Centers of influence Improve calling effort Municipal banking Deposit insurance fund Double Pioneer Valley market share Gain 3% market share in Capital Region |
 25 “Transitioning to a Regional Bank” Retail Banking - Deposit Gathering 13% $2,000 $1,451 $1,371 Total 102% $338 $ 67 $ 41 New York State $748 $914 Plan Deposits 2008 (millions) $511 $873 Deposits 3/31/06 (millions) Plan CAGR through 2008 Deposits 12/31/05 (millions) Market $473 $857 17% 2% Pioneer Valley Berkshire County Regional growth 13% CAGR 83% 80% 81% Gross core dep/Total dep 15% $1,662 $1,160 $1,104 Gross core deposits (Excludes CDs >100M) |
 26 “Transitioning to a Regional Bank” Retail Banking - Mortgages 12% $781 $556 $549 Total 92% 10% 4% $141 $361 $291 $21 $263 $20 $272 $271 Plan Mortgages 2005-2008 (millions) 3/31/06 (millions) Plan CAGR through 2008 Mortgages 12/31/05 (millions) Market $258 Capital Region Pioneer Valley Berkshire County Regional growth 12% CAGR |
 27 “Transitioning to a Regional Bank” Retail Banking - Mortgages Strategy and goals Engage branch personnel Triple outside origination staff Capitalize on second home market and metropolitan relocation |
 28 “Transitioning to a Regional Bank” Retail Banking – Consumer Lending 10% $169 $129 $128 Total 126% 4% 6% $23 $71 $75 $4 $60 $2 $65 $63 Plan Equity Lines 2005-2008 (millions) 3/31/06 (millions) Plan CAGR through 2008 Equity Lines 12/31/05 (millions) Market $63 Capital Region Pioneer Valley Berkshire County Equity Lines Regional growth 10% CAGR |
 29 “Transitioning to a Regional Bank” Retail Banking – Real Estate Loan Quality 0.02% 0.23% Delinquency 3/31/06 0.14% 0.22% Average delinquency 2005 55% 61% Average LTV 728 None None Mortgages HELOCs 756 Average FICO 2004 – 2005 None Losses 2000 – 2005 None Uninsured LTV > 80% Strong loan quality Maintain credit standards |
 30 “Transitioning to a Regional Bank” 19% Albany 20% Pittsfield 20% Springfield 44% Long Island 43% Cape Cod % Overvalued Market Overvalued Real Estate * Source National City Bank 1 st Qtr 2006 Credit risk partially protected from bubble Retail Banking - Mortgages Berkshire Bank average down payment 37% |
 31 “Transitioning to a Regional Bank” Indirect Auto Regional growth opportunity Retail Banking - Consumer Lending 20 60 35 34 Active BHLB Dealers 2008 23% 36% 8% 78% Penetration 3/31/06 27% 17 73 Southern Vermont 45% 48 132 Capital Region 29% 94% Penetration 2008 10 28 Active BHLB Dealers 3/31/06 # of Dealers Market 122 36 Pioneer Valley Berkshire County Opportunity in contiguous markets |
 32 “Transitioning to a Regional Bank” Retail Banking - Consumer Lending Strategy and goals Use brand Benefit from Six Sigma principles Response in 30 minutes Payments to dealers same day Call program on high quality dealers Utilization of branch network Continue personal contact…people dealing with people Absolutely no subprime loans |
 33 “Transitioning to a Regional Bank” Retail Banking - Consumer Lending Maintain credit standards Indirect Lending Maintain credit quality Sub-prime loans since 2001: None Average FICO of portfolio: 716 Average FICO 2005 originations: 732 Losses 2005: 0.43% Average delinquency 2005: 0.45% Delinquency 3/31/06: 0.35% |
 34 “Transitioning to a Regional Bank” Commercial Banking Why we have been successful Only regional bank headquartered in primary market area Not a priority for large banks Smaller banks have been acquired Mid-cap borrowers prefer local relationship Community involvement leads to business Corporate commitment to commercial banking Growth plan Maintain dominance in Berkshire County Opportunity from Woronoco acquisition Robust growth in Capital Region – Tech Valley growth initiative Regional presence in adjacent markets with quality leadership Established consistent growth in underserved markets |
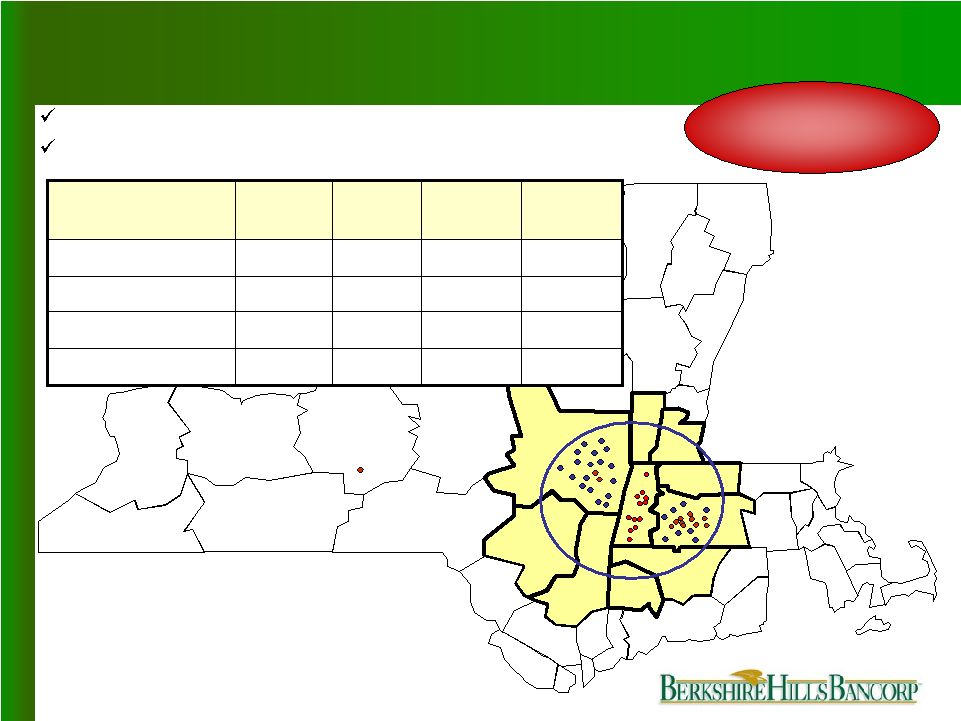
 35 “Transitioning to a Regional Bank” 1% 3% 35% BHLB estimated market share $85 $128 $357 BHLB commercial loans (millions) 12/31/05 $47,926 $32,216 $7,781 Total business revenues (millions) $4,250 23,736 Pioneer Valley Capital Region Berkshire County $1,025 6,984 $6,300 31,434 Estimated commercial loans (millions) Total businesses Commercial Banking Regional growth opportunity Opportunity in contiguous markets |
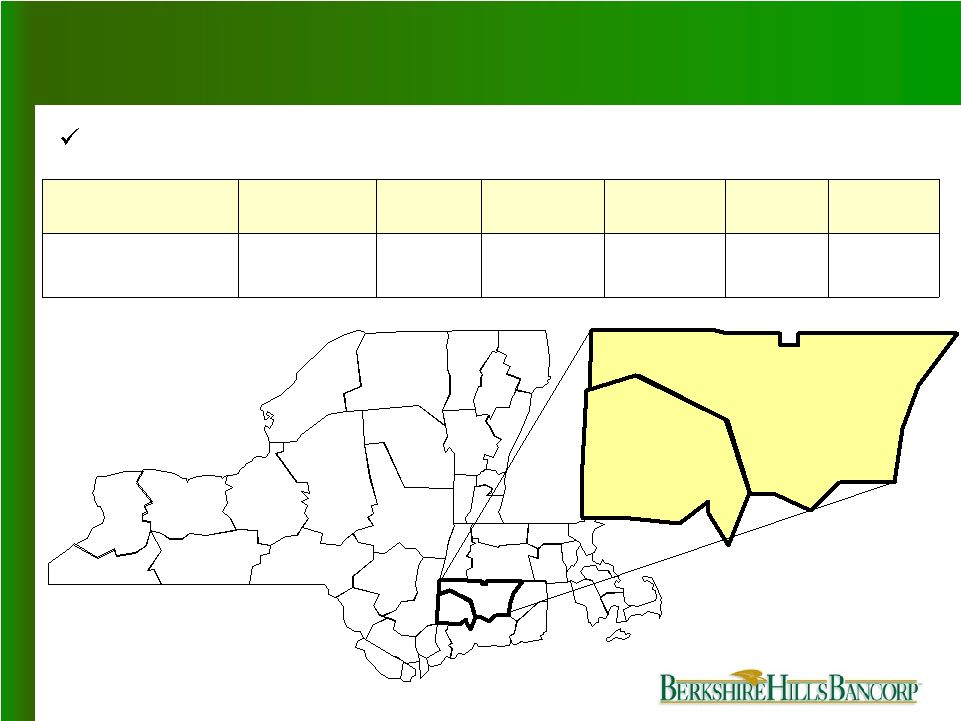 36 “Transitioning to a Regional Bank” Deposits (billion) Sales (billion) Businesses Median HH Income Projected Growth Population (000s) Market $76.9 $7.7 $19.1 $2.7 50,207 6,984 2.74% -1.65% 1,039 133 $60,534 $46,954 Northern Connecticut Berkshire County Potential growth in northern Connecticut Commercial Banking |
 37 “Transitioning to a Regional Bank” Deposits (billion) Sales (billion) Businesses Median HH Income Projected Growth Population (000s) Market $5.3 $7.7 $1.5 $2.7 5,241 6,984 1.07% -1.65% 81 133 $43,769 $46,954 Southern Vermont Berkshire County Commercial Banking Potential growth in southern Vermont |
 38 “Transitioning to a Regional Bank” Commercial Banking 25% $1,109 $589 $570 Totals 60% 29% $345 $275 $100 $133 $489 Plan Commercial Loans 2008 (millions) $356 3/31/06 (millions) 11% Plan CAGR through 2008 Commercial Loans 12/31/05 (millions) Market $85 $128 $357 Capital Region Pioneer Valley Berkshire County 13% Annualized growth through 3/31/06 25% CAGR |
 39 “Transitioning to a Regional Bank” Wealth Management Asset Growth Consistent growth and investment results $246 $288 $378 $39 $355 $319 $63 $63 $15 $7 $0 $50 $100 $150 $200 $250 $300 $350 $400 $450 2002 2003 2004 2005 1Q06 Asset Management/Trust Investment services Assets under management compounded growth rate = 19% $418 $253 $303 $358 Total $441 |
 40 “Transitioning to a Regional Bank” Wealth Management Client centered/consultative wealth management relationship Financial planning platform with 5 CFPs Investment management capabilities are not outsourced Credible investment results – 10 year history Emphasis on personal investment management “Trust” department credibility Strategy and goals Key to our strategy going forward |
 41 “Transitioning to a Regional Bank” Wealth Management 24% $795 $441 $418 Total $186 $84 $525 Plan AUM 2008 (millions) $13 $32 $396 3/31/06 (millions) Plan Growth through 2008 AUM 12/31/05 (millions) Market $2 $23 $393 110% 38% 11% Capital Region Pioneer Valley Berkshire County 22% Annualized growth AUM through 3/31/06 24% CAGR |
 42 “Transitioning to a Regional Bank” Insurance – An Emerging Business Referral source of over 400 people Captive audience with existing customers Qualified leads through lending activities Additional lines of business Life Disability Health Expect 15 - 20% pretax profit margin within 3 years Overview |
 43 “Transitioning to a Regional Bank” Remain well capitalized Execute de novo branching and commercial banking strategy without raising capital Capital alternatives Trust preferred Subordinated debt Capital Management 10.7% 7.8% 7.6% 3/31/2006 10.1% 11.1% Total risk based capital (bank) 7.4% 7.8% Tier 1 leverage capital (bank) 7.0% 7.6% Tangible equity/assets ProForma 12/31/08 12/31/2005 |
 44 “Transitioning to a Regional Bank” Wrap up Financial Highlights 0.96% 0.94% 0.96% Return on assets 9.41% 7.64% 7.89% Return on equity 3.27% 57.48% 0.98% 12.63% 3/31/06 1.03% 1.02% Core return on tangible assets 3.36% 57.00% 13.49% Actual 12/31/05 Annualized Plan 12/31/08 3.49% Net interest margin 57.62% Efficiency ratio 14.10% Core return on tangible equity Note: See Appendix for reconciliation of non-GAAP financial measures. |
 45 “Transitioning to a Regional Bank” Wrap up Core EPS Growth Historic compound annual core diluted EPS growth 2002 – 2005 17% Proforma annual core diluted EPS growth accelerating to 18% in 2008 Note: Proforma growth does not include any significant acquisitions, which would be expected to be accretive to EPS growth. |
 46 “Transitioning to a Regional Bank” Wrap up Strategic Highlights Summary Significant organic growth Double branch network size Double commercial loans Double size of wealth management Emerging insurance business 68% increase in non-interest income 46% increase in deposits 55% increase in consumer loans 44% increase in mortgages |
 Keefe, Bruyette & Woods, Inc. June 15 - 16, 2006 For questions, please contact: Wayne F. Patenaude CFO (413) 236-3195 wpatenaude@berkshirebank.com Company website: www.berkshirebank.com |
 48 “Transitioning to a Regional Bank” Appendix |
 Years ended December 31 ($ in thousands) Q4 2005 2004 2003 2002 Net income 4,838 $ 11,509 $ 8,965 $ 2,097 $ Less: Gain on sale of securities, net (882) (1,402) (3,077) (15,143) Plus: Termination of ESOP 168 - - 10,702 Plus: Merger and conversion expense 352 - - - Plus: Sale of sub-prime auto loans - - 1,854 - Plus: Other, net - 653 754 9,155 Adj: Income taxes 119 262 360 962 Core income (A) 4,595 11,022 8,856 7,773 Plus: Amort. Intang. Assets (net of taxes) 313 64 132 132 Tangible core income (B) 4,908 $ 11,085 $ 8,988 $ 7,905 $ Total non-interest income 4,297 $ 7,764 $ 6,448 $ 6,427 $ Less: Gain on sale of securities, net (882) (1,402) $ (3,077) $ (15,143) $ Plus: Other - - 2,060 13,704 Total core non-interest income (C) 3,415 $ 6,362 $ 5,431 $ 4,988 $ Total non-interest expense 11,800 $ 28,977 $ 28,243 $ 37,279 $ Less: Termination of ESOP (168) - - - Less: Merger and conversion expense (352) - - - Less: Other - - (408) (6,900) Core non-interest expense (D1) 11,280 28,977 27,835 $ 30,379 $ Less: Amortization of intangible assets (481) (98) (203) (203) Total core tangible non-interest expense (D2) 10,799 $ 28,879 $ 27,632 $ 30,176 $ Total average assets (E) 2,032,098 $ 1,289,500 $ 1,115,800 $ 1,051,800 $ Less: Average intangible assets (99,862) (8,700) (10,300) (10,300) Total average tangible assets (F) 1,932,236 $ 1,280,800 $ 1,105,500 $ 1,041,500 $ Total average stockholders' equity (G) 246,307 $ 127,100 $ 123,100 $ 136,200 $ Less: Average intangible assets (99,862) (8,700) (10,300) (10,300) Total average tangible stockholders' equity (H) 146,445 $ 118,400 $ 112,800 $ 125,900 $ Core return on tangible assets - annualized (B/F) 1.02 % 0.87 % 0.81 % 0.76 % Core return on tangible equity - annualized (B/H) 13.49 9.36 7.97 6.28 Efficiency ratio 57.14 60.66 62.73 64.55 Efficiency Ratio: is computed by dividing total tangible core non-interest expense by the sum of total net interest income on a fully taxable equivalent basis and total core non-interest income. The Company uses this non-GAAP measure, which is used widely in the banking industry, to provide important information regarding its operational efficiency. BERKSHIRE HILLS BANCORP, INC. AND SUBSIDIARIES RECONCILIATION OF NON-GAAP FINANCIAL MEASURES |
 Mar. 31, Dec. 31, Sept. 30, June 30, Mar. 31, 2006 2005 2005 2005 2005 (Dollars in thousands, except per share data) Net income 4,818 $ 4,838 $ 4,746 $ (4,608) $ 3,252 $ Less: Gain on sale of securities, net (497) (882) (832) (1,388) (429) Plus: Termination of ESOP - 168 - 8,667 - Plus: Merger and conversion expense - 352 828 963 - Adj: Income taxes 164 119 1 (139) 150 Core income (A) 4,485 4,595 4,743 3,495 2,973 Plus: Amort. Intang. Assets (net of taxes) 320 322 322 105 20 Tangible core income (B) 4,805 $ 4,917 $ 5,065 $ 3,600 $ 2,993 $ Total non-interest income 4,091 $ 4,297 $ 3,955 $ 3,916 $ 2,744 $ Less: Gain on sale of securities, net (497) (882) (832) (1,388) (429) Total core non-interest income (C) 3,594 $ 3,415 $ 3,123 $ 2,528 $ 2,315 $ Total non-interest expense 11,225 $ 11,800 $ 11,600 $ 18,061 $ 7,536 $ Less: Termination of ESOP - (168) - (8,667) - Less: Merger and conversion expense - (352) (828) (963) - Core non-interest expense 11,225 11,280 10,772 8,431 7,536 Less: Amortization of intangible assets (478) (481) (481) (156) (30) Total core tangible non-interest expense (D) 10,747 $ 10,799 $ 10,291 $ 8,275 $ 7,506 $ Total average assets 2,043,749 $ 2,032,098 $ 2,065,251 $ 1,563,945 $ 1,311,023 $ Less: Average intangible assets (99,318) (99,862) (100,955) (38,879) (7,254) Total average tangible assets (E) 1,944,431 $ 1,932,236 $ 1,964,296 $ 1,525,066 $ 1,303,769 $ Total average stockholders' equity 250,305 $ 246,307 $ 241,540 $ 164,717 $ 132,053 $ Less: Average intangible assets (99,318) (99,862) (100,955) (38,879) (7,254) Total average tangible stockholders' equity (F) 150,987 $ 146,445 $ 140,585 $ 125,838 $ 124,799 $ Total stockholders' equity, period-end 247,637 $ 246,066 $ 245,531 $ 244,497 128,426 Less: Intangible assets, period-end (99,163) (99,616) (99,742) (102,167) (7,235) Total tangible stockholders' equity, period-end (G) 148,474 $ 146,450 $ 145,789 $ 142,330 $ 121,191 $ Total shares outstanding (thousands) (H) 8,601 8,540 8,564 8,594 5,835 Average diluted shares outstanding (thousands) (I) 8,755 8,813 8,856 6,257 5,691 Core earnings per share (A/I) 0.51 $ 0.52 $ 0.54 $ 0.53 $ 0.52 $ Tangible book value per share (G/H) 17.26 $ 17.15 $ 17.04 $ 16.56 $ 20.77 $ Core return on tangible assets (B/E) 0.98 % 1.02 % 1.04 % 0.94 % 0.91 % Core return on tangible equity (B/F) 12.63 13.49 14.47 11.42 9.52 Core tangible non-interest income to assets (C/E) 0.74 0.71 0.64 0.66 0.71 Core tangible non-interest exp to assets (D/E) 2.21 2.24 2.10 2.17 2.30 Efficiency ratio 57.48 57.00 55.17 57.65 59.56 Efficiency ratio is computed by dividing total tangible core non-interest expense by the sum of total net interest income on a fully taxable equivalent basis and total core non-interest income. The Company uses this non-GAAP measure, which is used widely in the banking industry, to provide important information regarding its operational efficiency. Note: Ratios are annualized and based on average balance sheet amounts, where applicable. BERKSHIRE HILLS BANCORP, INC. AND SUBSIDIARIES RECONCILIATION OF NON-GAAP FINANCIAL MEASURES At or for the Quarters Ended |