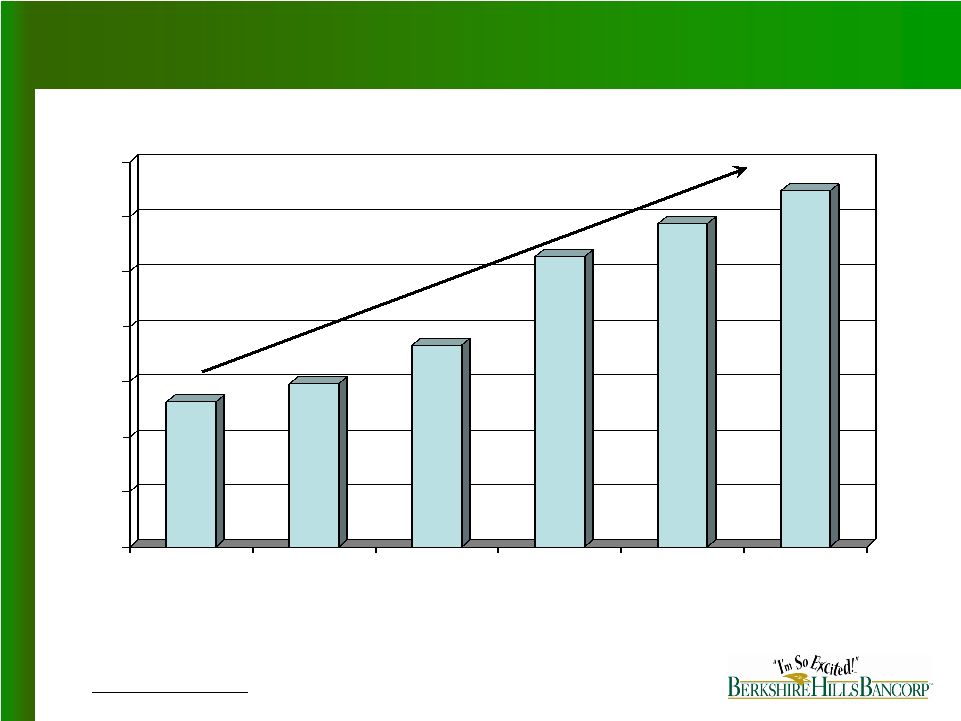
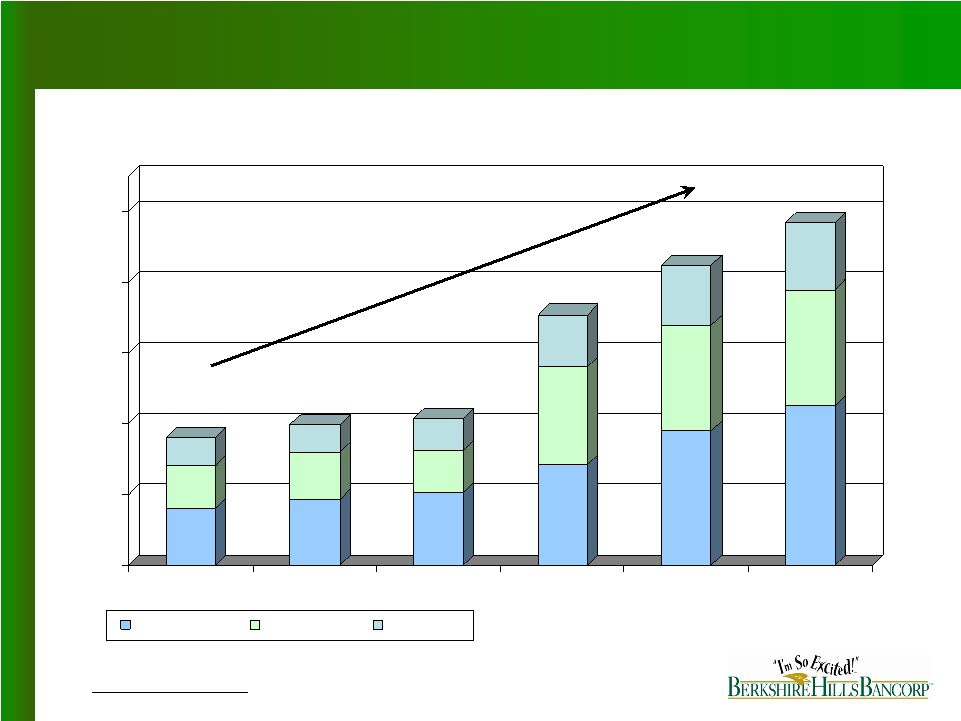
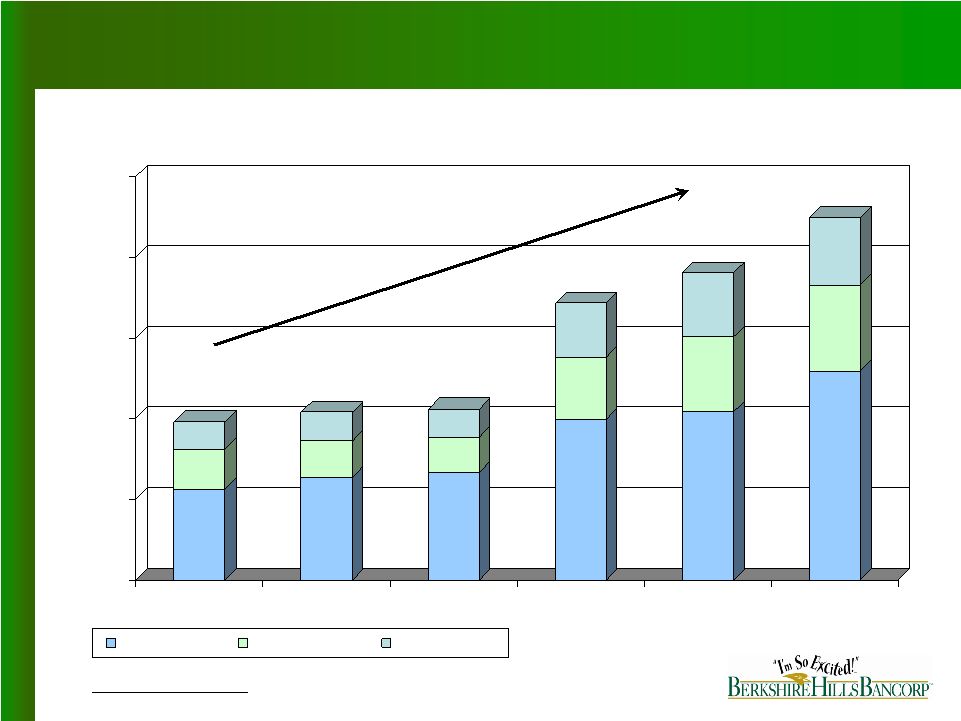
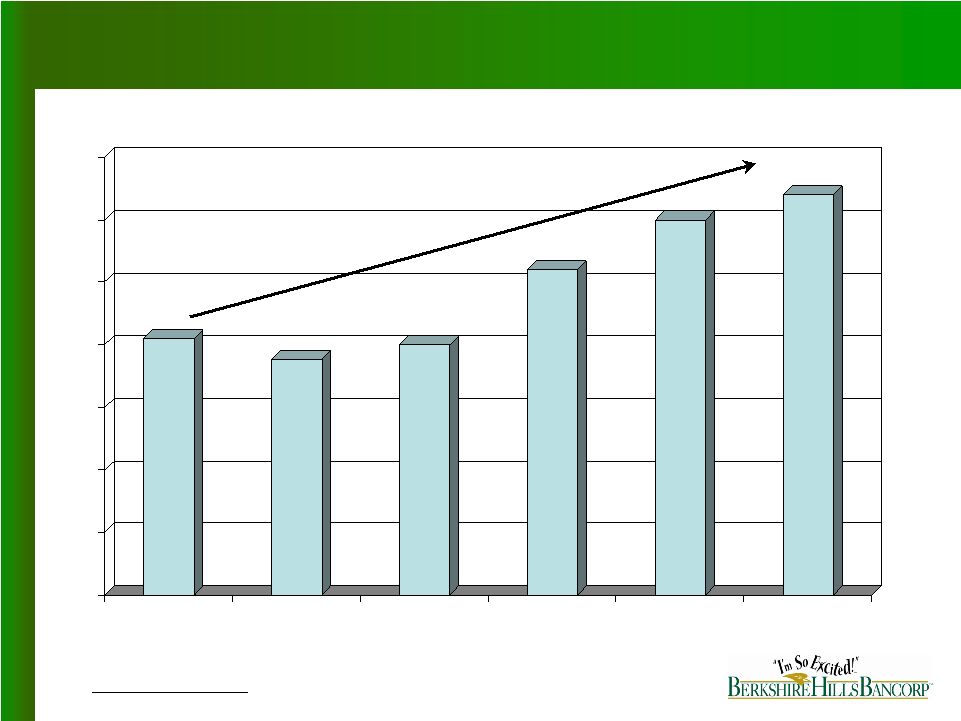
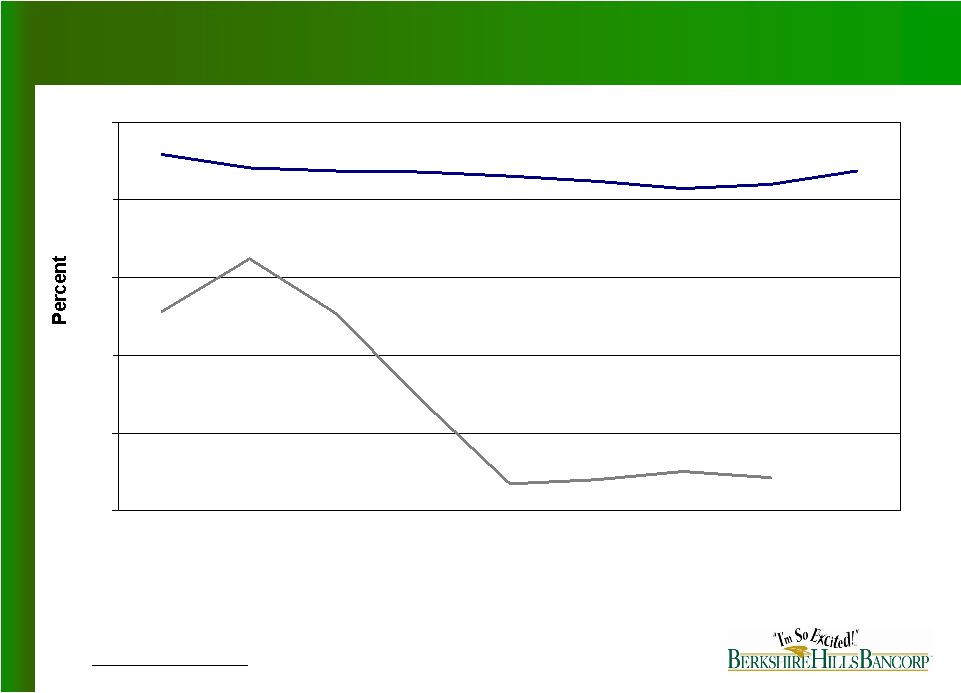
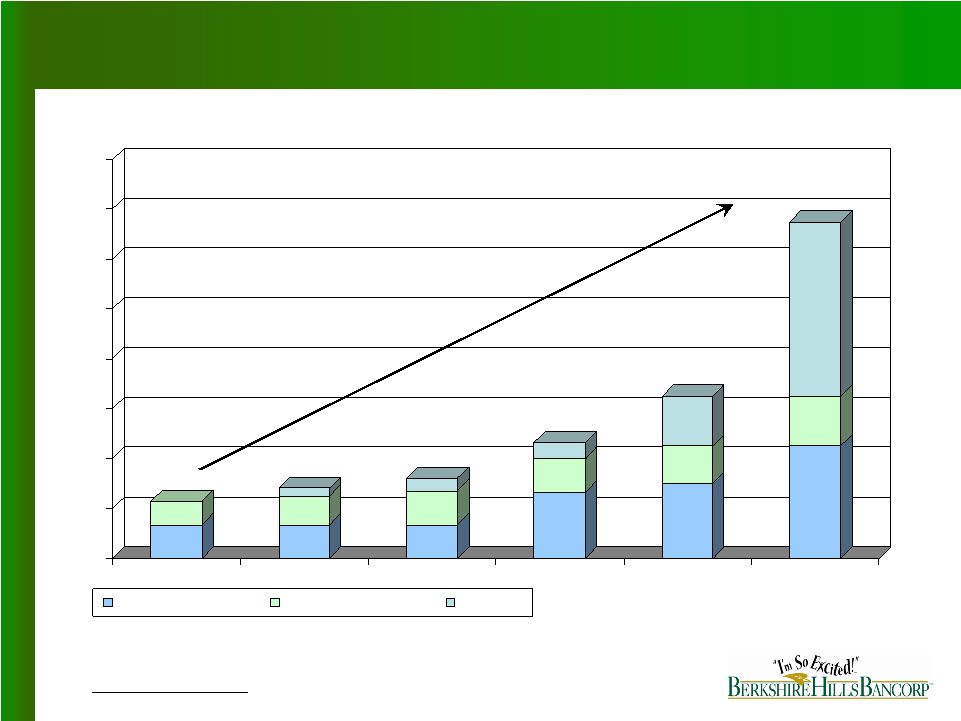
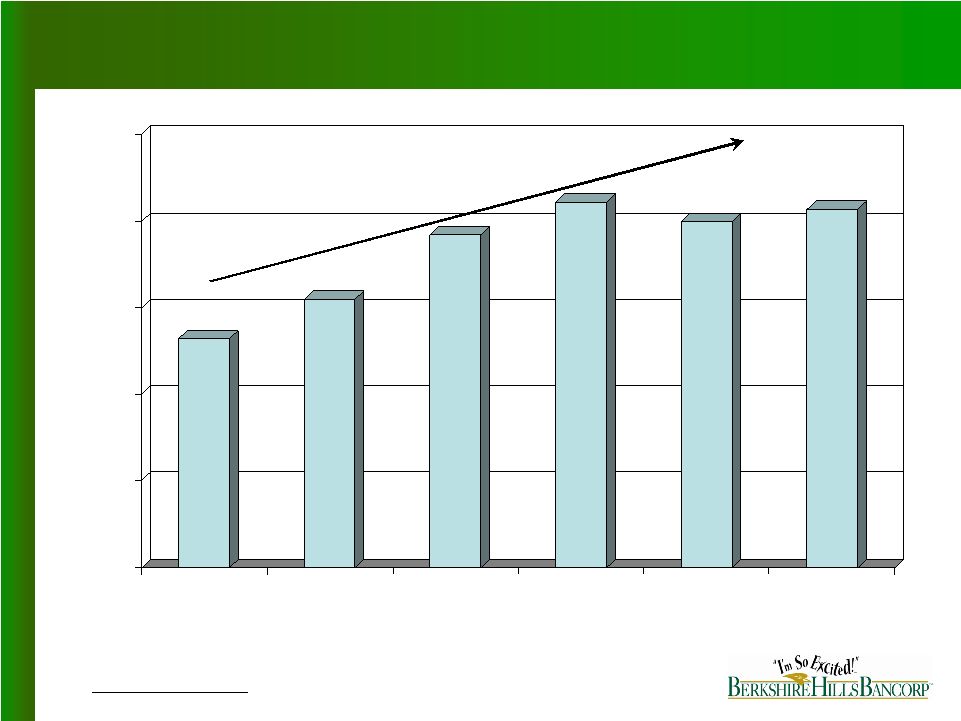
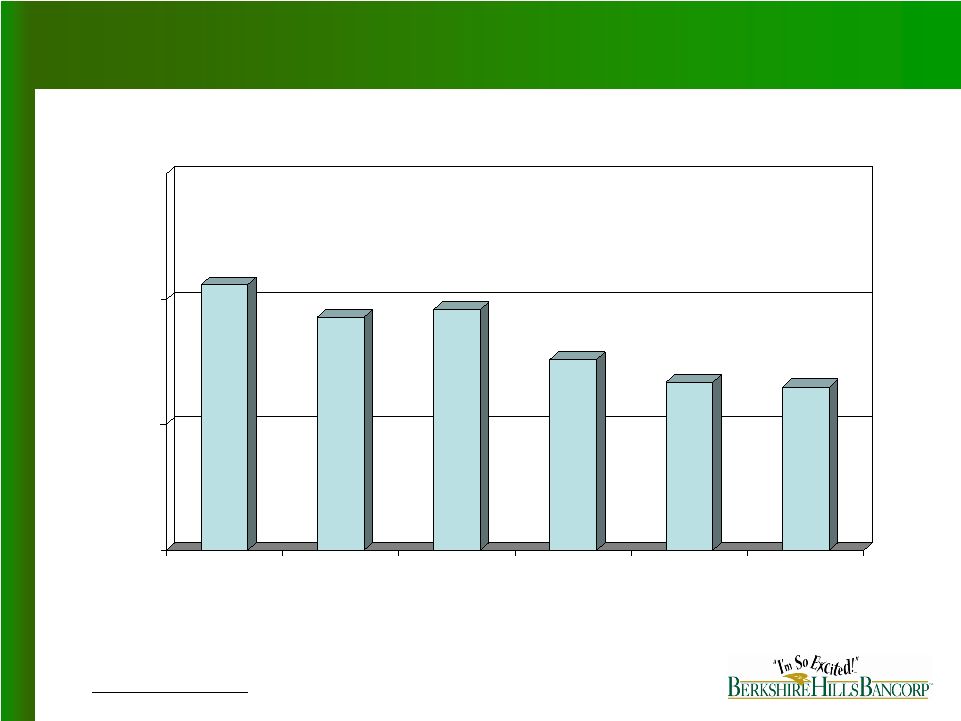
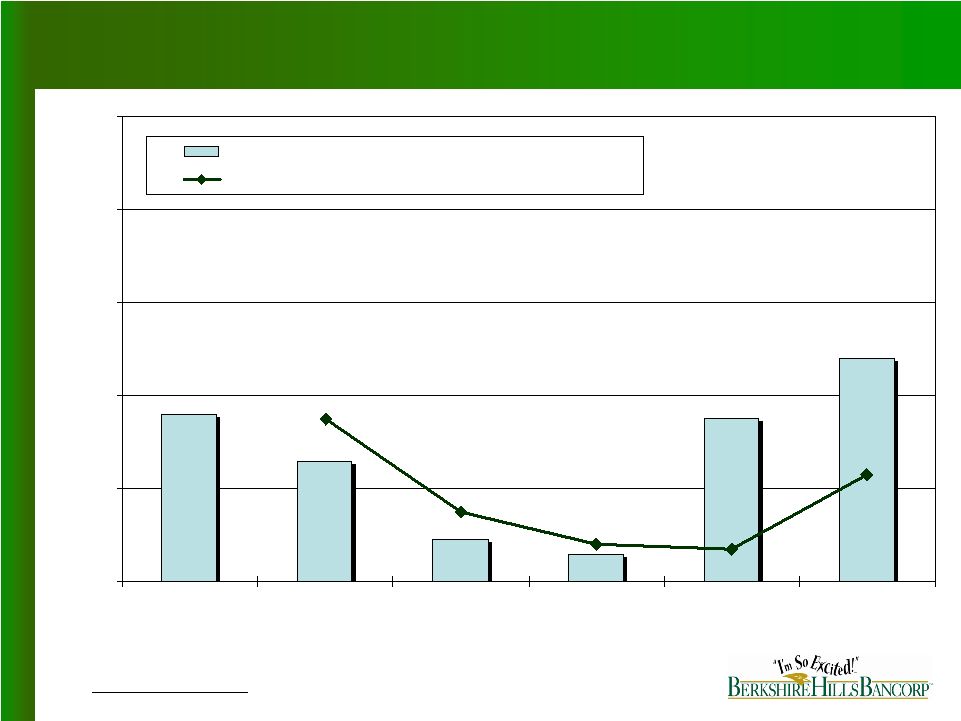
Page 24 BHLB www.berkshirebank.com Berkshire Hills Bancorp, Inc. and Subsidiaries Reconciliation of Non-GAAP Financial Measures (Dollars in thousands, except share data) 2002 2003 2004 2005 2006 Net income (A) 2,097 $ 8,965 $ 11,509 $ 8,226 $ 11,263 $ Less: Gain on sale of securities, net (15,143) (3,077) (1,402) (3,532) 3,130 Plus: Termination of ESOP - - - 8,836 - Plus: Other, net 19,857 2,608 653 2,142 6,416 Adj: Income taxes 962 360 261 133 (3,252) Core income (A1) 7,773 8,856 11,021 15,805 17,557 Plus: Amortization of intangible assets (net of taxes) 132 132 64 741 1,363 Tangible core income (B) 7,905 $ 8,988 $ 11,085 $ 16,546 $ 18,920 $ Total non-interest income 6,427 $ 6,448 $ 7,764 $ 14,923 $ 12,048 $ Less: Gain on sale of securities, net (15,143) (3,077) (1,402) (3,532) 3,130 Plus: Other 13,704 2,060 - - - Core non-interest income (C) 4,988 5,431 6,362 11,391 15,178 Net interest income 40,700 37,566 40,357 51,617 60,240 Total core operating revenue (C1) 45,688 $ 42,997 $ 46,719 $ 63,008 $ 75,418 $ Total non-interest expense 37,279 $ 28,243 $ 28,977 $ 48,998 $ 48,868 $ Less: Termination of ESOP - - - (8,836) - Less: Merger and conversion expense - - - (2,142) - Less: Other (6,900) (408) - - (1,510) Core non-interest expense (D1) 30,379 27,835 28,977 38,020 47,358 Less: Amortization of intangible assets (203) (203) (98) (1,140) (2,035) Total core tangible non-interest expense (D2) 30,176 $ 27,632 $ 28,879 $ 36,880 $ 45,323 $ Total average assets (E) 1,051,800 $ 1,115,800 $ 1,289,500 $ 1,745,200 $ 2,116,300 $ Less: Average intangible assets (10,300) (10,300) (8,700) (62,000) (103,200) Total average tangible assets (F) 1,041,500 $ 1,105,500 $ 1,280,800 $ 1,683,200 $ 2,013,100 $ Total average stockholders' equity (G) 136,200 $ 123,100 $ 127,100 $ 196,500 $ 255,700 $ Less: Average intangible assets (10,300) (10,300) (8,700) (62,000) (103,200) Total average tangible stockholders' equity (H) 125,900 $ 112,800 $ 118,400 $ 134,500 $ 152,500 $ Core return on tangible assets (B/F) 0.76 % 0.81 % 0.87 % 0.98 % 0.94 % Core return on tangible equity (B/H) 6.28 7.97 9.36 12.30 12.40 Efficiency ratio 64.55 63.64 60.66 57.03 58.46 Total average diluted shares (in thousands) (I) 5,867 5,703 5,731 7,503 8,730 Net income per diluted share (A/I) $0.36 $1.57 $2.01 $1.10 $1.29 Core income per diluted share (A1/I) $1.32 $1.55 $1.92 $2.11 $2.00 Efficiency Ratio is computed by dividing total tangible core non-interest expense by the sum of total net interest income on a fully taxable equivalent basis and total core non-interest income. The Company uses this common non-GAAP measure to provide important information regarding its operational efficiency. At and for the years ended December 31, |


