Exhibit 99.1

February 2017 Berkshire Hills Bancorp Investor Presentation

Assets: $9.2 billion Loans: $ 6.5 billion Deposits: $ 6.6 billion Wealth AUM: $1.4 billion Revenue : $298 million (LTM) Branches: 98 Footprint: Northeast Market Capitalization: $ 1.3 billion NYSE: BHLB 2 Note: All data as of 12/31/16 Who We Are Full service regional bank with a distinctive brand and culture, strong middle market opportunities and ongoing momentum
Why Berkshire? Strong momentum and improving profitability Diversified revenue drivers and controlled expenses Footprint positioned in attractive markets AMEB culture – results driven Acquisition disciplines a strength in a consolidating market 3
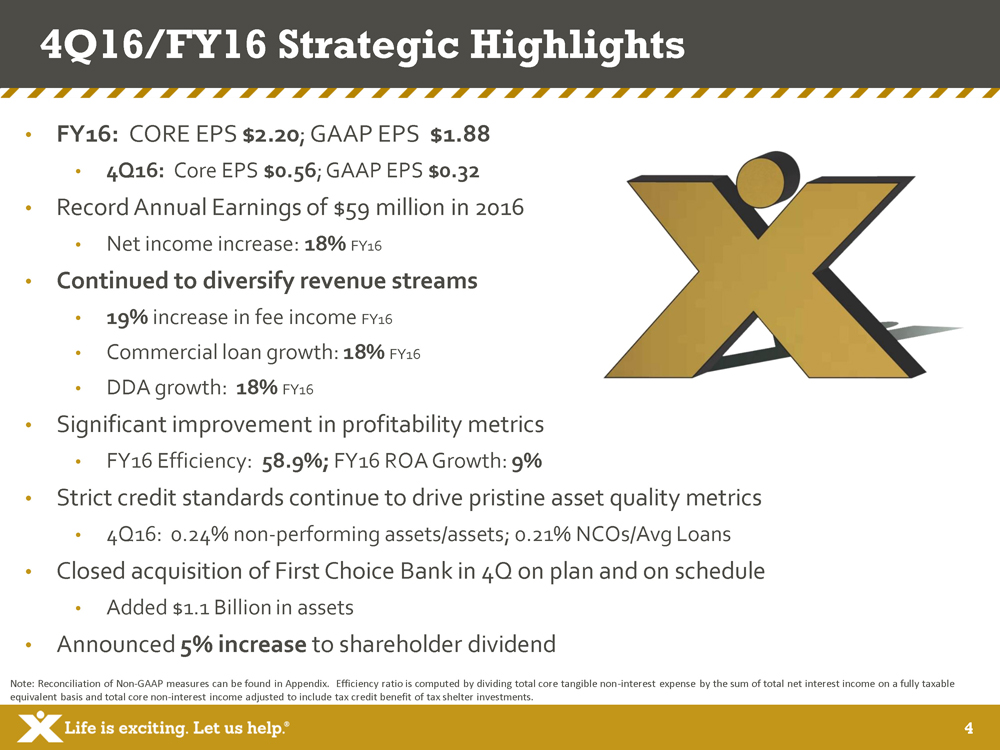
4 4Q16/FY16 Strategic Highlights • FY16: CORE EPS $2.20 ; GAAP EPS $1.88 • 4Q16: Core EPS $0.56 ; GAAP EPS $0.32 • Record Annual Earnings of $59 million in 2016 • Net income increase: 18% FY16 • Continued to diversify revenue streams • 19% increase in fee income FY16 • Commercial loan growth: 18% FY16 • DDA growth: 18% FY16 • Significant improvement in profitability metrics • FY16 Efficiency: 58.9%; FY16 ROA Growth: 9% • Strict credit standards continue to drive pristine asset quality metrics • 4Q16: 0.24% non - performing assets/assets; 0.21% NCOs/ Avg Loans • Closed acquisition of First Choice Bank in 4Q on plan and on schedule • Added $1.1 Billion in assets • Announced 5% increase to shareholder dividend Note: Reconciliation of Non - GAAP measures can be found in Appendix. Efficiency ratio is computed by dividing total core tangible non - interest expense by the sum of total net interest income on a fully taxable equivalent basis and total core non - interest income adjusted to include tax credit benefit of tax shelter investments.
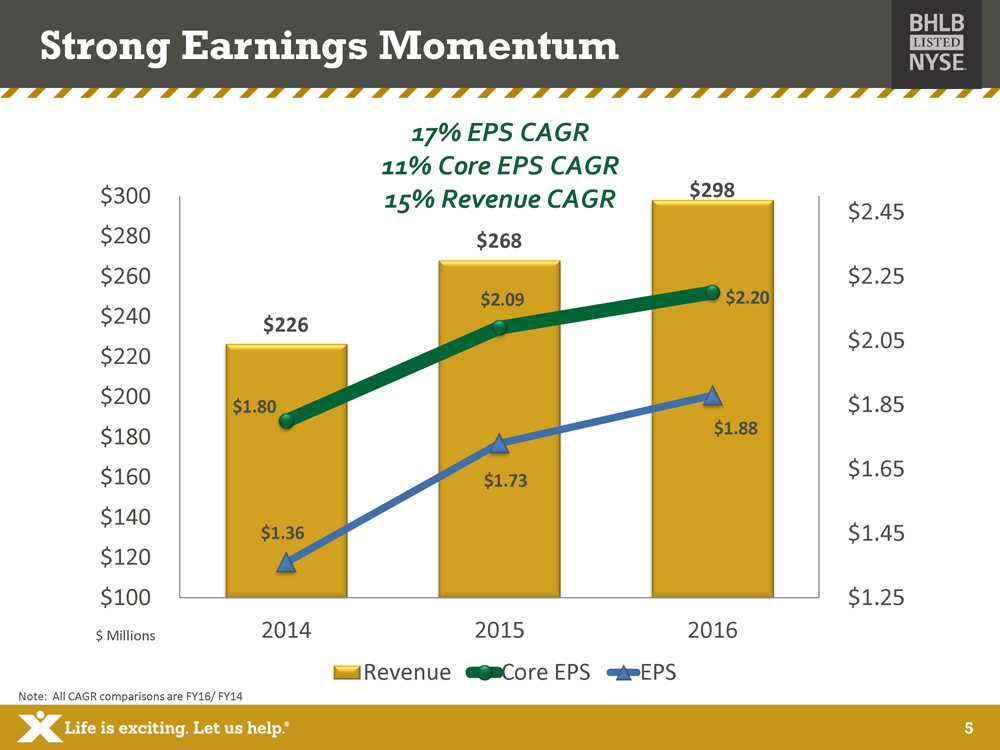
5 Strong Earnings Momentum $226 $268 $298 $1.80 $2.09 $2.20 $1.36 $1.73 $1.88 $1.25 $1.45 $1.65 $1.85 $2.05 $2.25 $2.45 $100 $120 $140 $160 $180 $200 $220 $240 $260 $280 $300 2014 2015 2016 Revenue Core EPS EPS $ Millions 17 % EPS CAGR 11% Core EPS CAGR 15% Revenue CAGR Note: All CAGR comparisons are FY16/ FY14
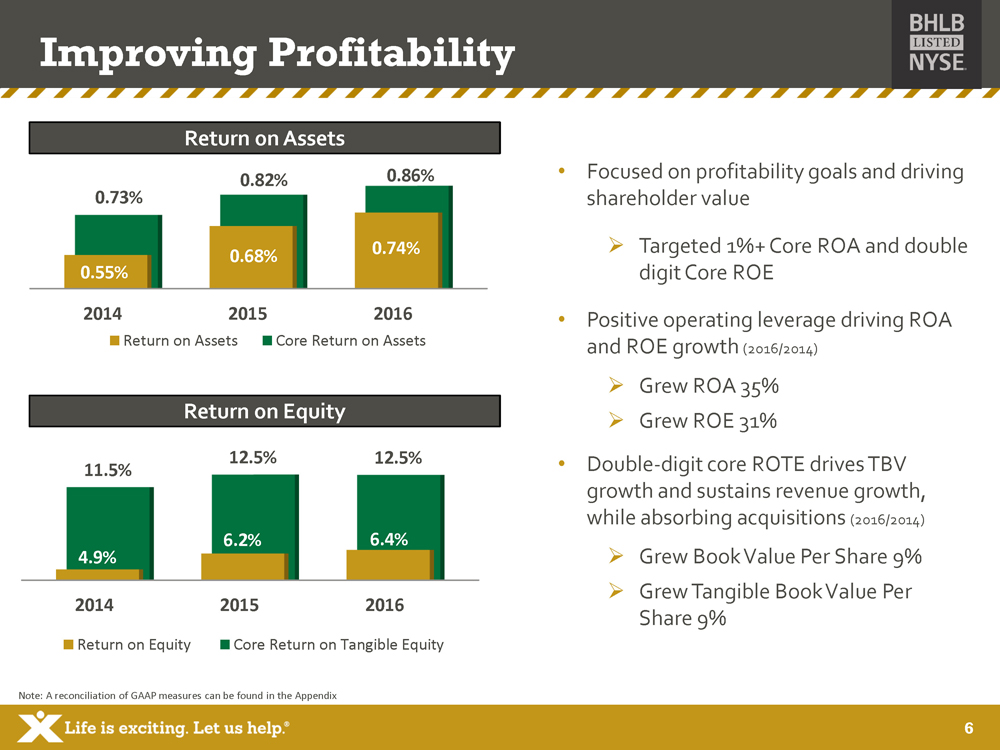
6 Improving Profitability 2014 2015 2016 0.55% 0.68% 0.74% 0.73% 0.82% 0.86% Return on Assets Core Return on Assets Note: A reconciliation of GAAP measures can be found in the Appendix 2014 2015 2016 4.9% 6.2% 6.4% 11.5% 12.5% 12.5% Return on Equity Core Return on Tangible Equity • Focused on profitability goals and driving shareholder value » Targeted 1%+ Core ROA and double digit Core ROE • Positive operating leverage driving ROA and ROE growth (2016/2014) » Grew ROA 35% » Grew ROE 31% • Double - digit core ROTE drives TBV growth and sustains revenue growth, while absorbing acquisitions (2016/2014) » Grew Book Value Per Share 9% » Grew Tangible Book Value Per Share 9% Return on Assets Return on Equity

7 Diversified Loan Mix Note: Loan growth and specialty lending as of 12/31/16 2,416 3,108 3,679 1,496 1,815 1,893 769 802 978 $0 $1,000 $2,000 $3,000 $4,000 $5,000 $6,000 2014 2015 2016 Commercial Residential Consumer $ Millions 14% loan growth in 2016 $426 million of new loans brought on through acquisition of First Choice Bank Commercial portfolio makes up 56% of Total Loans Specialty lending expertise – ABL, Equipment Financing (Firestone Financial), SBA (44 Business Capital) $566 million outstanding Total Loan Mix $4,681 $ 5,725 $ 6,550

8 Diversified Deposit Mix 1,295 1,593 1,849 1,904 2,010 2,439 1,456 1,986 2,334 $0 $1,000 $2,000 $3,000 $4,000 $5,000 $6,000 2014 2015 2016 DDA/Now MM/Savings Time $ Millions 18% increase in total deposits 18% DDA growth 27% Money Market growth $893 million of new deposits brought on through acquisition of First Choice Bank Non - maturity deposits make up 65% of total deposits Note: Deposit growth as of 12/31/16 Total Deposit Mix $4,655 $5,589 $6,622

9 Loan 24% Mortgage Banking 11% Deposit 37% Insurance 15% Wealth Management 13% Focused on Diversifying Fee Revenue Fee Revenue Mix • Total fee income up 19% Y/Y • Focused on revenue diversification • Well positioned for expanded opportunities across lines of business • 44 Business Capital SBA team contributing $1.5MM+ in quarterly fee revenue • First Choice Bank acquisition expected to drive fee income to total revenue ratio north of 30% Note: All data as of FY16
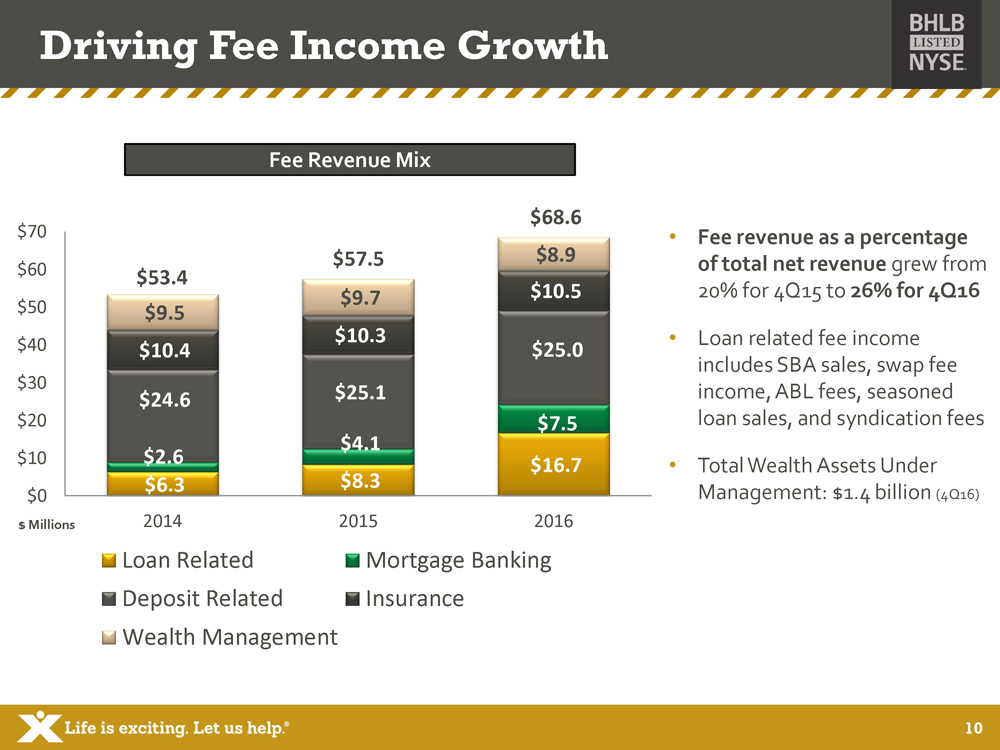
10 Driving Fee Income Growth $6.3 $8.3 $16.7 $2.6 $4.1 $7.5 $24.6 $25.1 $25.0 $10.4 $10.3 $10.5 $9.5 $9.7 $8.9 $0 $10 $20 $30 $40 $50 $60 $70 2014 2015 2016 Loan Related Mortgage Banking Deposit Related Insurance Wealth Management $ Millions Fee Revenue Mix • Fee revenue as a percentage of total net revenue grew from 20% for 4Q15 to 26% for 4Q16 • Loan related fee income includes SBA sales, swap fee income, ABL fees, seasoned loan sales, and syndication fees • Total Wealth Assets Under Management: $1.4 billion (4Q16) $53.4 $57.5 $68.6
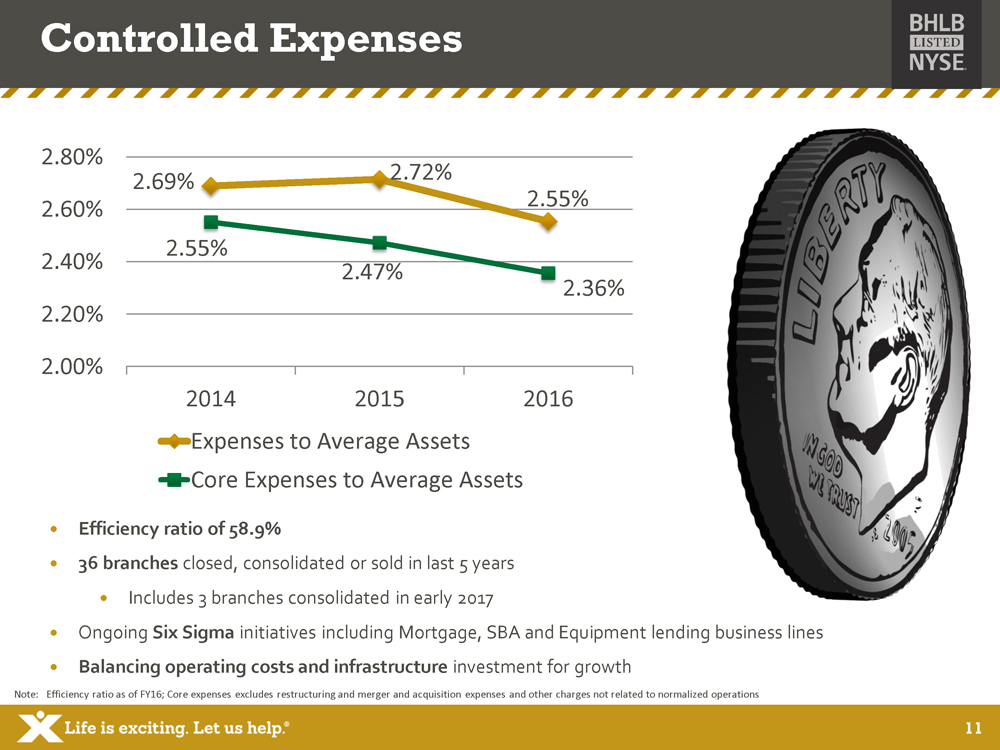
11 Controlled Expenses Efficiency ratio of 58.9% 36 branches closed, consolidated or sold in last 5 years Includes 3 branches consolidated in early 2017 Ongoing Six Sigma initiatives including Mortgage, SBA and Equipment lending business lines Balancing operating costs and infrastructure i nvestment for growth 2.69% 2.72% 2.55% 2.55% 2.47% 2.36% 2.00% 2.20% 2.40% 2.60% 2.80% 2014 2015 2016 Expenses to Average Assets Core Expenses to Average Assets Note: Efficiency ratio as of FY16; Core expenses excludes restructuring and merger and acquisition expenses and other charges not related to normalized operations
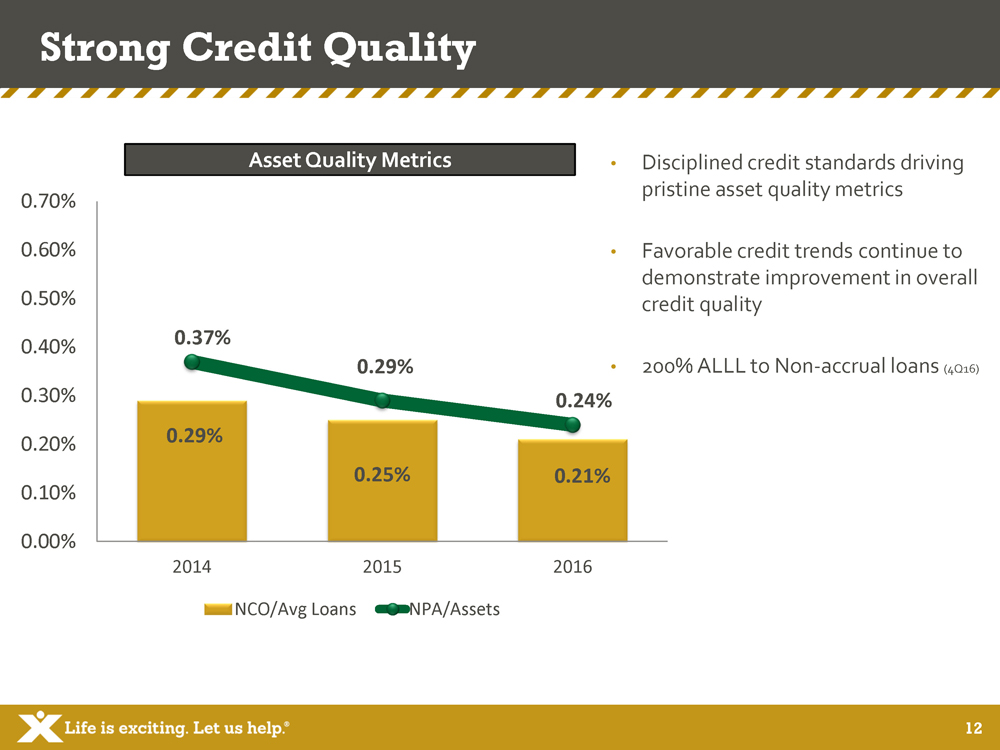
12 Strong Credit Quality 0.29% 0.25% 0.21% 0.37% 0.29% 0.24% 0.00% 0.10% 0.20% 0.30% 0.40% 0.50% 0.60% 0.70% 2014 2015 2016 NCO/Avg Loans NPA/Assets • Disciplined credit standards driving pristine asset quality metrics • Favorable credit trends continue to demonstrate improvement in overall credit quality • 200% ALLL to Non - accrual loans (4Q16) Asset Quality Metrics
13 AMEB Culture – Results Driven RIGHT core values – Respect, Integrity, Guts, Having Fun and Teamwork Talent recruitment drives growth Engaging and innovative customer experience Driven to make a difference Community focused People, Attitude and Energy
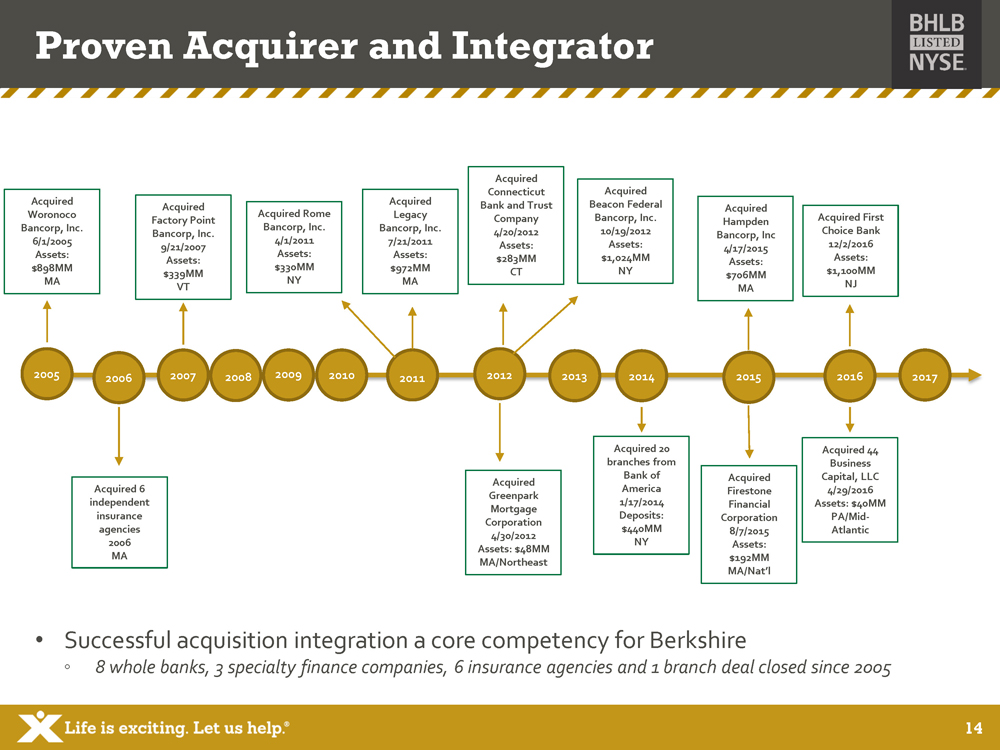
14 2005 2006 2007 2008 2009 2010 2011 2012 2013 2014 2015 2016 Acquired Woronoco Bancorp, Inc. 6/1/2005 Assets: $898MM MA Acquired 6 independent insurance agencies 2006 MA Acquired Factory Point Bancorp, Inc. 9/21/2007 Assets: $339MM VT Acquired Rome Bancorp, Inc. 4/1/2011 Assets: $330MM NY Acquired Legacy Bancorp, Inc. 7/21/2011 Assets: $972MM MA Acquired Greenpark Mortgage Corporation 4/30/2012 Assets: $48MM MA/Northeast Acquired Connecticut Bank and Trust Company 4/20/2012 Assets: $283MM CT Acquired 20 branches from Bank of America 1/17/2014 Deposits: $440MM NY Acquired Beacon Federal Bancorp, Inc. 10/19/2012 Assets: $1,024MM NY Acquired Firestone Financial Corporation 8/7/2015 Assets: $192MM MA/Nat’l Acquired 44 Business Capital, LLC 4/29/2016 Assets: $40MM PA/Mid - Atlantic Acquired First Choice Bank 12/2/2016 Assets: $1,100MM NJ Acquired Hampden Bancorp, Inc 4/17/2015 Assets: $706MM MA • Successful acquisition integration a core competency for Berkshire ◦ 8 whole banks, 3 specialty finance companies, 6 insurance agencies and 1 branch deal closed since 2005 Proven Acquirer and Integrator 2017
15 FY17 Guidance 2017 – Driving Profitability and Fee Revenue » Continued progress towards 1% ROA » Deepening and diversifying revenue sources 5 - 7% Core EPS growth Revenue growth driven by balance sheet expansion and fee sources » Minimal margin compression expected, assuming a flat rate environment Loan and deposit growth low - to - mid single digits Tax rate between 25 - 30% for next two years Note: Guidance issued on January 31, 2017. GAAP guidance is not provided for FY17 due to the uncertainty of the exact timing fo r the First Choice Bank noncore merger charges and potential balance sheet restructuring

16 Why Invest in Us Strong momentum and improving profitability Diversified revenue drivers and controlled expenses Footprint positioned in attractive markets AMEB culture – results driven Acquisition disciplines a strength in a consolidating market Source: SNL Financial a/o 01.31.2017 and BHLB 4Q16 Earnings Release Ticker BHLB Stock Price $35.40 Market Cap $1.3B 2017 Forward P/E 14.7X Price/Book 1.15X Price/TBV 1.88X Dividend Yield 2.3% Avg. Daily Vol. (3 - mo) 183K Shares Attractive Metrics Compared to Peers
17 Loan and Deposit Mix Redefining Customer Experience Preparing for $10 Billion Tax Credit Program Acquisition Discipline and Integration Experience Berkshire Franchise Overview Non - GAAP Reconciliation Disclosures Appendix
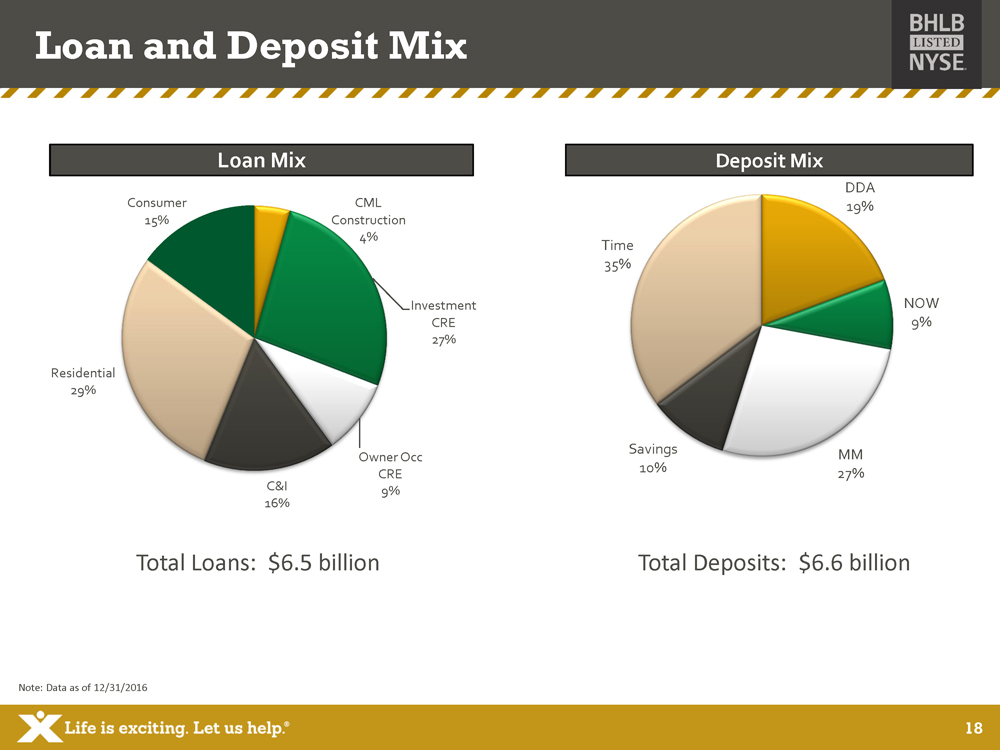
18 Loan and Deposit Mix Deposit Mix DDA 19% NOW 9% MM 27% Savings 10% Time 35% CML Construction 4% Investment CRE 27% Owner Occ CRE 9% C&I 16% Residential 29% Consumer 15% Loan Mix Total Loans: $6.5 billion Total Deposits: $6.6 billion Note: Data as of 12/31/2016
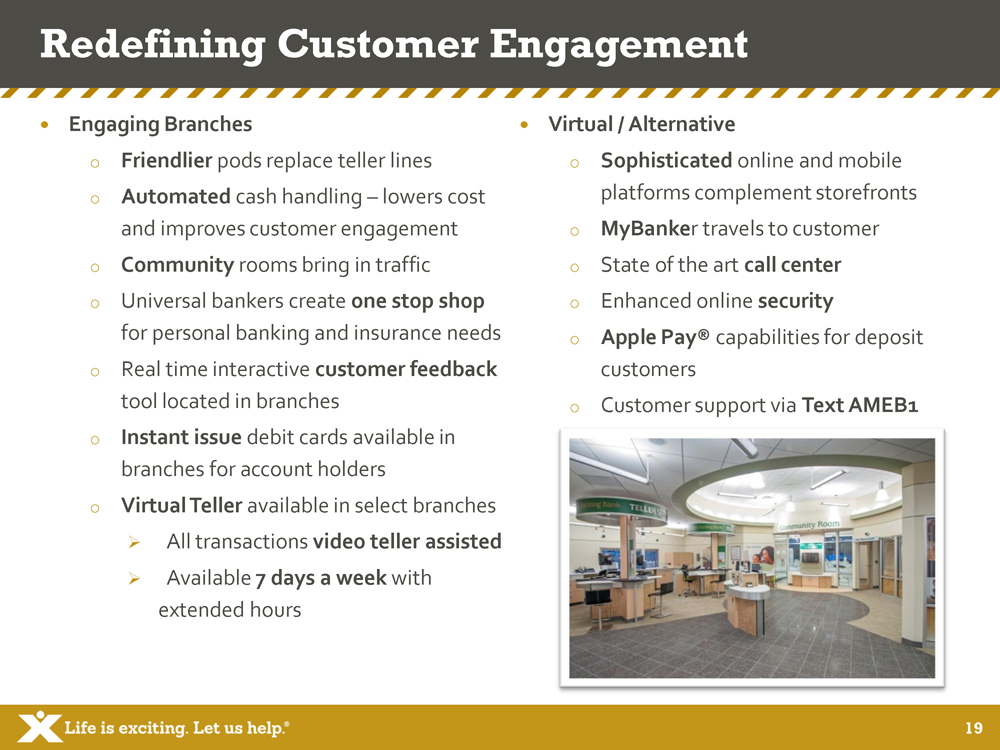
19 Redefining Customer Engagement Engaging Branches o Friendlier pods replace teller lines o Automated cash handling – lowers cost and improves customer engagement o Community rooms bring in traffic o Universal bankers create one stop shop for personal banking and insurance needs o Real time interactive customer feedback tool located in branches o Instant issue debit cards available in branches for account holders o Virtual Teller available in select branches » All transactions video teller assisted » Available 7 days a week with extended hours Virtual / Alternative o Sophisticated o nline and mobile platforms complement storefronts o MyBanke r travels to customer o State of the art call center o Enhanced online security o Apple Pay® capabilities for deposit customers o Customer support via Text AMEB1
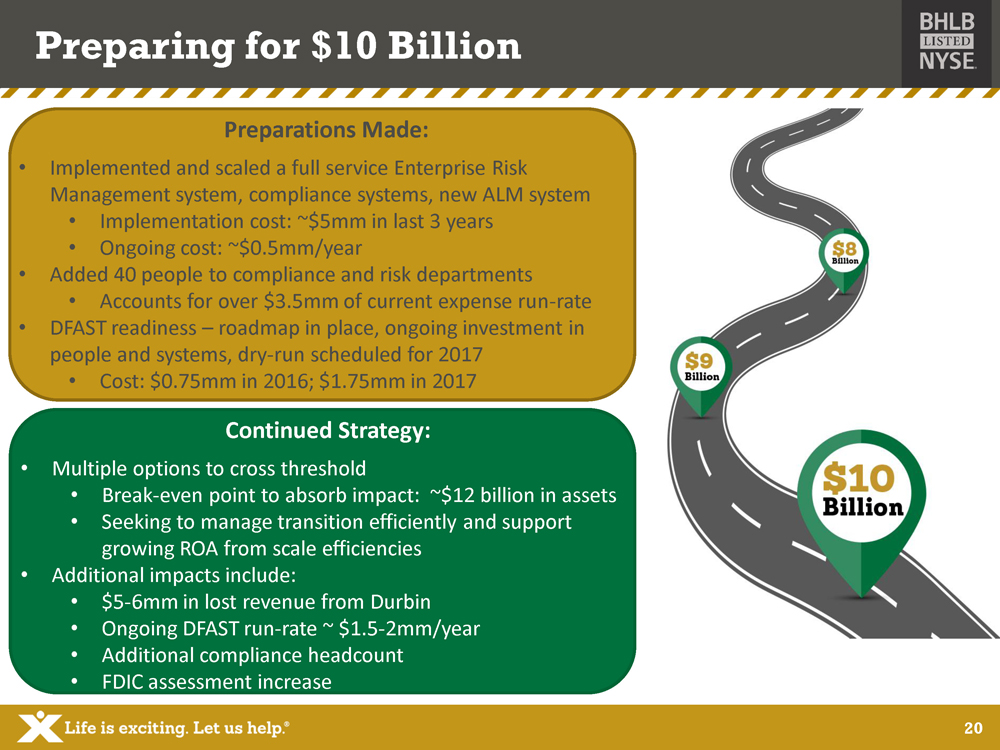
20 Preparations Made: • Implemented and scaled a full service Enterprise Risk Management system, compliance systems, new ALM system • Implementation cost: ~$5mm in last 3 years • Ongoing cost: ~$0.5mm/year • Added 40 people to compliance and risk departments • Accounts for over $3.5mm of current expense run - rate • DFAST readiness – roadmap in place, ongoing investment in people and systems, dry - run scheduled for 2017 • Cost: $0.75mm in 2016; $1.75mm in 2017 Preparing for $10 Billion Continued Strategy: • Multiple options to cross threshold • Break - even point to absorb impact: ~$12 billion in assets • Seeking to manage transition efficiently and support growing ROA from scale efficiencies • Additional impacts include: • $5 - 6mm in lost revenue from Durbin • Ongoing DFAST run - rate ~ $1.5 - 2mm/year • Additional compliance headcount • FDIC assessment increase
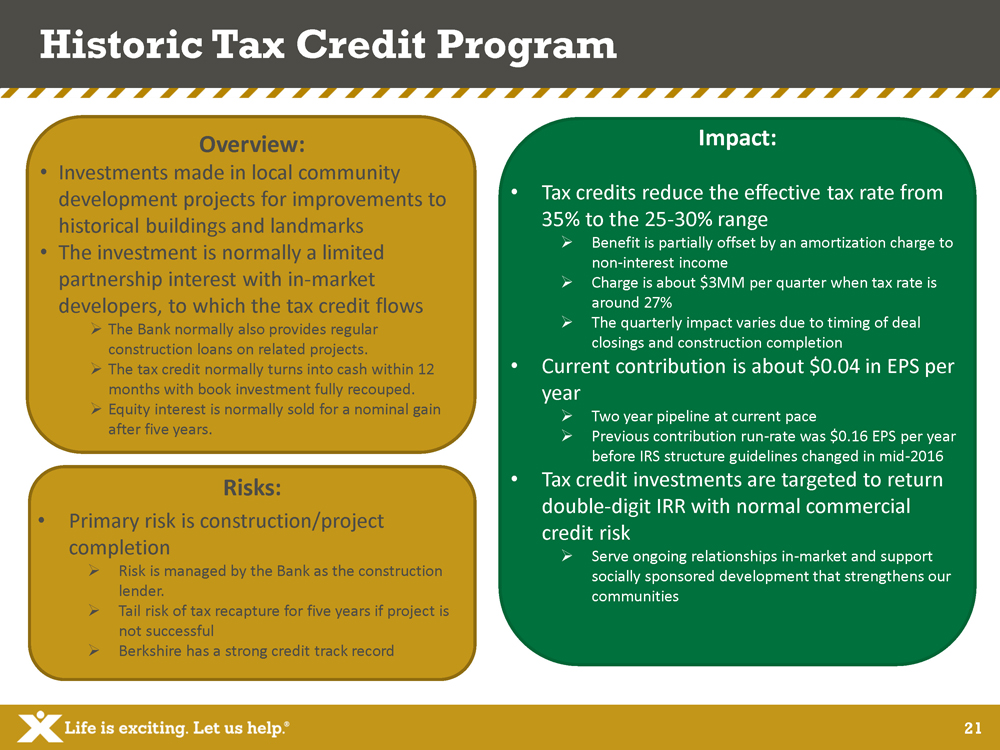
21 Risks: • Primary risk is construction/project completion » Risk is managed by the Bank as the construction lender. » Tail risk of tax recapture for five years if project is not successful » Berkshire has a strong credit track record Overview: • Investments made in local community development projects for improvements to historical buildings and landmarks • The investment is normally a limited partnership interest with in - market developers, to which the tax credit flows » The Bank normally also provides regular construction loans on related projects. » The tax credit normally turns into cash within 12 months with book investment fully recouped. » Equity interest is normally sold for a nominal gain after five years. Historic Tax Credit Program Impact: • Tax credits reduce the effective tax rate from 35% to the 25 - 30% range » Benefit is partially offset by an amortization charge to non - interest income » Charge is about $3MM per quarter when tax rate is around 27% » The quarterly impact varies due to timing of deal closings and construction completion • Current contribution is about $0.04 in EPS per year » Two year pipeline at current pace » Previous contribution run - rate was $0.16 EPS per year before IRS structure guidelines changed in mid - 2016 • Tax credit investments are targeted to return double - digit IRR with normal commercial credit risk » Serve ongoing relationships in - market and support socially sponsored development that strengthens our communities
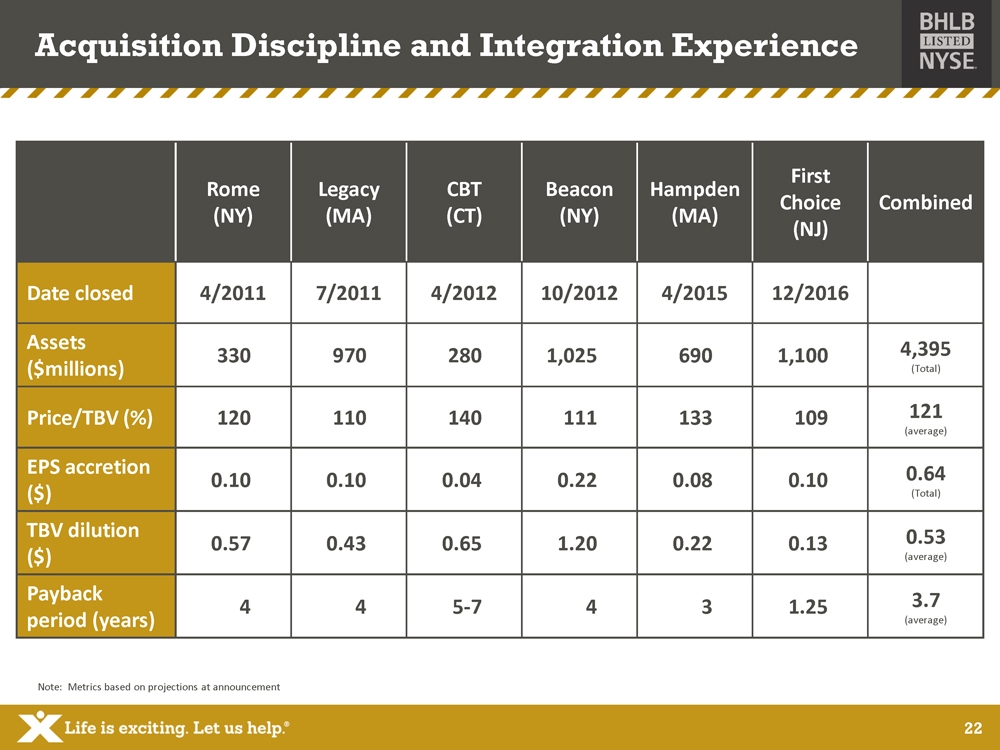
22 Rome (NY) Legacy (MA) CBT (CT) Beacon (NY) Hampden (MA) First Choice (NJ) Combined Date closed 4/2011 7/2011 4/2012 10/2012 4/2015 12/2016 Assets ($millions) 330 970 280 1,025 690 1,100 4,395 (Total) Price/TBV (%) 120 110 140 111 133 109 121 (average) EPS accretion ($ ) 0.10 0.10 0.04 0.22 0.08 0.10 0.64 (Total) TBV dilution ($) 0.57 0.43 0.65 1.20 0.22 0.13 0.53 (average) Payback period (years) 4 4 5 - 7 4 3 1.25 3.7 (average) Acquisition Discipline and Integration Experience Note: Metrics based on projections at announcement
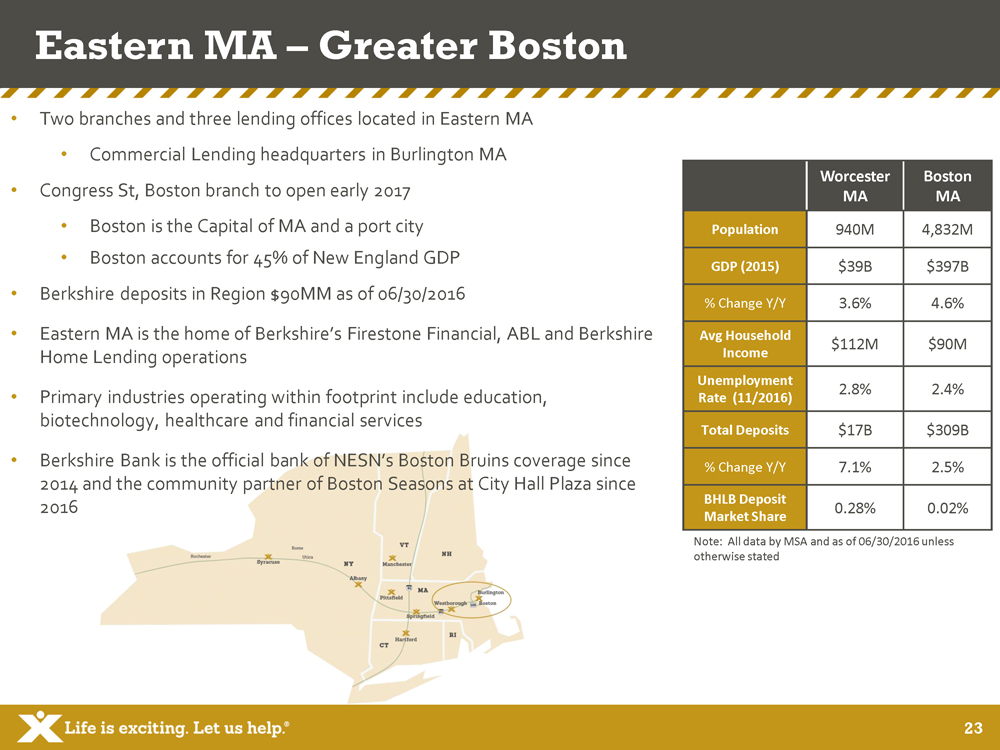
23 Eastern MA – Greater Boston • Two branches and three lending offices located in Eastern MA • Commercial Lending headquarters in Burlington MA • Congress St, Boston branch to open early 2017 • Boston is the Capital of MA and a port city • Boston accounts for 45% of New England GDP • Berkshire deposits in Region $90MM as of 06/30/2016 • Eastern MA is the home of Berkshire’s Firestone Financial, ABL and Berkshire Home Lending operations • Primary industries operating within footprint include education, biotechnology, healthcare and financial services • Berkshire Bank is the official bank of NESN’s Boston Bruins coverage since 2014 and the community partner of Boston Seasons at City Hall Plaza since 2016 Worcester MA Boston MA Population 940M 4,832M GDP (2015) $39B $397B % Change Y/Y 3.6% 4.6% Avg Household Income $112M $90M Unemployment Rate (11/2016) 2.8% 2.4% Total Deposits $17B $309B % Change Y/Y 7.1% 2.5% BHLB Deposit Market Share 0.28% 0.02% Note: All data by MSA and as of 06/30/2016 unless otherwise stated
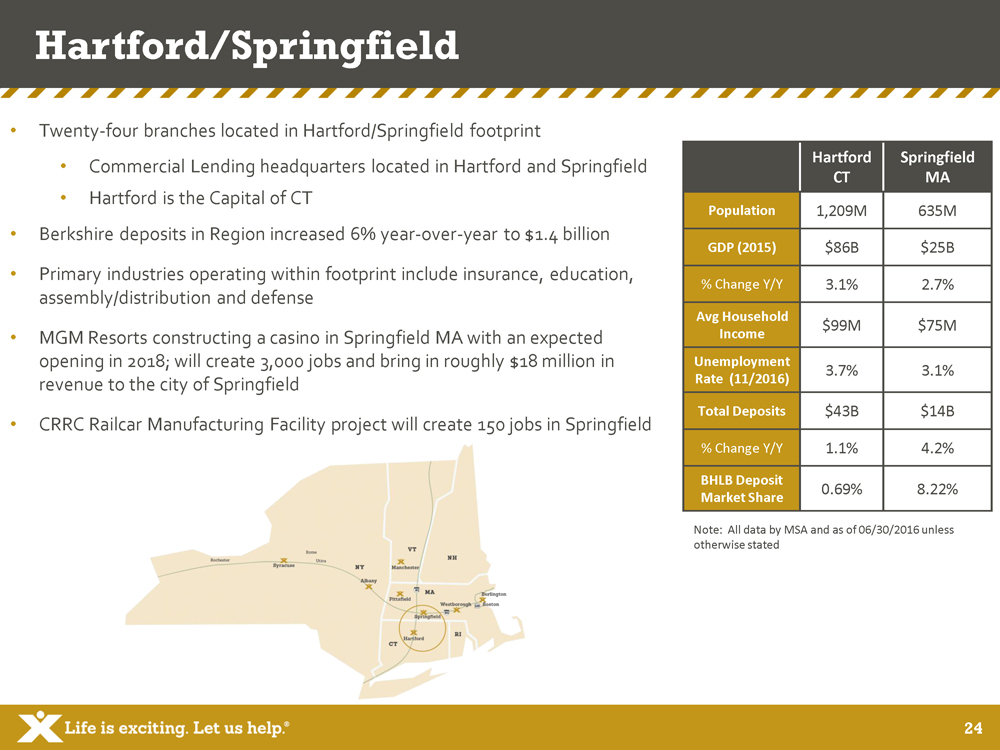
24 Hartford/Springfield • Twenty - four branches located in Hartford/Springfield footprint • Commercial Lending headquarters located in Hartford and Springfield • Hartford is the Capital of CT • Berkshire deposits in Region increased 6% year - over - year to $ 1.4 billion • Primary industries operating within footprint include insurance, education, assembly/distribution and defense • MGM Resorts constructing a casino in Springfield MA with an expected opening in 2018; will create 3,000 jobs and bring in roughly $18 million in revenue to the city of Springfield • CRRC Railcar Manufacturing Facility project will create 150 jobs in Springfield Note: All data by MSA and as of 06/30/2016 unless otherwise stated Hartford CT Springfield MA Population 1,209M 635M GDP (2015) $86B $25B % Change Y/Y 3.1% 2.7% Avg Household Income $99M $75M Unemployment Rate (11/2016) 3.7% 3.1% Total Deposits $43B $14B % Change Y/Y 1.1% 4.2% BHLB Deposit Market Share 0.69% 8.22%
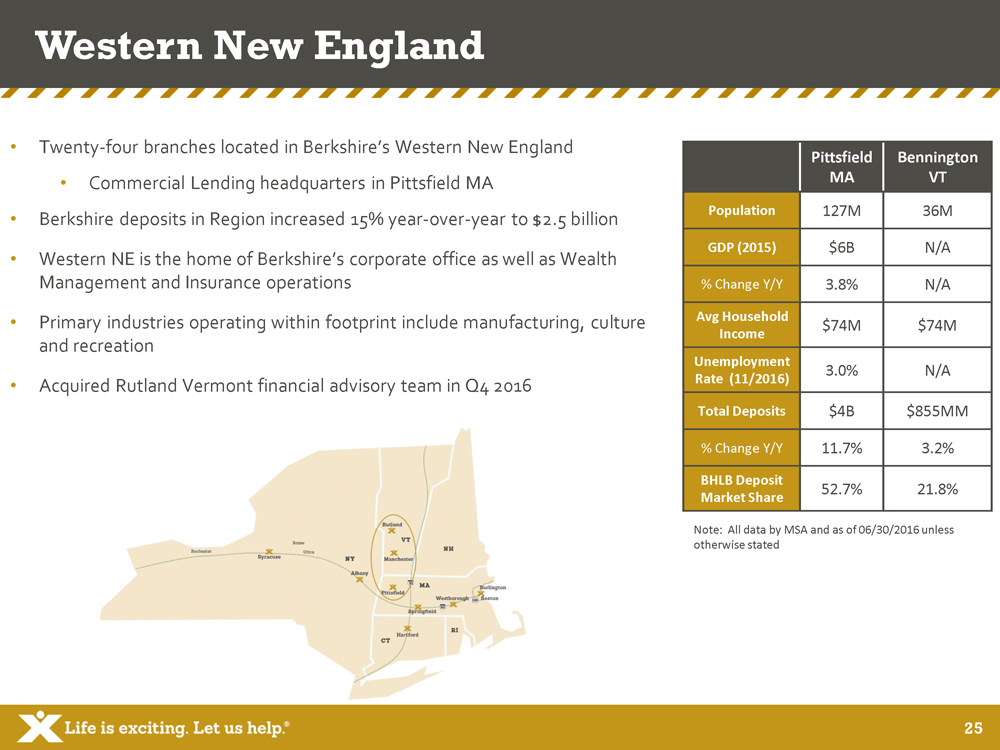
25 Western New England • Twenty - four branches located in Berkshire’s Western New England • Commercial Lending headquarters in Pittsfield MA • Berkshire deposits in Region increased 15% year - over - year to $ 2.5 billion • Western NE is the home of Berkshire’s corporate office as well as Wealth Management and Insurance operations • Primary industries operating within footprint include manufacturing, culture and recreation • Acquired Rutland Vermont financial advisory team in Q4 2016 Note: All data by MSA and as of 06/30/2016 unless otherwise stated Pittsfield MA Bennington VT Population 127M 36M GDP (2015) $6B N/A % Change Y/Y 3.8% N/A Avg Household Income $74M $74M Unemployment Rate (11/2016) 3.0% N/A Total Deposits $4B $855MM % Change Y/Y 11.7% 3.2% BHLB Deposit Market Share 52.7% 21.8%
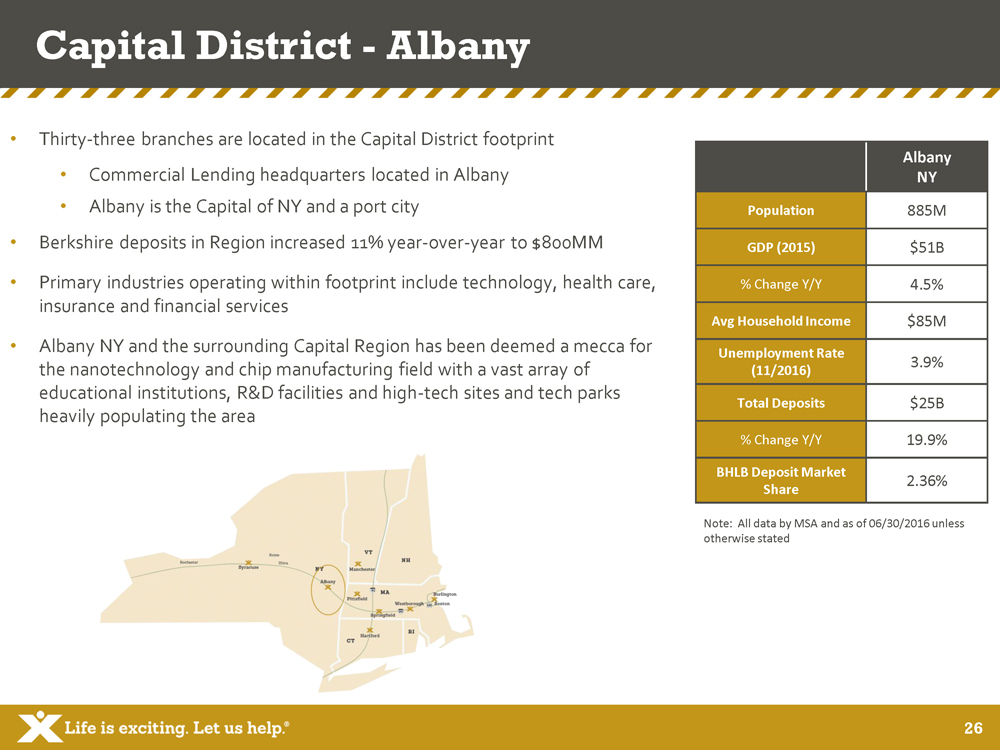
26 Capital District - Albany • Thirty - three branches are located in the Capital District footprint • Commercial Lending headquarters located in Albany • Albany is the Capital of NY and a port city • Berkshire deposits in Region increased 11% year - over - year to $ 800MM • Primary industries operating within footprint include technology, health care, insurance and financial services • Albany NY and the surrounding Capital Region has been deemed a mecca for the nanotechnology and chip manufacturing field with a vast array of educational institutions, R&D facilities and high - tech sites and tech parks heavily populating the area Note: All data by MSA and as of 06/30/2016 unless otherwise stated Albany NY Population 885M GDP (2015) $51B % Change Y/Y 4.5% Avg Household Income $85M Unemployment Rate (11/2016) 3.9% Total Deposits $25B % Change Y/Y 19.9% BHLB Deposit Market Share 2.36%
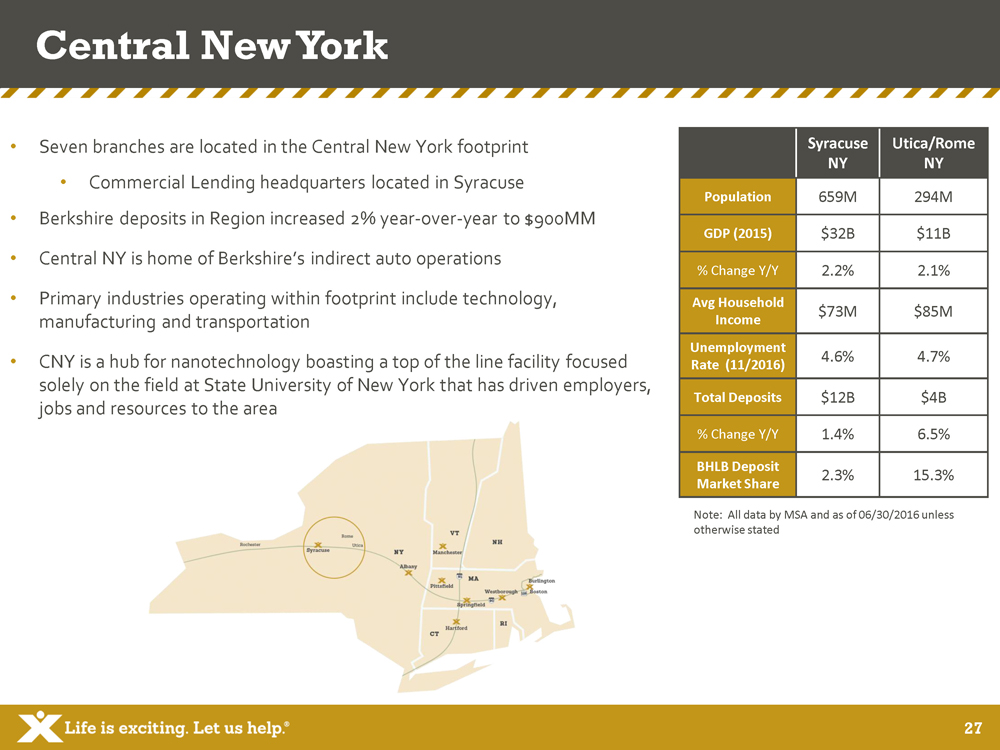
27 Central New York • Seven branches are located in the Central New York footprint • Commercial Lending headquarters located in Syracuse • Berkshire deposits in Region increased 2% year - over - year to $900MM • Central NY is home of Berkshire’s indirect auto operations • Primary industries operating within footprint include technology, manufacturing and transportation • CNY is a hub for nanotechnology boasting a top of the line facility focused solely on the field at State University of New York that has driven employers, jobs and resources to the area Note: All data by MSA and as of 06/30/2016 unless otherwise stated Syracuse NY Utica/Rome NY Population 659M 294M GDP (2015) $32B $11B % Change Y/Y 2.2% 2.1% Avg Household Income $73M $85M Unemployment Rate (11/2016) 4.6% 4.7% Total Deposits $12B $4B % Change Y/Y 1.4% 6.5% BHLB Deposit Market Share 2.3% 15.3%
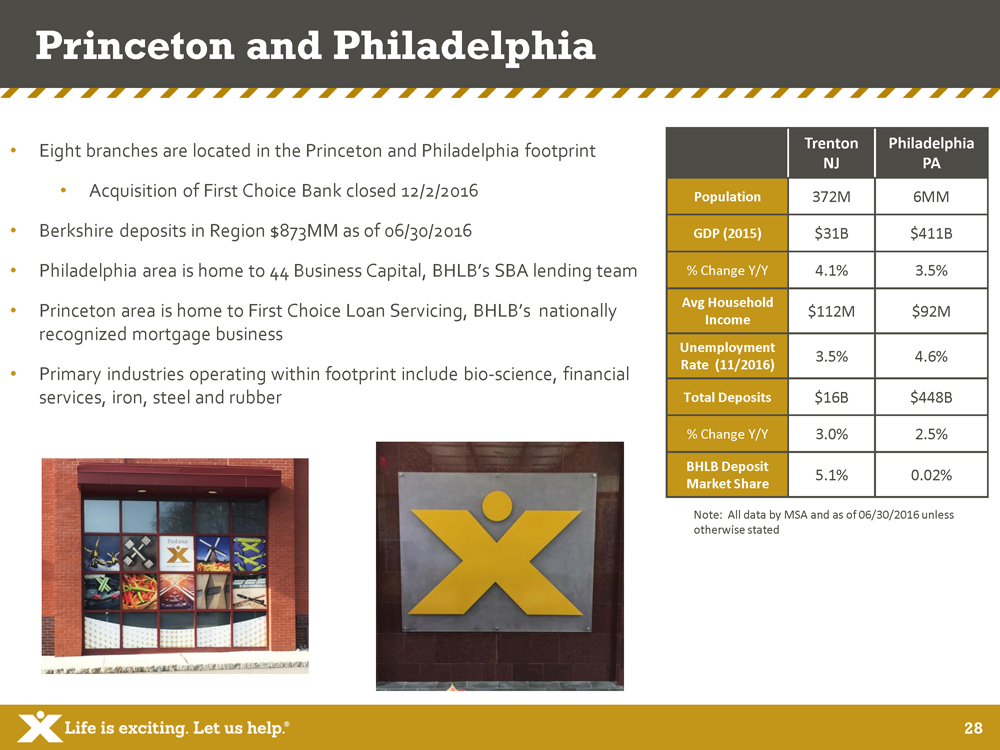
28 Princeton and Philadelphia • Eight branches are located in the Princeton and Philadelphia footprint • Acquisition of First Choice Bank closed 12/2/2016 • Berkshire deposits in Region $873MM as of 06/30/2016 • Philadelphia area is home to 44 Business Capital , BHLB’s SBA lending team • Princeton area is home to First Choice Loan Servicing, BHLB’s nationally recognized mortgage business • Primary industries operating within footprint include bio - science, financial services, iron, steel and rubber Note: All data by MSA and as of 06/30/2016 unless otherwise stated Trenton NJ Philadelphia PA Population 372M 6MM GDP (2015) $31B $411B % Change Y/Y 4.1% 3.5% Avg Household Income $112M $92M Unemployment Rate (11/2016) 3.5% 4.6% Total Deposits $16B $448B % Change Y/Y 3.0% 2.5% BHLB Deposit Market Share 5.1% 0.02%
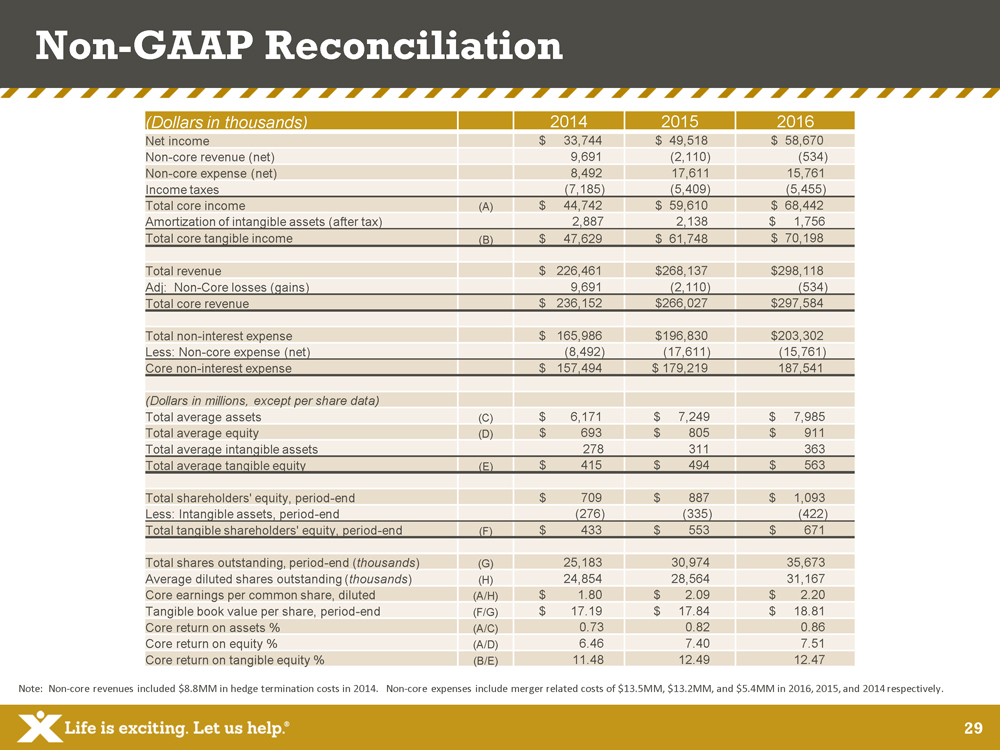
29 (Dollars in thousands) 2014 2015 2016 Net income $ 33,744 $ 49,518 $ 58,670 Non - core revenue (net) 9,691 (2,110) (534) Non - core expense (net) 8,492 17,611 15,761 Income taxes (7,185) (5,409) (5,455) Total core income (A) $ 44,742 $ 59,610 $ 68,442 Amortization of intangible assets (after tax) 2,887 2,138 $ 1,756 Total core tangible income (B) $ 47,629 $ 61,748 $ 70,198 Total revenue $ 226,461 $268,137 $298,118 Adj: Non - Core losses (gains) 9,691 (2,110) (534) Total core revenue $ 236,152 $266,027 $297,584 Total non - interest expense $ 165,986 $196,830 $203,302 Less: Non - core expense (net) (8,492) (17,611) (15,761) Core non - interest expense $ 157,494 $ 179,219 187,541 (Dollars in millions, except per share data) Total average assets (C) $ 6,171 $ 7,249 $ 7,985 Total average equity (D) $ 693 $ 805 $ 911 Total average intangible assets 278 311 363 Total average tangible equity (E) $ 415 $ 494 $ 563 Total shareholders ' equity, period - end $ 709 $ 887 $ 1,093 Less: Intangible assets, period - end (276) (335) (422) Total tangible shareholders ' equity, period - end (F) $ 433 $ 553 $ 671 Total shares outstanding, period - end ( thousands ) (G) 25,183 30,974 35,673 Average diluted shares outstanding ( thousands ) (H) 24,854 28,564 31,167 Core earnings per common share, diluted (A/H) $ 1.80 $ 2.09 $ 2.20 Tangible book value per share, period - end (F/G) $ 17.19 $ 17.84 $ 18.81 Core return on assets % (A/C) 0.73 0.82 0.86 Core return on equity % (A/D) 6.46 7.40 7.51 Core return on tangible equity % (B/E) 11.48 12.49 12.47 Non - GAAP Reconciliation Note: Non - core revenues included $8.8MM in hedge termination costs in 2014. Non - core expenses include merger related costs of $13.5M M, $13.2MM, and $5.4MM in 2016, 2015, and 2014 respectively .
30 FORWARD LOOKING STATEMENTS This document contains forward - looking statements as defined in the Private Securities Litigation Reform Act of 1995 . There are several factors that could cause actual results to differ significantly from expectations described in the forward - looking statements . For a discussion of such factors, please see Berkshire’s most recent reports on Forms 10 - K and 10 - Q filed with the Securities and Exchange Commission and available on the SEC’s website at www . sec . gov . Berkshire does not undertake any obligation to update forward - looking statements .
31 NON - GAAP FINANCIAL MEASURES This document contains certain non - GAAP financial measures in addition to results presented in accordance with Generally Accepte d Accounting Principles (“GAAP”). These non - GAAP measures provide supplemental perspectives on operating results, performance tren ds, and financial condition. They are not a substitute for GAAP measures; they should be read and used in conjunction with the Co mpa ny’s GAAP financial information. A reconciliation of non - GAAP financial measures to GAAP measures is included on pages F - 9 and F - 10 i n the accompanying financial tables. In all cases, it should be understood that non - GAAP per share measures do not depict amounts that accrue directly to the benefit of shareholders. The Company utilizes the non - GAAP measure of core earnings in evaluating operating trends, including components for core revenue and expense. These measures exclude items which the Company does not view as related to its normalized operations. These items in clu de securities gains/losses, merger costs, restructuring costs, and systems conversion costs. Non - core adjustments are presented net of an adjustment for income tax expense. This adjustment is determined as the difference between the GAAP tax rate and the effectiv e t ax rate applicable to core income. The efficiency ratio is adjusted for non - core revenue and expense items and for tax preference items. The Company also calculates measures related to tangible equity, which adjust equity (and assets where applicable) to exclude int ang ible assets due to the importance of these measures to the investment community. Charges related to merger and acquisition activity consist primarily of severance/benefit related expenses, contract terminat ion costs, systems conversion costs, variable compensation expenses, and professional fees. These charges are related to the following b usi ness combinations: First Choice (pending), 44 Business Capital, Hampden Bancorp, and Firestone Financial. Restructuring costs gene ral ly consist of costs and losses associated with the disposition of assets and liabilities and lease terminations, including costs related to branch sales. The Company’s disclosures of organic growth of loans in 2016 are adjusted for the acquisition of the business operations rela ted to 44 Business Capital.

32 If you have any questions, please contact : Allison O’Rourke 99 North Street Pittsfield, MA 01202 Investor Relations Officer (413) 236 - 3149 aorourke@berkshirebank.com