Exhibit 99.1
Berkshire Hills Bancorp Houlihan Lokey Financial Services Conference March 8, 2017

· Assets: $9.2 billion · Loans: $ 6.6 billion · Deposits: $ 6.6 billion · Wealth AUM: $1.4 billion · Revenue : $298 million (LTM) · Branches: 97 · Footprint: Northeast · Market Capitalization: $ 1.3 billion · NYSE: BHLB 2 Note: All data as of 12/31/16 Who We Are Full service regional bank with a distinctive brand and culture, strong middle market opportunities and ongoing momentum

Why Berkshire? AMEB culture – people, attitude, energy Footprint positioned in attractive markets Proven acquirer and integrator Diversified revenue drivers Driving profitability and shareholder value 3

AMEB Culture · People, attitude and energy · RIGHT core values – Respect, Integrity, Guts, Having Fun and Teamwork · Engaging and innovative customer experience · Driven to make a difference 4
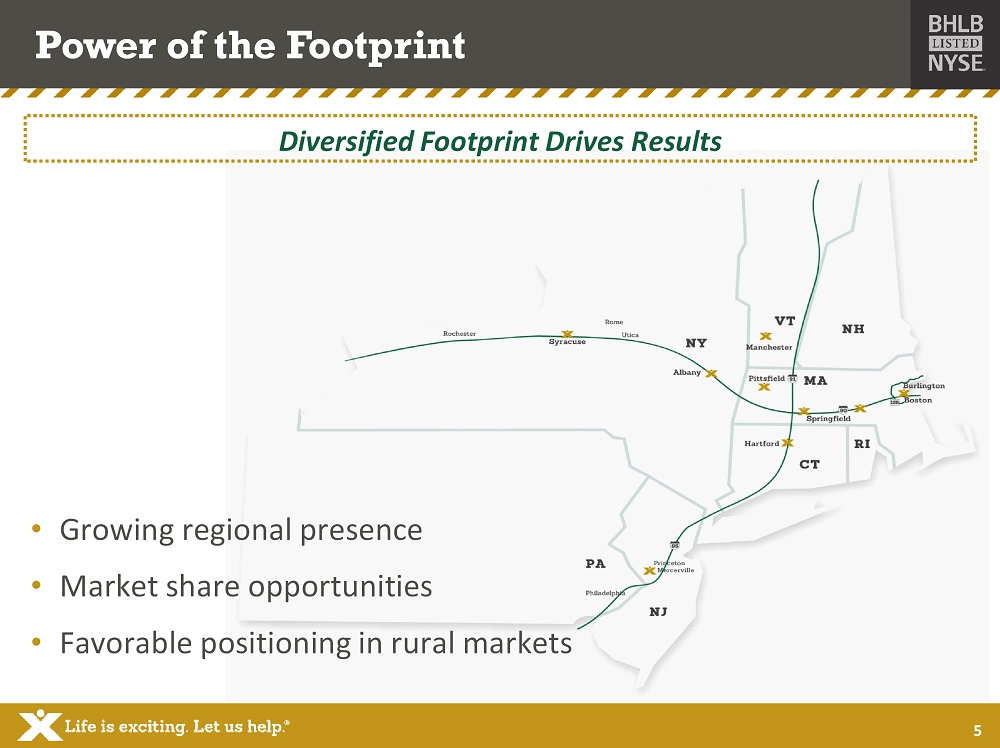
• Growing regional presence • Market share opportunities • Favorable positioning in rural markets Power of the Footprint Diversified Footprint Drives Results 5

Strong Top and Bottom Line Momentum $226 $268 $298 $1.80 $2.09 $2.20 $1.36 $1.73 $1.88 $1.25 $1.45 $1.65 $1.85 $2.05 $2.25 $2.45 $100 $120 $140 $160 $180 $200 $220 $240 $260 $280 $300 2014 2015 2016 Revenue Core EPS EPS $ Millions Double - Digit Annual Growth Note: Annual Growth from 2014 - 2016 was 19% EPS, 11% Core EPS, and 16% Revenue 6
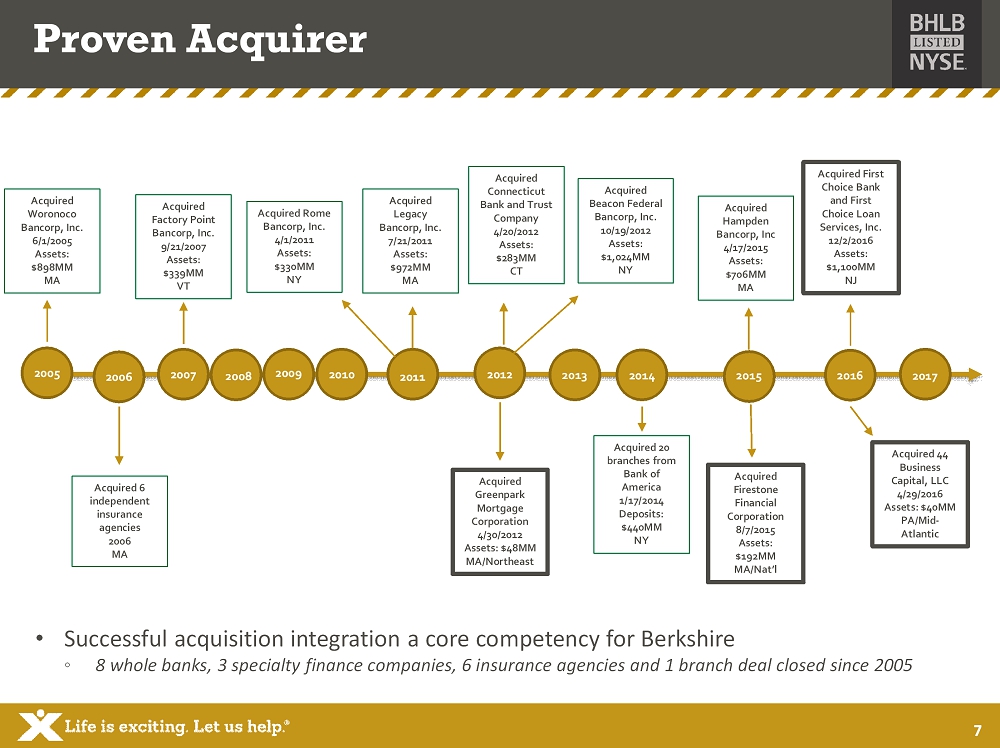
2005 2006 2007 2008 2009 2010 2011 2012 2013 2014 2015 2016 Acquired Woronoco Bancorp, Inc. 6/1/2005 Assets: $898MM MA Acquired 6 independent insurance agencies 2006 MA Acquired Factory Point Bancorp, Inc. 9/21/2007 Assets: $339MM VT Acquired Rome Bancorp, Inc. 4/1/2011 Assets: $330MM NY Acquired Legacy Bancorp, Inc. 7/21/2011 Assets: $972MM MA Acquired Greenpark Mortgage Corporation 4/30/2012 Assets: $48MM MA/Northeast Acquired Connecticut Bank and Trust Company 4/20/2012 Assets: $283MM CT Acquired 20 branches from Bank of America 1/17/2014 Deposits: $440MM NY Acquired Beacon Federal Bancorp, Inc. 10/19/2012 Assets: $1,024MM NY Acquired Firestone Financial Corporation 8/7/2015 Assets: $192MM MA/Nat’l Acquired 44 Business Capital, LLC 4/29/2016 Assets: $40MM PA/Mid - Atlantic Acquired First Choice Bank and First Choice Loan Services, Inc. 12/2/2016 Assets: $1,100MM NJ Acquired Hampden Bancorp, Inc 4/17/2015 Assets: $706MM MA • Successful acquisition integration a core competency for Berkshire ◦ 8 whole banks, 3 specialty finance companies, 6 insurance agencies and 1 branch deal closed since 2005 Proven Acquirer 2017 7

Experienced Integrator · Acquired 6 banks and 3 specialty finance companies over last 6 years · Experienced project transition team · Six Sigma disciplined acquisition road map · Extensive new employee o nboarding · Targeted customer and community outreach 8

Talent Recruitment Drives Growth Success with recruited teams drives profitability Middle Market Lending Small Business Home Lending Wealth Management Financial Services Key Characteristics · Established , well respected talent formerly attached to large banks focused outside our regions · Solid relationships within community · Strong integration within and across business lines · Business plans for breakeven and profitability 9
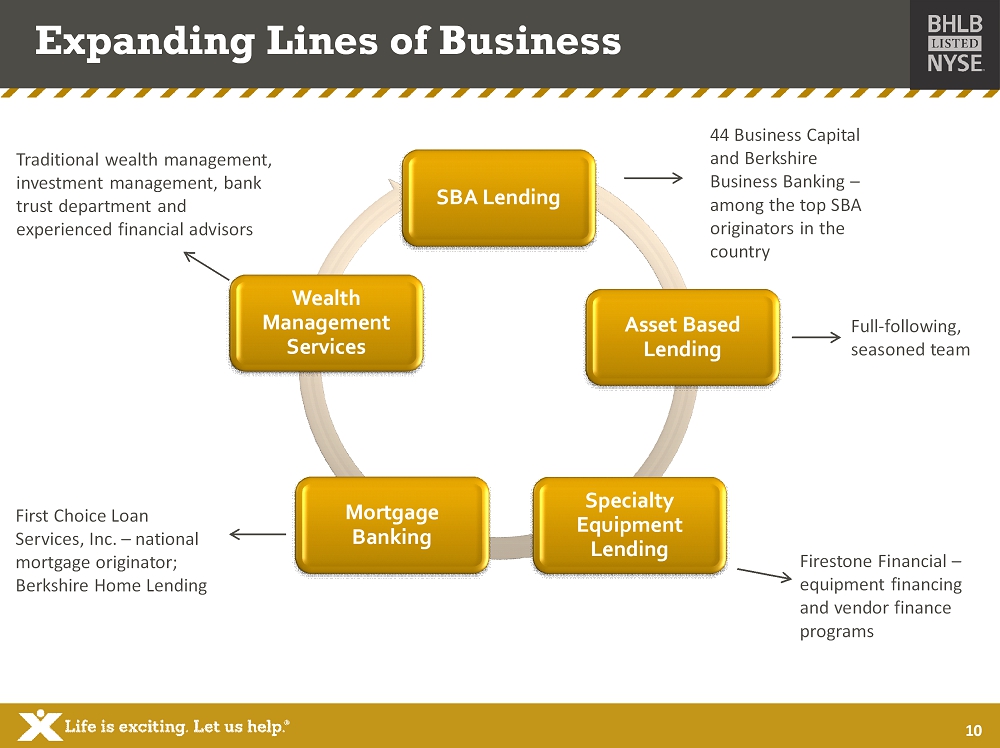
Expanding Lines of Business SBA Lending Asset Based Lending Specialty Equipment Lending Mortgage Banking Wealth Management Services Firestone Financial – equipment financing and vendor finance programs Full - following, seasoned team Traditional wealth management, investment management, bank trust department and experienced financial advisors First Choice Loan Services, Inc. – national mortgage originator; Berkshire Home Lending 44 Business Capital and Berkshire Business Banking – among the top SBA originators in the country 10
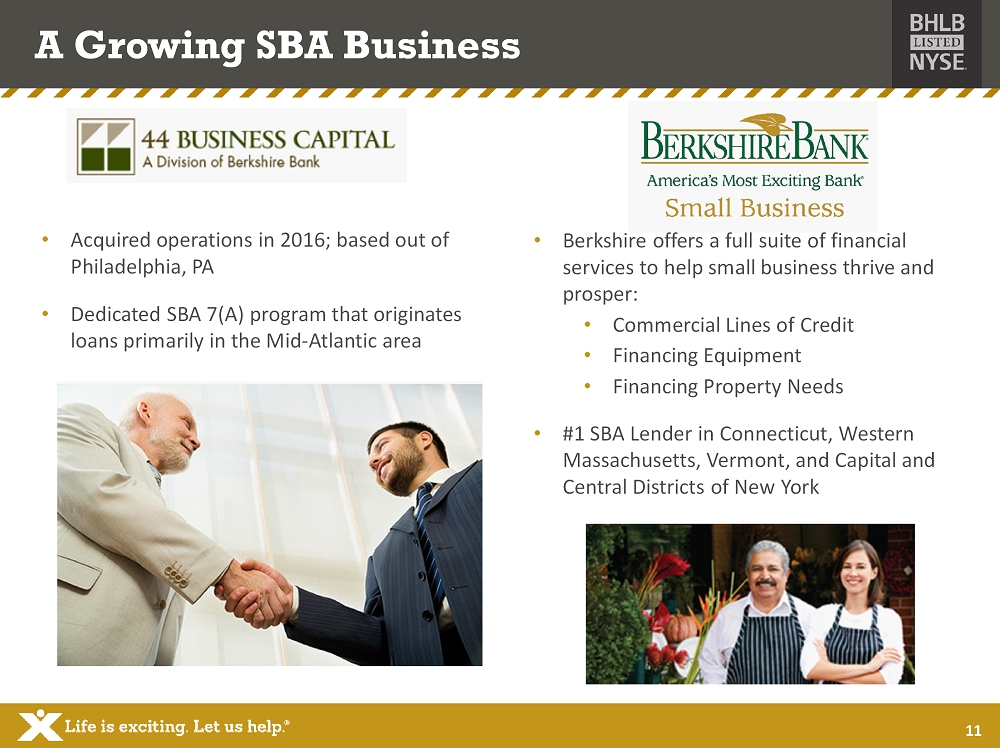
A Growing SBA Business • Acquired operations in 2016; based out of Philadelphia, PA • Dedicated SBA 7(A) program that originates loans primarily in the Mid - Atlantic area • Berkshire offers a full suite of financial services to help small business thrive and prosper: • Commercial Lines of Credit • Financing Equipment • Financing Property Needs • #1 SBA Lender in Connecticut, Western Massachusetts, Vermont, and Capital and Central Districts of New York 11

Building ABL Relationships • Serves middle - market companies across the Northeast • Offerings include lines of credit and term loans secured by accounts receivable, inventory, and other assets 12

Leveraging Niche Segment Lending • Acquired operations in 2015; based out of Needham, MA • Since 1965, Firestone Financial has provided equipment financing and vendor finance programs to help business grow • Nationally recognized specialty lending expertise in multiple segments including fitness, carnival, gaming and entertainment industries 13

Creating a National Mortgage Business • Acquired operations in 2016; based out of Princeton, NJ · Nationally recognized operations with loan production offices in NJ, PA, TX, NM, AZ, and CA • Exclusive managing member of Costco mortgage services program • Acquired as Greenpark Mortgage Corporation in 2012, based out of Needham MA • Approved originator of loans for sale to the FHA, VA, state housing agency programs, and other government sponsored mortgage programs • Preferred mortgage lender for the Massachusetts Teachers Association 14
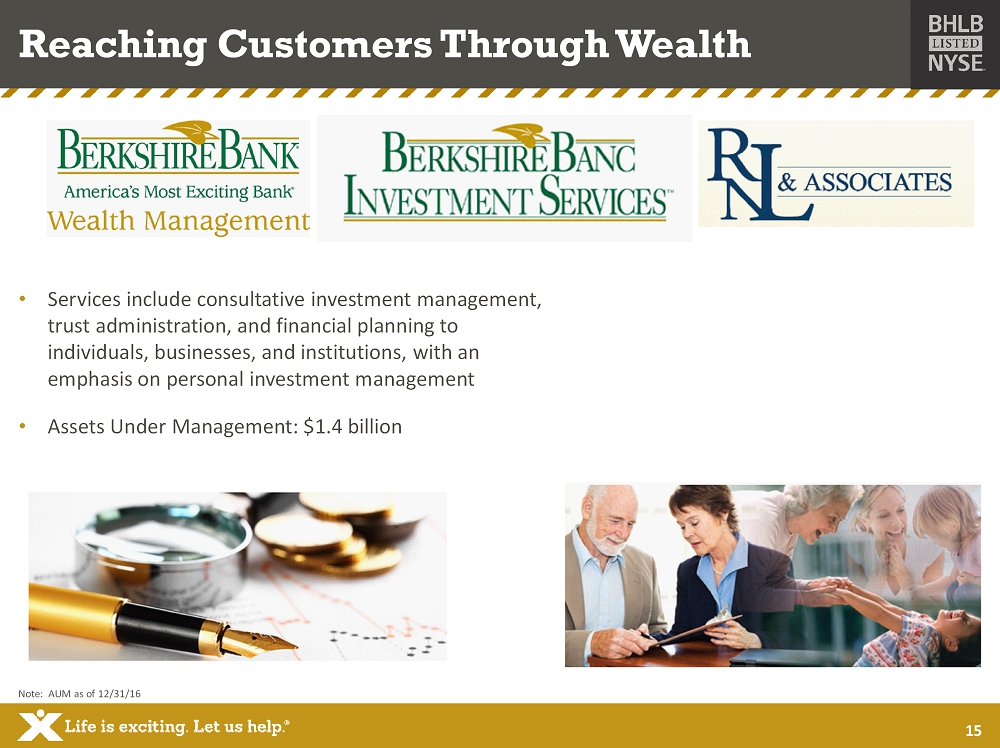
Reaching Customers Through Wealth • Services include consultative investment management, trust administration, and financial planning to individuals, businesses, and institutions, with an emphasis on personal investment management • Assets Under Management: $1.4 b illion 15 Note: AUM as of 12/31/16

Note: Fee revenue mix data for FY 16 Developing Diversified Revenue Streams Loan 24% Mortgage Banking 11% Deposit 37% Insurance 15% Wealth Management 13% Fee Revenue Mix 16 $53 $57 $69 $0 $20 $40 $60 $80 2014 2015 2016 Total Fee Income 14% Annual Growth Growing and Diversifying Fee Income $ millions

Driving Results • FY16: CORE EPS $2.20 ; GAAP EPS $1.88 • Record Earnings of $59 million in 2016 • Net income growth: 18% FY16 • Continued to diversify revenue streams • Fee income growth: 19% FY16 • Commercial loan growth: 18% FY16 • DDA growth: 18% FY16 • Significant improvement in profitability metrics • FY16 Efficiency: 58.9%; FY16 ROA Growth: 9% • Strict credit standards continue to drive pristine asset quality metrics Note: Reconciliation of Non - GAAP measures can be found in Appendix. Efficiency ratio is computed by dividing total core tangible non - interest expense by the sum of total net interest income on a fully taxable equivalent basis and total core non - interest income adjusted to include tax credit benefit of tax shelter investments. 17
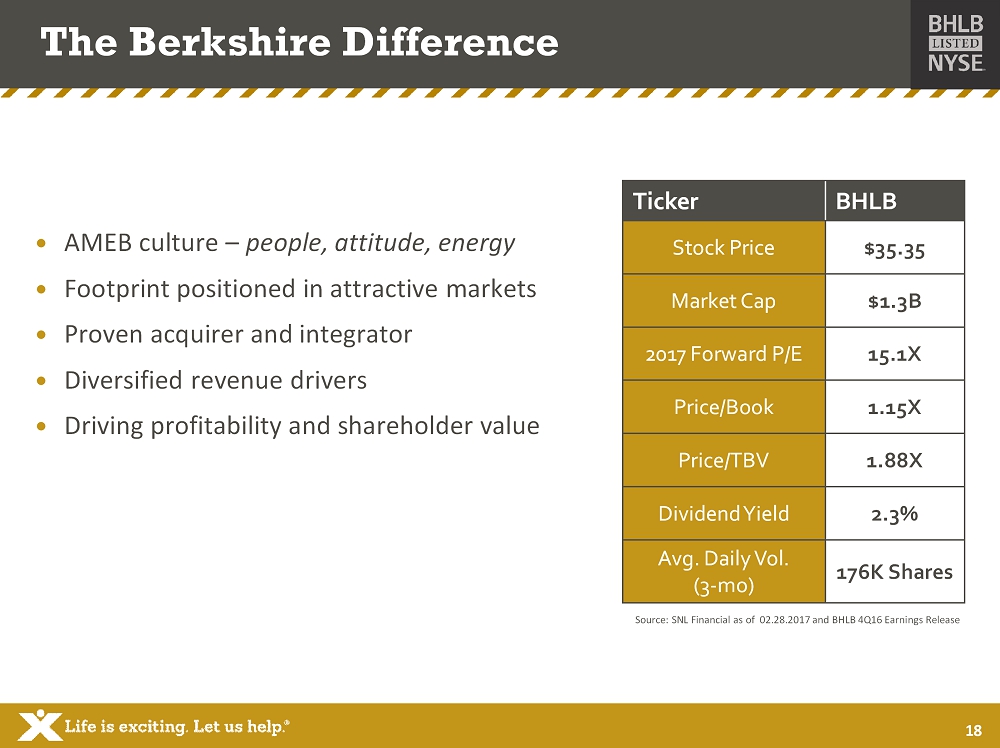
The Berkshire Difference · AMEB culture – people, attitude, energy · Footprint positioned in attractive markets · Proven acquirer and integrator · Diversified revenue drivers · Driving profitability and shareholder value Source: SNL Financial as of 02.28.2017 and BHLB 4Q16 Earnings Release Ticker BHLB Stock Price $35.35 Market Cap $1.3B 2017 Forward P/E 15.1X Price/Book 1.15X Price/TBV 1.88X Dividend Yield 2.3% Avg. Daily Vol. (3 - mo) 176K Shares 18

· Loan and Deposit Mix · Acquisition Discipline and Integration Experience · Berkshire Franchise Overview · Non - GAAP Reconciliation · Disclosures Appendix 19
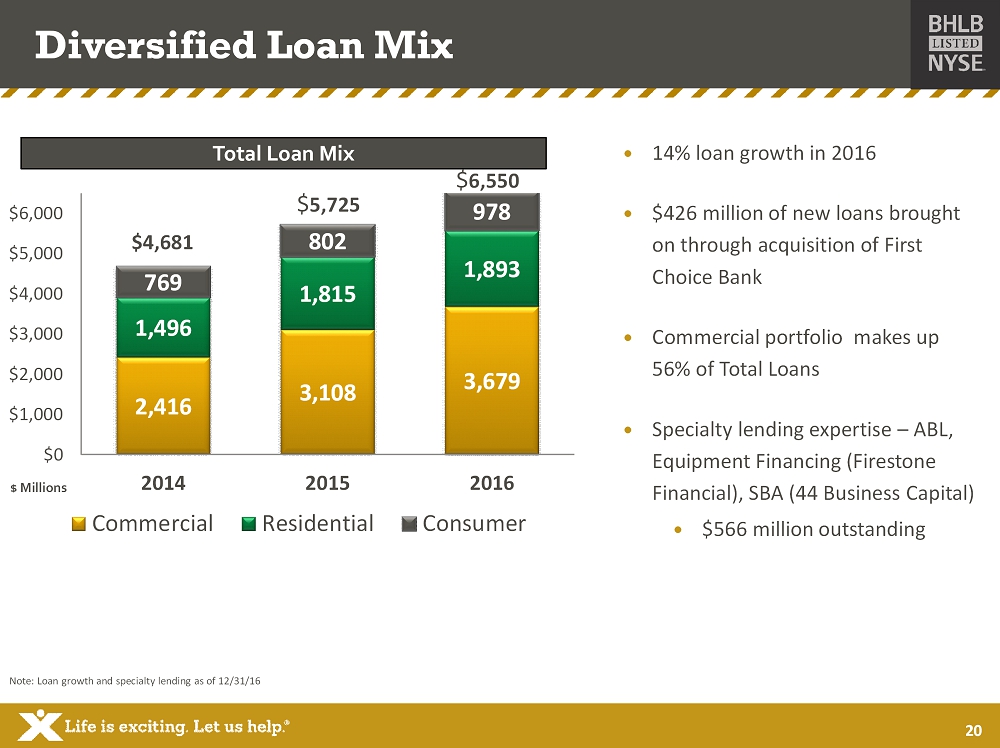
Diversified Loan Mix Note: Loan growth and specialty lending as of 12/31/16 2,416 3,108 3,679 1,496 1,815 1,893 769 802 978 $0 $1,000 $2,000 $3,000 $4,000 $5,000 $6,000 2014 2015 2016 Commercial Residential Consumer $ Millions · 14% loan growth in 2016 · $426 million of new loans brought on through acquisition of First Choice Bank · Commercial portfolio makes up 56% of Total Loans · Specialty lending expertise – ABL, Equipment Financing (Firestone Financial), SBA (44 Business Capital) · $566 million outstanding Total Loan Mix $4,681 $ 5,725 $ 6,550 20
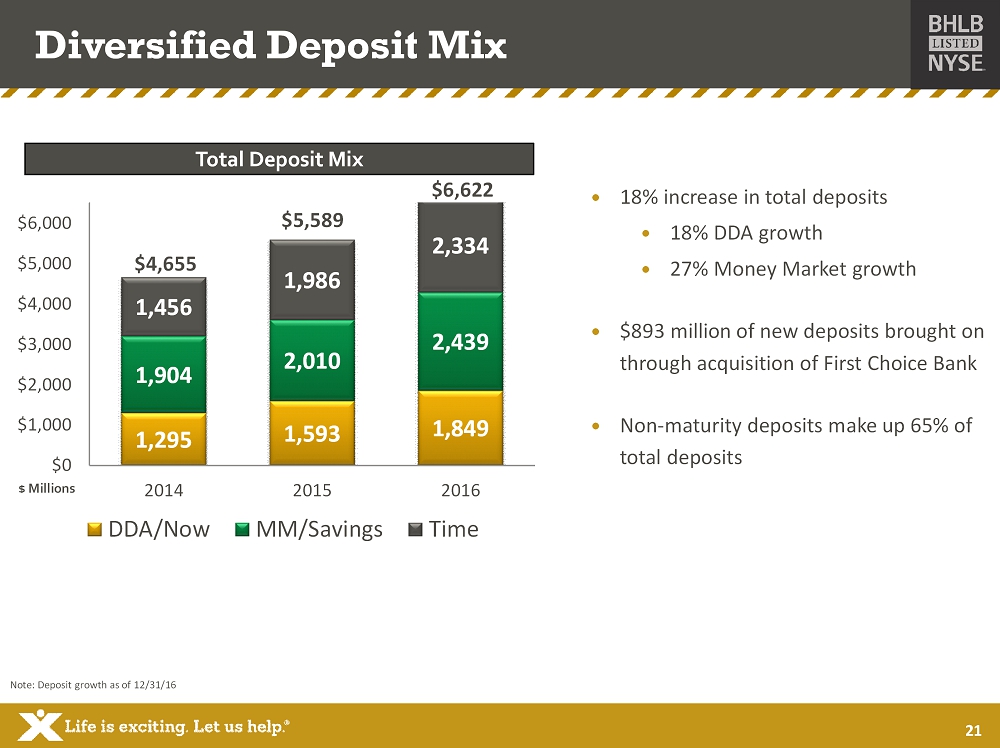
Diversified Deposit Mix 1,295 1,593 1,849 1,904 2,010 2,439 1,456 1,986 2,334 $0 $1,000 $2,000 $3,000 $4,000 $5,000 $6,000 2014 2015 2016 DDA/Now MM/Savings Time $ Millions · 18% increase in total deposits · 18% DDA growth · 27% Money Market growth · $893 million of new deposits brought on through acquisition of First Choice Bank · Non - maturity deposits make up 65% of total deposits Note: Deposit growth as of 12/31/16 Total Deposit Mix $4,655 $5,589 $6,622 21

Rome (NY) Legacy (MA) CBT (CT) Beacon (NY) Hampden (MA) First Choice (NJ) Combined Date closed 4/2011 7/2011 4/2012 10/2012 4/2015 12/2016 Assets ($millions) 330 970 280 1,025 690 1,100 4,395 (Total) Price/TBV (%) 120 110 140 111 133 109 121 (average) EPS accretion ($ ) 0.10 0.10 0.04 0.22 0.08 0.10 0.64 (Total) TBV dilution ($) 0.57 0.43 0.65 1.20 0.22 0.13 0.53 (average) Payback period (years) 4 4 5 - 7 4 3 1.25 3.7 (average) Acquisition Discipline and Integration Experience Note: Metrics based on projections at announcement 22

(Dollars in thousands) 2014 2015 2016 Net income $ 33,744 $ 49,518 $ 58,670 Non - core revenue (net) 9,691 (2,110) (534) Non - core expense (net) 8,492 17,611 15,761 Income taxes (7,185) (5,409) (5,455) Total core income (A) $ 44,742 $ 59,610 $ 68,442 Amortization of intangible assets (after tax) 2,887 2,138 $ 1,756 Total core tangible income (B) $ 47,629 $ 61,748 $ 70,198 Total revenue $ 226,461 $268,137 $298,118 Adj: Non - Core losses (gains) 9,691 (2,110) (534) Total core revenue $ 236,152 $266,027 $297,584 Total non - interest expense $ 165,986 $196,830 $203,302 Less: Non - core expense (net) (8,492) (17,611) (15,761) Core non - interest expense $ 157,494 $ 179,219 187,541 (Dollars in millions, except per share data) Total average assets (C) $ 6,171 $ 7,249 $ 7,985 Total average equity (D) $ 693 $ 805 $ 911 Total average intangible assets 278 311 363 Total average tangible equity (E) $ 415 $ 494 $ 563 Total shareholders ' equity, period - end $ 709 $ 887 $ 1,093 Less: Intangible assets, period - end (276) (335) (422) Total tangible shareholders ' equity, period - end (F) $ 433 $ 553 $ 671 Total shares outstanding, period - end ( thousands ) (G) 25,183 30,974 35,673 Average diluted shares outstanding ( thousands ) (H) 24,854 28,564 31,167 Core earnings per common share, diluted (A/H) $ 1.80 $ 2.09 $ 2.20 Tangible book value per share, period - end (F/G) $ 17.19 $ 17.84 $ 18.81 Core return on assets % (A/C) 0.73 0.82 0.86 Core return on equity % (A/D) 6.46 7.40 7.51 Core return on tangible equity % (B/E) 11.48 12.49 12.47 Non - GAAP Reconciliation Note: Non - core revenues included $8.8MM in hedge termination costs in 2014. Non - core expenses include merger related costs of $13.5M M, $13.2MM, and $5.4MM in 2016, 2015, and 2014 respectively .

FORWARD LOOKING STATEMENTS This document contains forward - looking statements as defined in the Private Securities Litigation Reform Act of 1995 . There are several factors that could cause actual results to differ significantly from expectations described in the forward - looking statements . For a discussion of such factors, please see Berkshire’s most recent reports on Forms 10 - K and 10 - Q filed with the Securities and Exchange Commission and available on the SEC’s website at www . sec . gov . Berkshire does not undertake any obligation to update forward - looking statements . 24

NON - GAAP FINANCIAL MEASURES This document contains certain non - GAAP financial measures in addition to results presented in accordance with Generally Accepte d Accounting Principles (“GAAP”). These non - GAAP measures provide supplemental perspectives on operating results, performance tren ds, and financial condition. They are not a substitute for GAAP measures; they should be read and used in conjunction with the Co mpa ny’s GAAP financial information. A reconciliation of non - GAAP financial measures to GAAP measures is included on pages F - 9 and F - 10 i n the accompanying financial tables. In all cases, it should be understood that non - GAAP per share measures do not depict amounts that accrue directly to the benefit of shareholders. The Company utilizes the non - GAAP measure of core earnings in evaluating operating trends, including components for core revenue and expense. These measures exclude items which the Company does not view as related to its normalized operations. These items in clu de securities gains/losses, merger costs, restructuring costs, and systems conversion costs. Non - core adjustments are presented net of an adjustment for income tax expense. This adjustment is determined as the difference between the GAAP tax rate and the effectiv e t ax rate applicable to core income. The efficiency ratio is adjusted for non - core revenue and expense items and for tax preference items. The Company also calculates measures related to tangible equity, which adjust equity (and assets where applicable) to exclude int ang ible assets due to the importance of these measures to the investment community. Charges related to merger and acquisition activity consist primarily of severance/benefit related expenses, contract terminat ion costs, systems conversion costs, variable compensation expenses, and professional fees. These charges are related to the following b usi ness combinations: First Choice (pending), 44 Business Capital, Hampden Bancorp, and Firestone Financial. Restructuring costs gene ral ly consist of costs and losses associated with the disposition of assets and liabilities and lease terminations, including costs related to branch sales. The Company’s disclosures of organic growth of loans in 2016 are adjusted for the acquisition of the business operations rela ted to 44 Business Capital. 25

Notes

Notes

If you have any questions, please contact : Allison O’Rourke 99 North Street Pittsfield, MA 01202 Investor Relations Officer (413) 236 - 3149 aorourke@berkshirebank.com