EXHIBIT 99.1
| consistency builds value |
Page 4 of Page 4
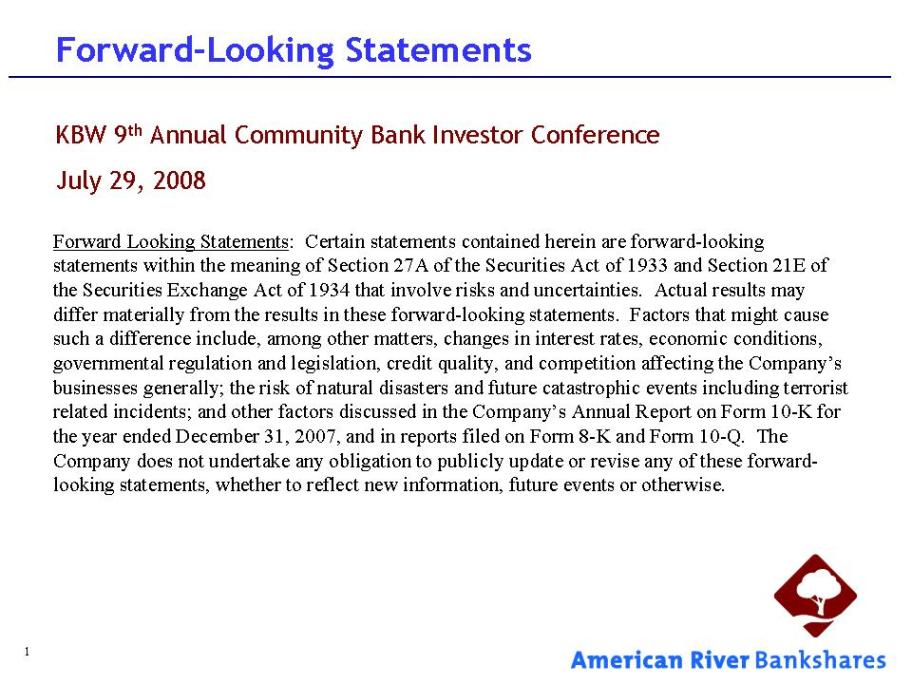
| Forward-Looking Statements |
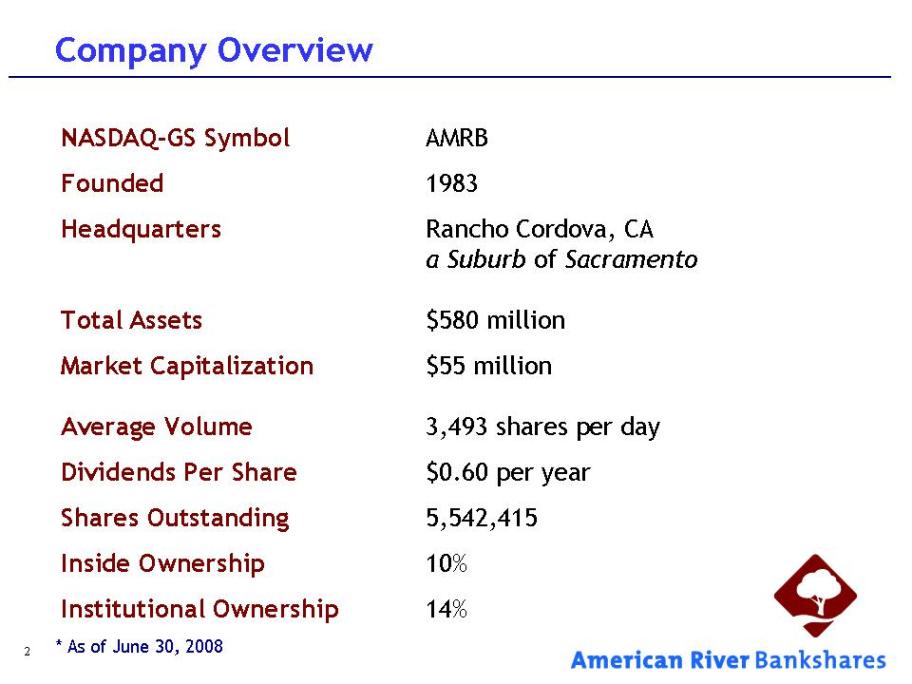
| Company Overview |
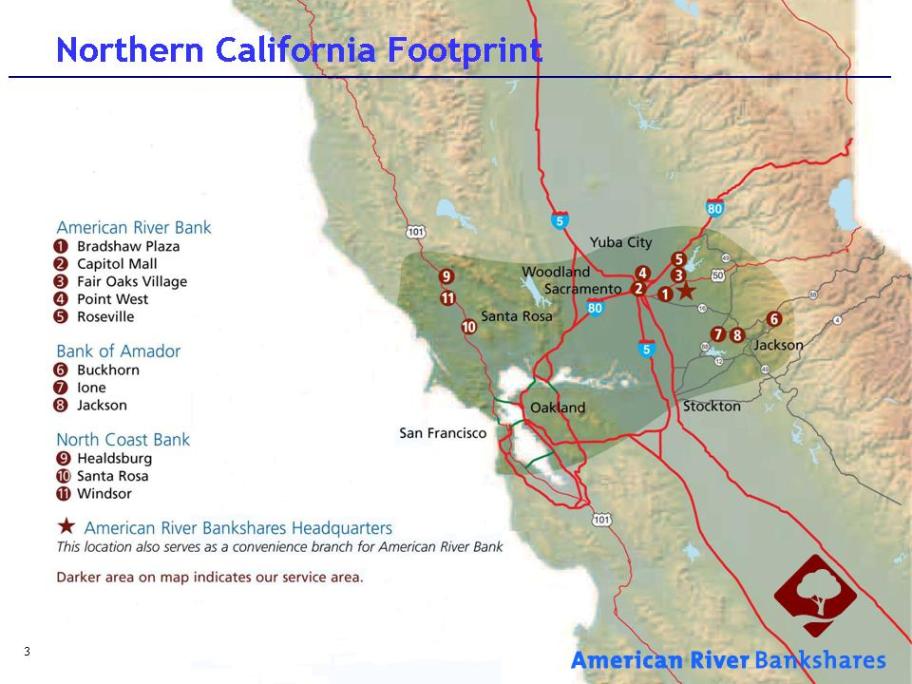
| Northern California Footprint American River Bank 1. Bradshaw Plaza 2. Capitol Mall 3. Fair Oaks Village 4. Point West 5. Roseville Bank of Amador 6. Buckhorn 7. Ione 8. Jackson North Coast Bank 9. Healdsburg 10. Santa Rosa 11. Windsor *American River Bankshares Headquarters This location also serves as a convenience branch for American River Bank Darker area on map indicates our service area. |
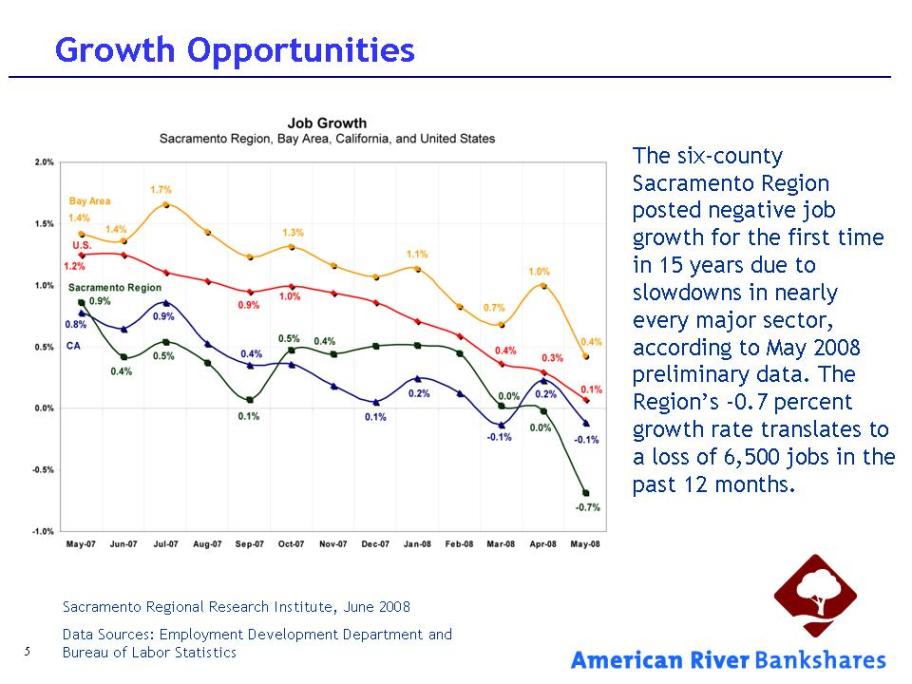
| Growth Opportunities |

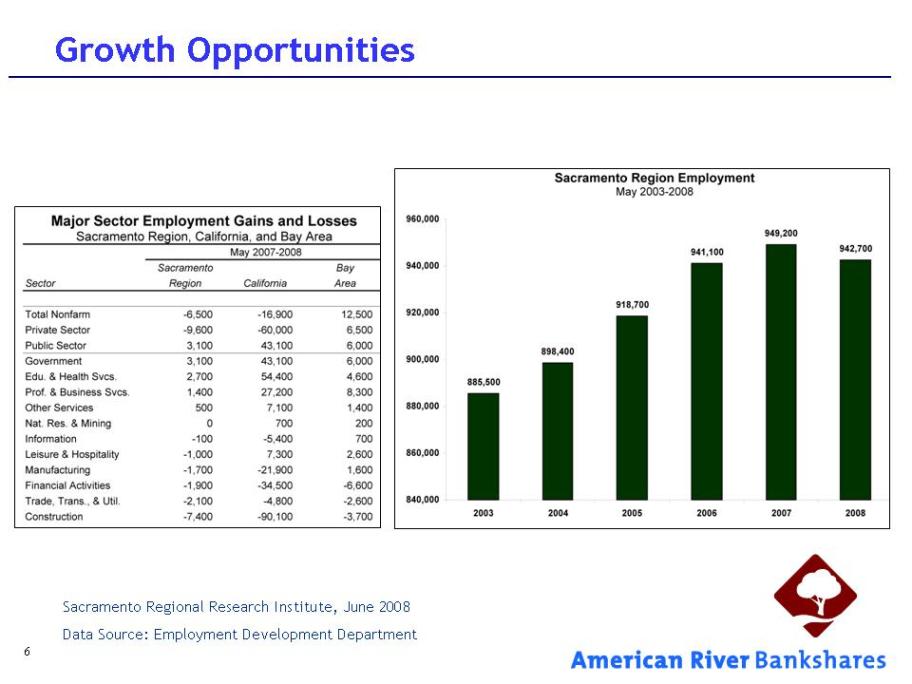
| Growth Opportunities |
| Growth Opportunities |
| Why Buy AMRB Now? |
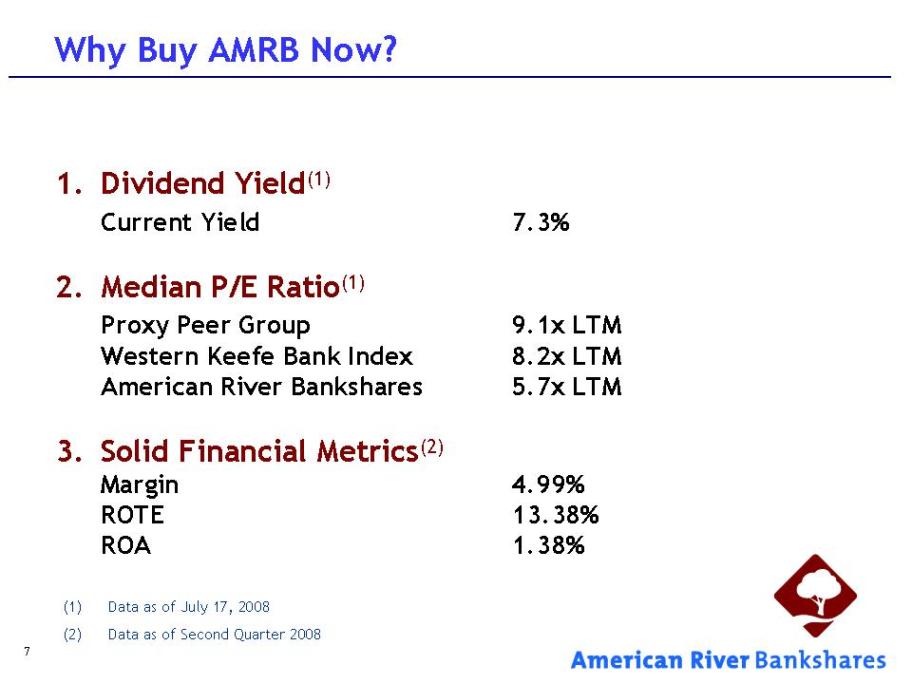
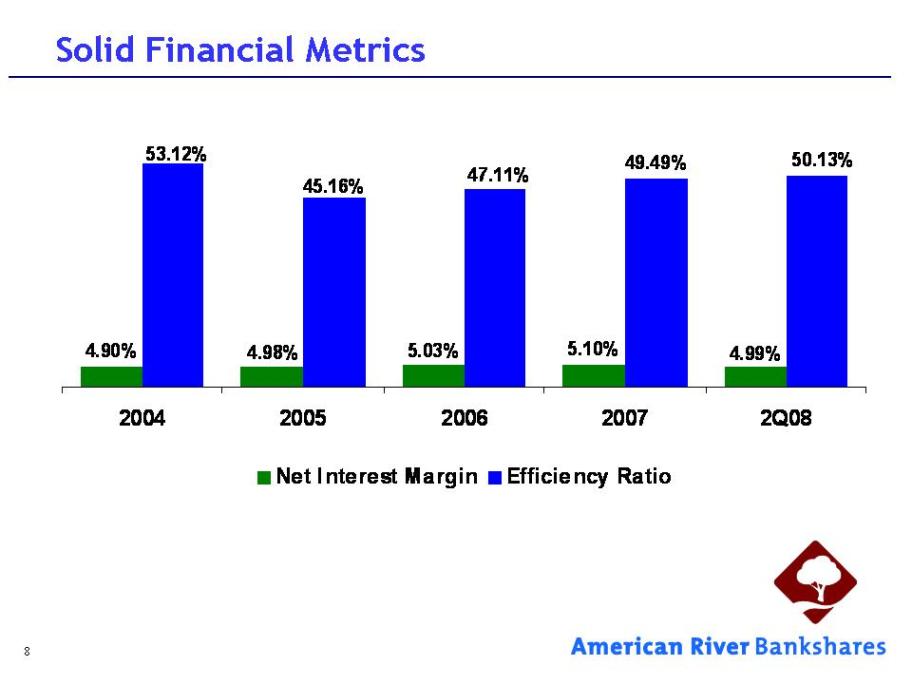
| Solid Financial Metrics |
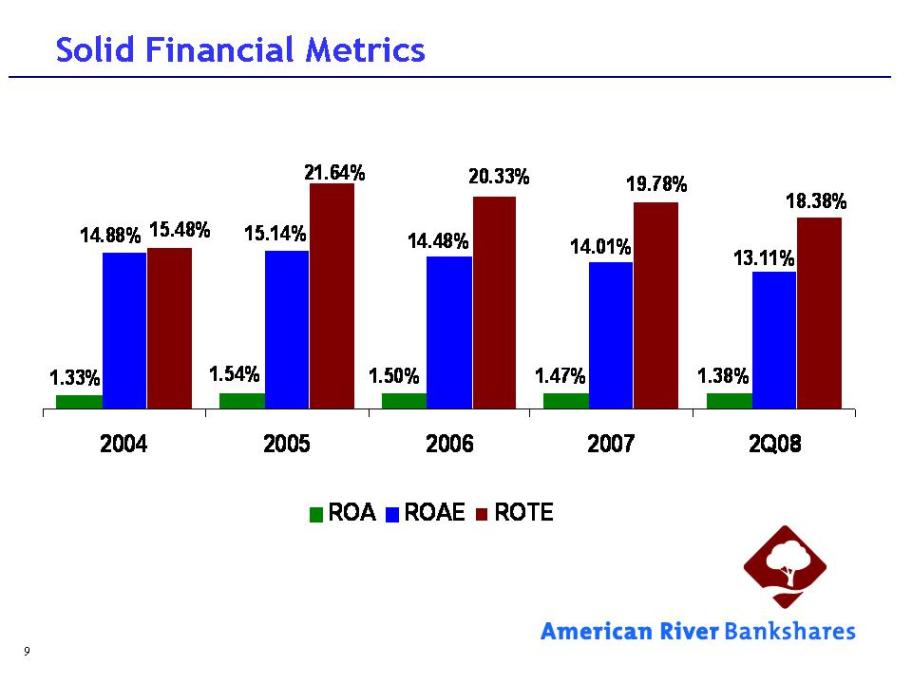
| Solid Financial Metrics |
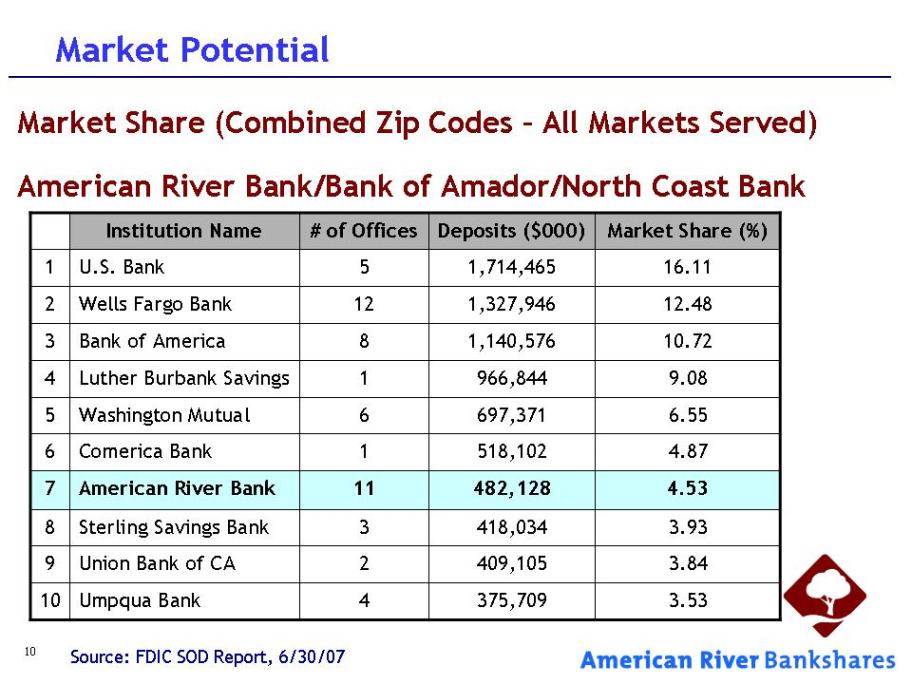
| Market Potential |
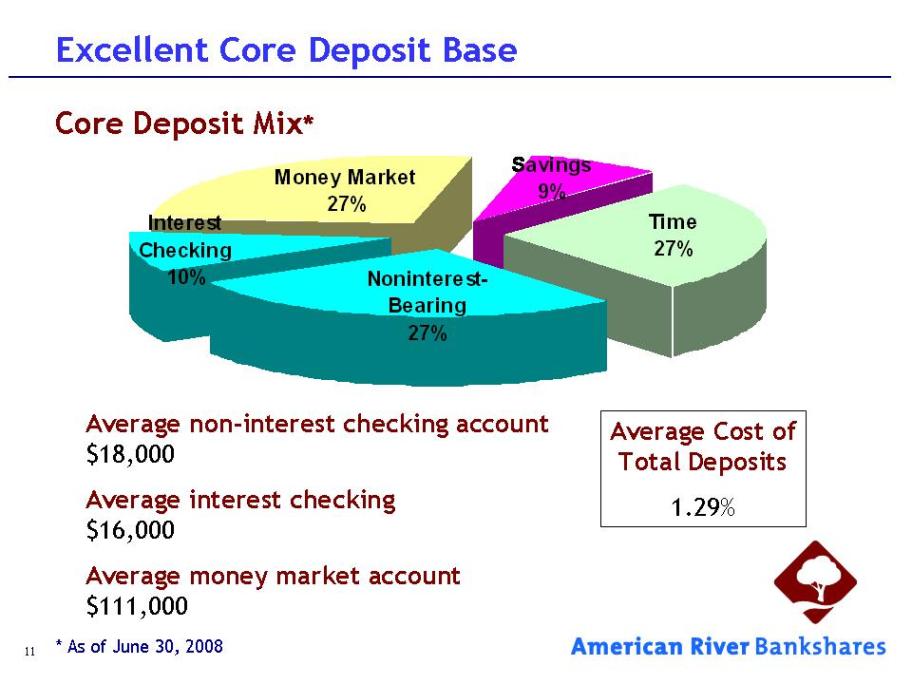
| Excellent Core Deposit Base |
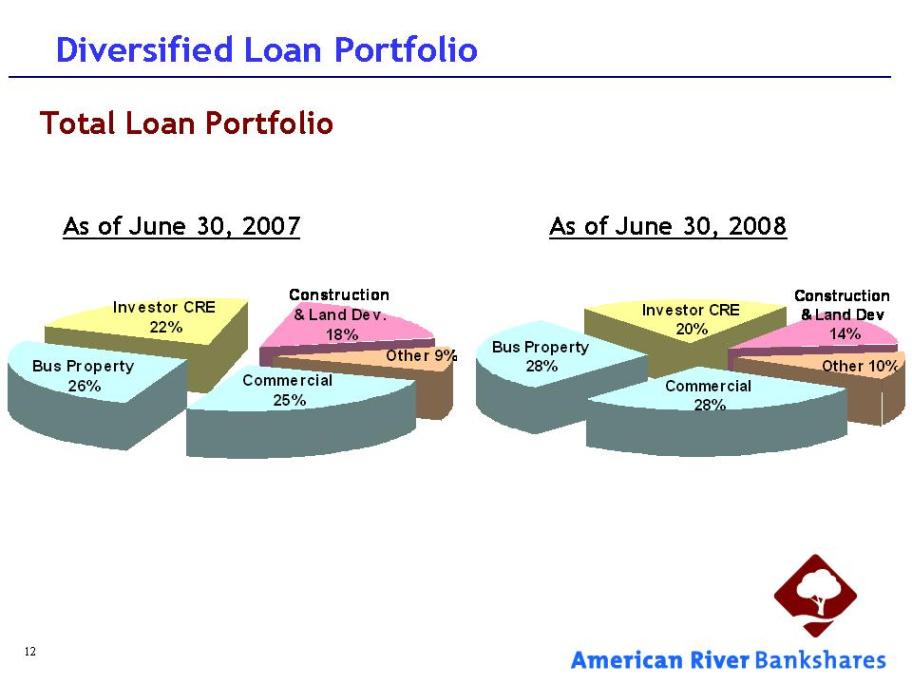
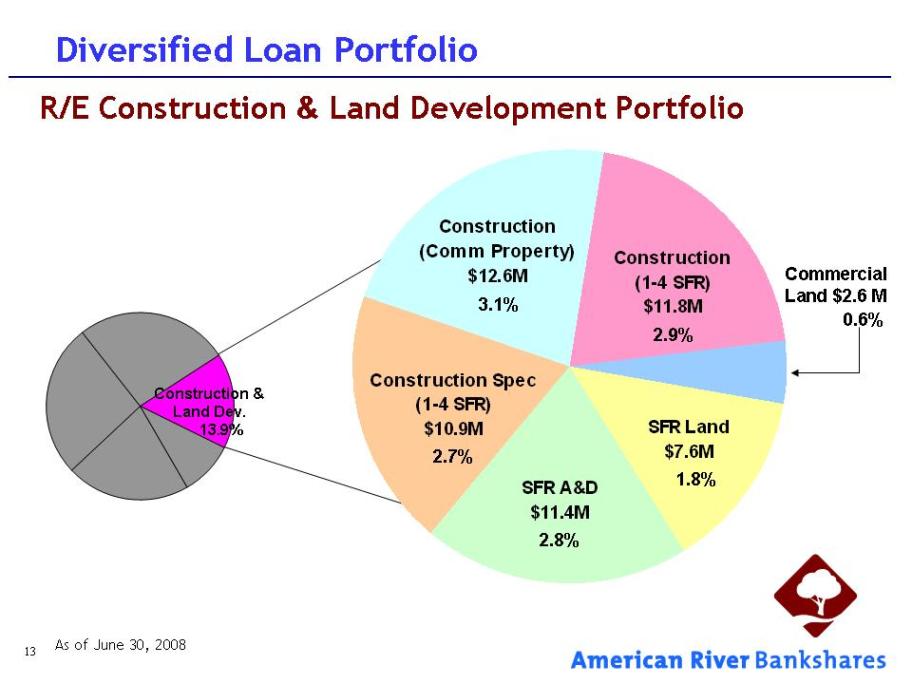
| Diversified Loan Portfolio |
| Diversified Loan Portfolio |
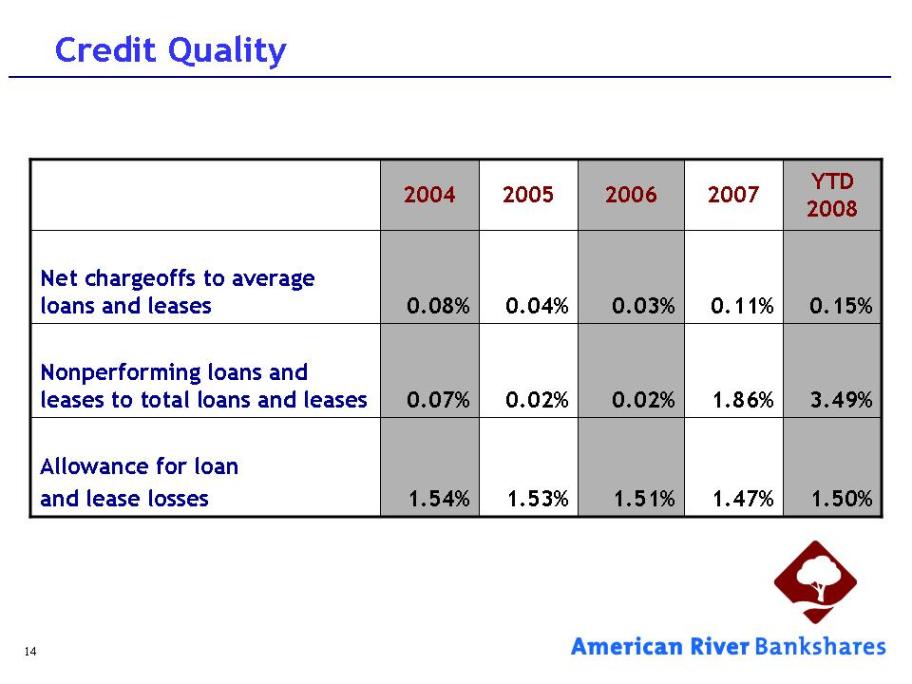
| Credit Quality |
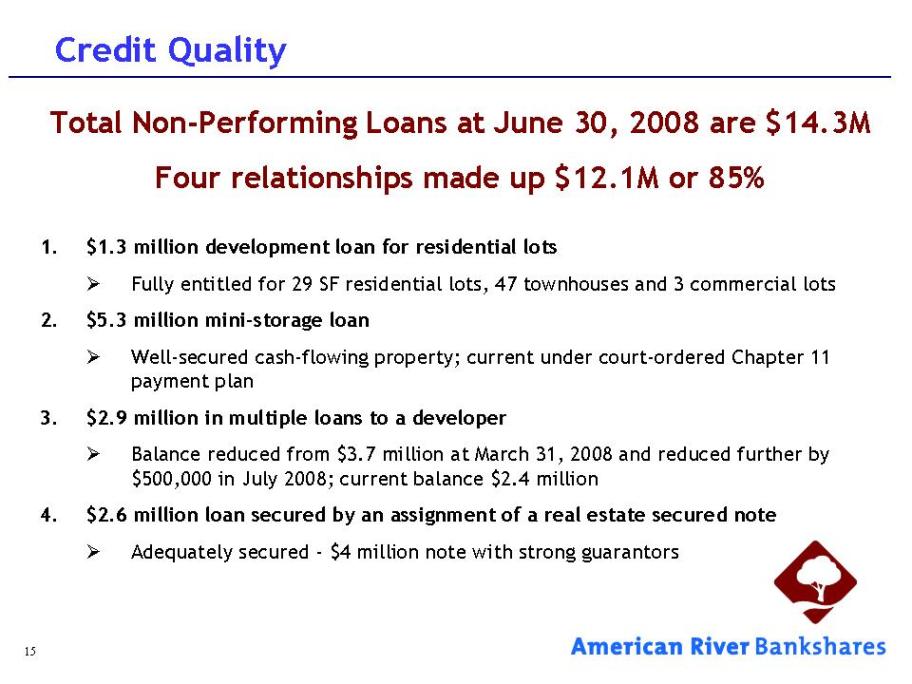
| Credit Quality Total Non-Performing Loans at June 30, 2008 are $14.3M Four relationships made up $12.1M or 85% 1. $1.3 million development loan for residential lots > Fully entitled for 29 SF residential lots, 47 townhouses and 3 commercial lots 2. $5.3 million mini-storage loan > Well-secured cash-flowing property; current under court-ordered Chapter 11 payment plan 3. $2.9 million in multiple loans to a developer > Balance reduced from $3.7 million at March 31, 2008 and reduced further by $500,000 in July 2008; current balance $2.4 million 4. $2.6 million loan secured by an assignment of a real estate secured note > Adequately secured - $4 million note with strong guarantors |
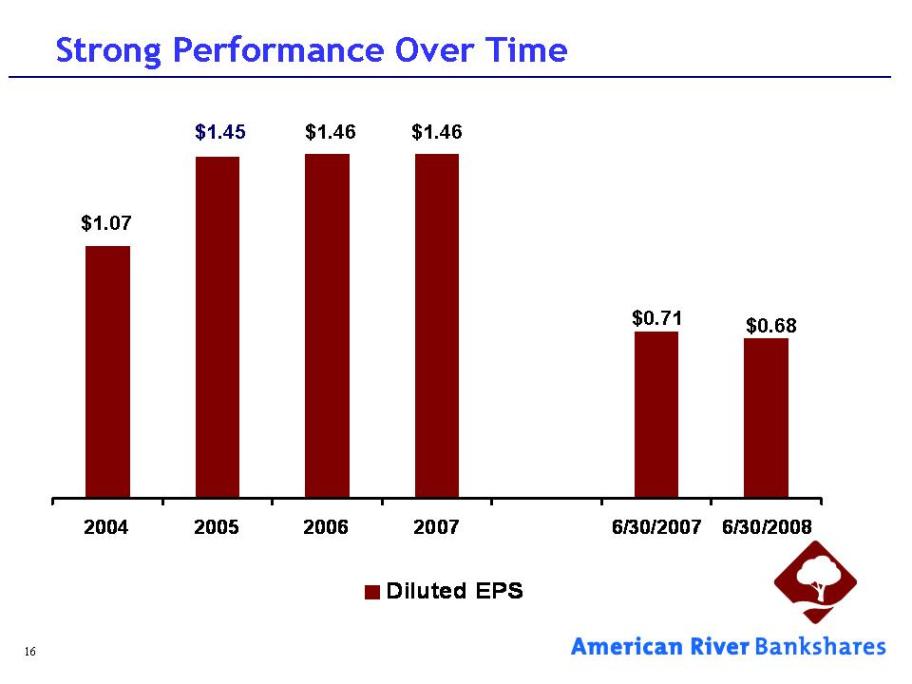
| Strong Performance Over Time |
| Strong Performance Over Time Shareholder Value > 98 consecutive profitable quarters > YTD: 80,500 shares repurchased 2007: 406,350 shares repurchased > Cash dividends since 1992; quarterly since 1Q04 Dividend Yield of 7.3% as of July 17, 2008 As of June 30, 2008 |
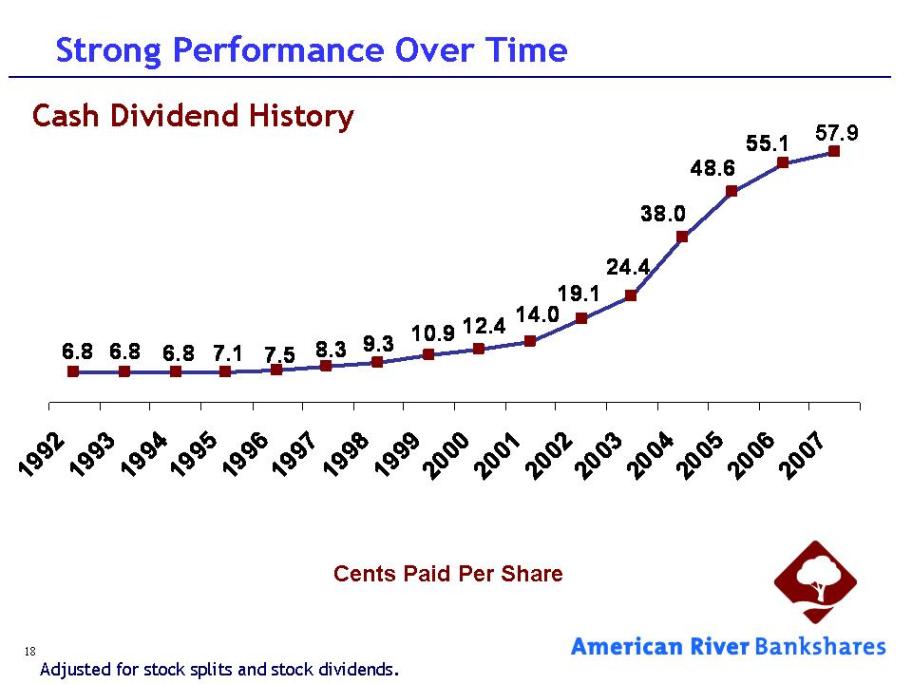
| Strong Performance Over Time Cash Dividend History 1992 6.8 1993 6.8 1994 6.8 1995 7.1 1996 7.5 1997 8.3 1998 9.3 1999 10.9 2000 12.4 2001 14.0 2002 19.1 2003 24.4 2004 38.0 2005 48.6 2006 55.1 2007 57.9 |
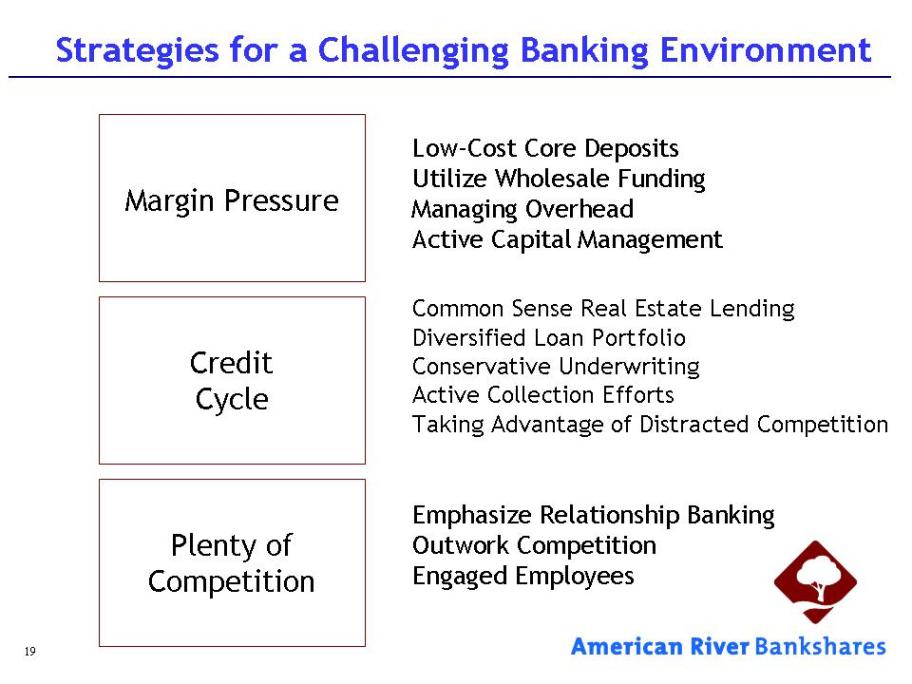
| Strategies for a Challenging Banking Environment |
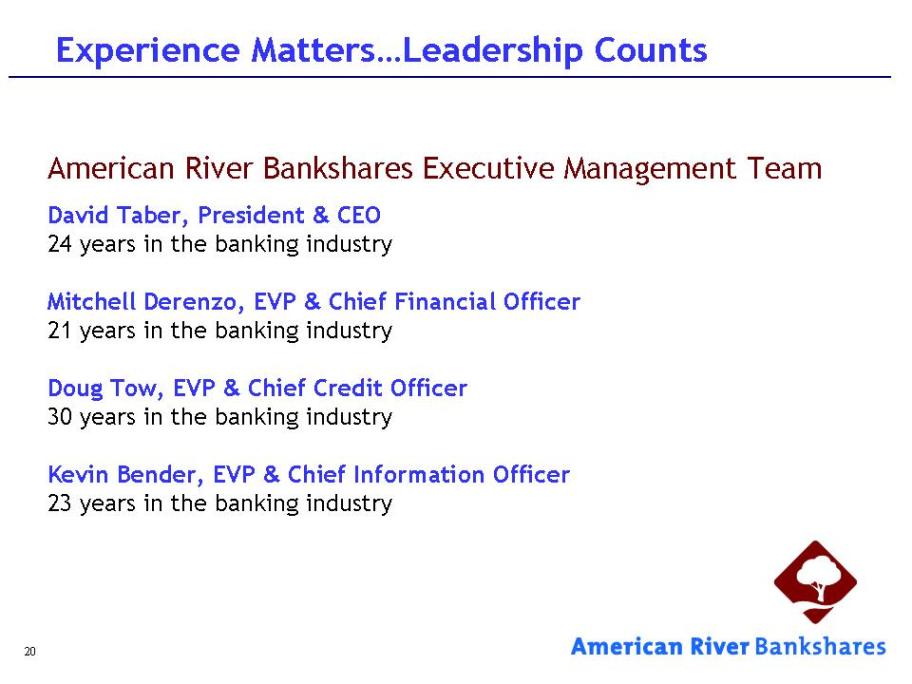
| Experience Matters...Leadership Counts |
| Strategic Direction Organic Growth in Markets We Currently Serve Outwork Competition Engaged Employees Emphasize Business Banking Low-Cost Core Deposits Focus on Credit Quality Common Sense Real Estate Lending Managing Overhead Active Capital Management |
| Strategic Direction Corporate Culture Highly Visible Community Philanthropy Program Award-winning employee volunteer program Donated 3,124 hours or 24 hours per employee in 2007 American River Bankshares Foundation Engaged Employees Relationship Managers: all employees empowered to serve the client Career development and internal promotion Survey: 91% employee satisfaction rating Team building events Town Hall meetings align to strategic vision Recognition program |
| Thank You Questions & Answers consistency builds value Mitchell A. Derenzo - Executive Vice President & Chief Financial Officer |