Exhibit 99.1
Right People. Right Products. Right Market.
David T. Taber, President & CEO

Forward-Looking Statements
Sandler O’Neill + Partners, L.P.
West Coast Financial Services Conference
March 8, 2011
Certain statements contained herein are forward-looking statements within the meaning of Section 27A of the Securities Act of 1933 and Section 21E of the Securities Exchange Act of 1934 and subject to the safe harbor provisions of the Private Securities Litigation Reform Act of 1995, that involve risks and uncertainties. Actual results may differ materially from the results in these forward-looking statements. Factors that might cause such a difference include, among other matters, changes in interest rates, economic conditions, governmental regulation and legislation, credit quality, and competition affecting the Company’s businesses generally; the risk of natural disasters and future catastrophic events including terrorist related incidents; and other factors discussed in the Company’s Annual Report on Form 10-K for the year ended December 31, 2010, and in subsequent reports filed on Form 10-Q and Form 8-K. The Company does not undertake any obligation to publicly update or revise any of these forward-looking statements, whether to reflect new information, future events or otherwise, except as required by law.
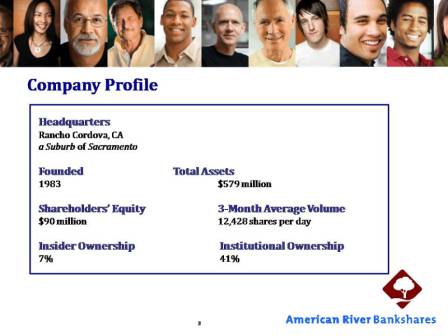
Company Profile
| Headquarters | |
| Rancho Cordova, CA | |
a Suburb of Sacramento | |
| | |
| Founded | Total Assets |
| 1983 | $579 million |
| | |
| Shareholders’ Equity | 3-Month Average Volume |
| $90 million | 12,428 shares per day |
| | |
| Insider Ownership | Institutional Ownership |
| 7% | 41% |
Diverse and Large Market
$38 Billion in Deposit Potential*
*FDIC market share data for Amador, Placer, Sacramento and Sonoma Counties as of June 30, 2010
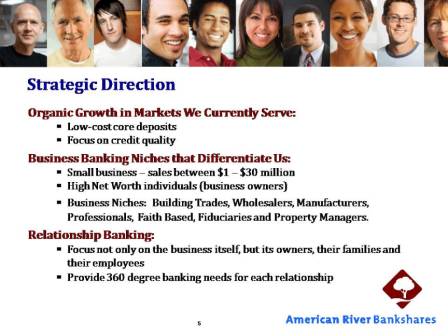
Strategic Direction
Organic Growth in Markets We Currently Serve:
| § | Focus on credit quality |
Business Banking Niches that Differentiate Us:
| § | Small business – sales between $1 – $30 million |
| § | High Net Worth individuals (business owners) |
| § | Business Niches: Building Trades, Wholesalers, Manufacturers, Professionals, Faith Based, Fiduciaries and Property Managers. |
Relationship Banking:
| § | Focus not only on the business itself, but its owners, their families and their employees |
| § | Provide 360 degree banking needs for each relationship |
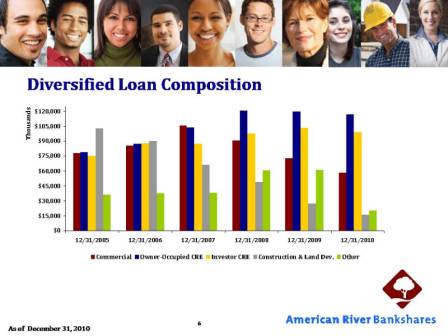
Diversified Loan Composition
As of December 31, 2010
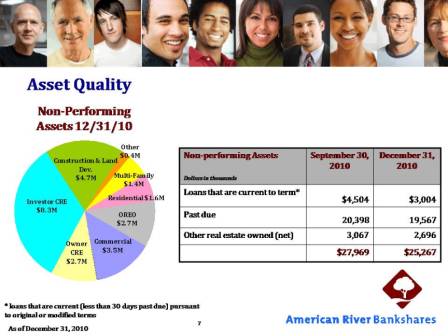
Asset Quality
Non-Performing Assets 12/31/10
Non-performing Assets Dollars in thousands | | September 30, 2010 | | | December 31, 2010 | |
| Loans that are current to term* | | $ | 4,504 | | | $ | 3,004 | |
| Past due | | | 20,398 | | | | 19,567 | |
| Other real estate owned (net) | | | 3,067 | | | | 2,696 | |
| | | $ | 27,969 | | | $ | 25,267 | |
* loans that are current (less than 30 days past due) pursuant to original or modified terms As of December 31, 2010
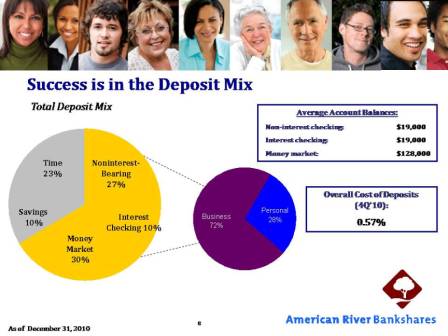
Success is in the Deposit Mix
Total Deposit Mix
Average Account Balances:
| Non-interest checking: | $19,000 |
| Interest checking: | $19,000 |
| Money market: | $128,000 |
Overall Cost of Deposits (4Q’10):
0.57%
As of December 31, 2010
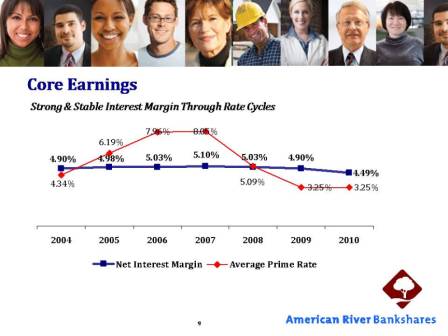
Core Earnings
Strong & Stable Interest Margin Through Rate Cycles
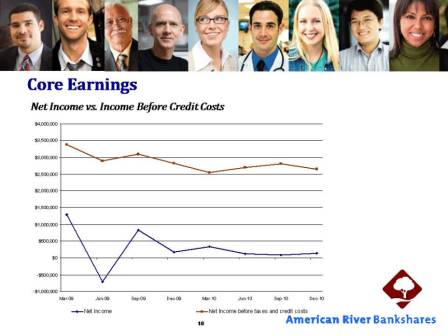
Core Earnings
Net Income vs. Income Before Credit Costs
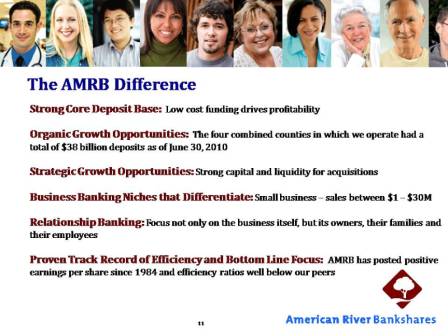
The AMRB Difference
Strong Core Deposit Base: Low cost funding drives profitability
Organic Growth Opportunities: The four combined counties in which we operate had a total of $38 billion deposits as of June 30, 2010
Strategic Growth Opportunities: Strong capital and liquidity for acquisitions
Business Banking Niches that Differentiate: Small business – sales between $1 – $30M
Relationship Banking: Focus not only on the business itself, but its owners, their families and their employees
Proven Track Record of Efficiency and Bottom Line Focus: AMRB has posted positive earnings per share since 1984 and efficiency ratios well below our peers