Hong Kong Exchanges and Clearing Limited and The Stock Exchange of Hong Kong Limited take no responsibility for the contents of this announcement, make no representation as to its accuracy or completeness and expressly disclaim any liability whatsoever for any loss howsoever arising from or in reliance upon the whole or any part of the contents of this announcement. PETROCHINA COMPANY LIMITED (A joint stock limited company incorporated in the People's Republic of China with limited liability) (Hong Kong Stock Exchange Stock Code: 857; Shanghai Stock Exchange Stock Code: 601857) ANNOUNCEMENT THIRD QUARTERLY REPORT OF 2023 Important Notice o The board of directors, the supervisory committee and the directors, supervisors and senior management of PetroChina Company Limited (the "Company") warrant the truthfulness, accuracy and completeness of the information contained in this quarterly report and that there are no misrepresentation or misleading statements contained in or material omissions from this quarterly report and jointly and severally accept full responsibility thereof. o This quarterly report has been approved at the 4th meeting of the ninth session of the board of directors of the Company. All directors of the Company have attended this board meeting. o Mr. Dai Houliang, chairman of the Company, Mr. Huang Yongzhang, director and president of the Company, and Mr. Wang Hua, chief financial officer of the Company, warrant the truthfulness, accuracy and completeness of the financial information set out in this quarterly report. o The financial statements of the Company and its subsidiaries (the "Group") have been prepared in accordance with the China Accounting Standards ("CAS") and the International Financial Reporting Standards ("IFRS"), respectively. The financial statements set out in this quarterly report are unaudited. 1
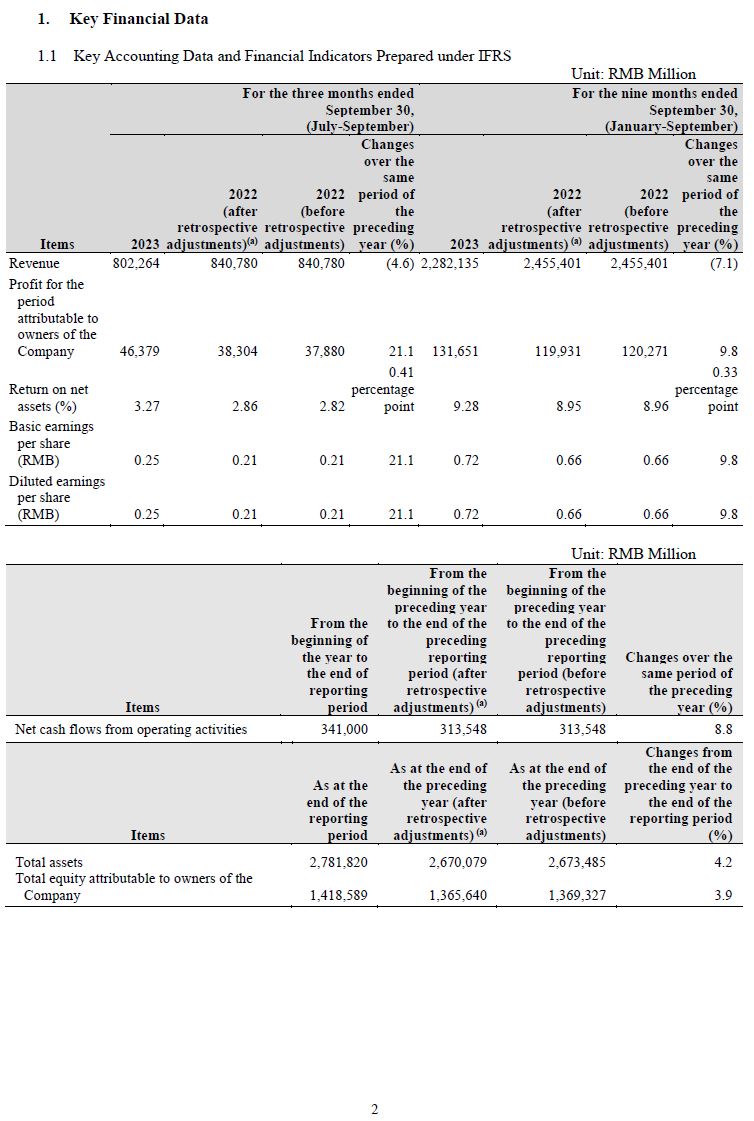
1. Key Financial Data 1.1 Key Accounting Data and Financial Indicators Prepared under IFRS Unit: RMB Million ----------------- ----------------------------------------------- ------------------------------------------------- For the three months ended For the nine months ended September 30, September 30, Items (July-September) (January-September) ----------------------------------------------- ------------------------------------------------- 2023 2022 2022 Changes 2023 2022 2022 Changes over the over the esame esame ) period of (after period of (after (before the retrospective (before the retrospective retrospectiv preceding adjustments) retrospectiv preceding adjustments)(a adjustments) year (%) (a) adjustments) year (%) ----------------- -------- -------------- ------------ ---------- --------- --------------- ------------ ---------- Revenue 802,264 840,780 840,780 (4.6) 2,282,135 2,455,401 2,455,401 (7.1) Profit for the period attributable to owners of the Company 46,379 38,304 37,880 21.1 131,651 119,931 120,271 9.8 0.41 0.33 Return on net percentage percentage assets (%) 3.27 2.86 2.82 point 9.28 8.95 8.96 point Basic earnings per share (RMB) 0.25 0.21 0.21 21.1 0.72 0.66 0.66 9.8 Diluted earnings per share (RMB) 0.25 0.21 0.21 21.1 0.72 0.66 0.66 9.8 ----------------- -------- -------------- ------------ ---------- --------- --------------- ------------ ---------- Unit: RMB Million -------------------------------------------- -------------- ----------------- ----------------- ------------------- Items From the From the From the Changes over the beginning of the preceding beginning of year to the end the preceding of the year to the end preceding of the beginning of reporting preceding the year to period (after reporting the end of retrospective period (before same period of reporting adjustments) retrospective the preceding period (a) adjustments) year (%) -------------------------------------------- -------------- ----------------- ------------------- -------------------------------------------- -------------- ----------------- ----------------- ------------------- Net cash flows from operating activities 341,000 313,548 313,548 8.8 --------------------------------------------- ------------- ----------------- ----------------- ------------------- As at the end of the As at the end Changes from the preceding year of the end of the As at the (after preceding year preceding year to end of the retrospective (before the end of the reporting adjustments) retrospective reporting period Items period (a) adjustments) (%) --------------------------------------------- ------------- ----------------- ------------------- --------------------------------------------- ------------- ----------------- ----------------- ------------------- Total assets 2,781,820 2,670,079 2,673,485 4.2 Total equity attributable to owners of the Company 1,418,589 1,365,640 1,369,327 3.9 --------------------------------------------- ------------- ----------------- ----------------- ------------------- 2

1.2 Key Accounting Data and Financial Indicators Prepared under CAS 1.2.1 Key Accounting Data and Financial Indicators Unit: RMB Million ------------------- ----------------------------------------------- ----------------------------------------------- Items For the three months ended For the nine months ended September 30, September 30, (July-September) (January-September) ----------------------------------------------- ----------------------------------------------- 2023 2022 2022 Changes 2023 2022 2022 Changes over the over the same e same (after period of (after period of retrospective (before the retrospectiv (before the adjustments) retrospective preceding adjustments) retrospective preceding (a) adjustments) year (%) (a) adjustments) year (%) ------------------- -------- ------------- ------------- ---------- -------- ------------ ------------- ----------- ------------------- ------- ------------- ------------- ---------- ---------- ----------- ------------ ------------ Operating income 802,264 840,780 840,780 (4.6) 2,282,135 2,455,401 2,455,401 (7.1) Net profit attributable to shareholders of the Company 46,375 38,302 37,878 21.1 131,651 119,926 120,266 9.8 Net profit after deducting non-recurring profit/loss items attributable to shareholders of the Company 47,169 40,392 39,968 16.8 134,562 129,267 129,607 4.1 Weighted average 0.41 0.21 returns on net percentage percentage assets (%) 3.26 2.85 2.82 point 9.31 9.10 9.11 point Basic earnings per share (RMB) 0.25 0.21 0.21 21.1 0.72 0.66 0.66 9.8 Diluted earnings per share (RMB) 0.25 0.21 0.21 21.1 0.72 0.66 0.66 9.8 ------------------- ------- ------------- ------------- ---------- ---------- ----------- ------------ ------------ Unit: RMB Million ------------------------------------------ ----------------- ----------------- ----------------- ------------------ Items From the From the From the Changes over the beginning of the preceding beginning of year to the end the preceding of the year to the end preceding of the beginning of reporting preceding the year to the period (after reporting end of retrospective period (before same period of reporting adjustments) retrospective the preceding period (a) adjustments) year (%) ------------------------------------------ ----------------- ----------------- ----------------- ------------------ Net cash flows from operating activities 341,000 313,548 313,548 8.8 ------------------------------------------ ----------------- ----------------- ----------------- ------------------ As at the end of the As at the end Changes from the preceding year of the end of the As at the end (after preceding year preceding year of the retrospective (before to the end of reporting adjustments) retrospective the reporting Items period (a) adjustments) period (%) ------------------------------------------ ----------------- ----------------- ------------------ ------------------------------------------ ----------------- ----------------- ----------------- ------------------ Total assets 2,782,085 2,670,345 2,673,751 4.2 Total equity attributable to owners of the Company 1,418,839 1,365,889 1,369,576 3.9 ------------------------------------------ ----------------- ----------------- ----------------- ------------------ 3
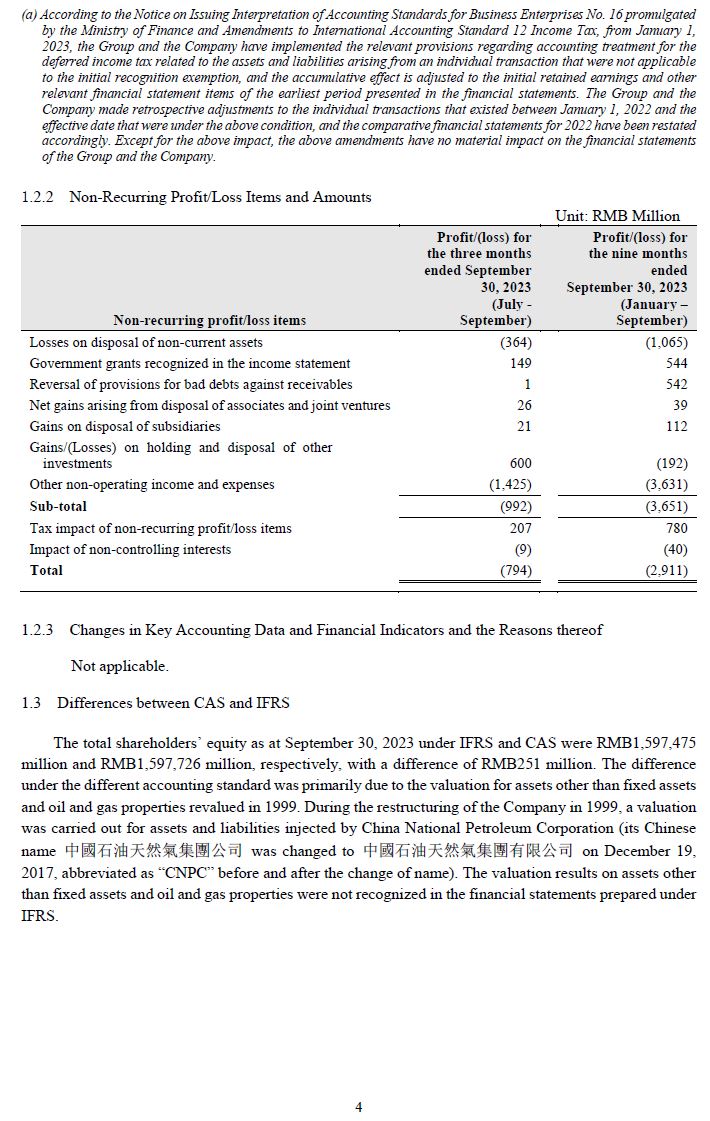
(a) According to the Notice on Issuing Interpretation of Accounting Standards for Business Enterprises No. 16 promulgated by the Ministry of Finance and Amendments to International Accounting Standard 12 Income Tax, from January 1, 2023, the Group and the Company have implemented the relevant provisions regarding accounting treatment for the deferred income tax related to the assets and liabilities arising from an individual transaction that were not applicable to the initial recognition exemption, and the accumulative effect is adjusted to the initial retained earnings and other relevant financial statement items of the earliest period presented in the financial statements. The Group and the Company made retrospective adjustments to the individual transactions that existed between January 1, 2022 and the effective date that were under the above condition, and the comparative financial statements for 2022 have been restated accordingly. Except for the above impact, the above amendments have no material impact on the financial statements of the Group and the Company. 1.2.2 Non-Recurring Profit/Loss Items and Amounts Unit: RMB Million ------------------------------------------------------------- --------------------- -- --------------------- Non-recurring profit/loss items Profit/(loss) for Profit/(loss) for the three months the nine months ended September ended 30, 2023 September 30, 2023 (July - (January - September) September) ------------------------------------------------------------- --------------------- -- --------------------- Losses on disposal of non-current assets (364) (1,065) Government grants recognized in the income statement 149 544 Reversal of provisions for bad debts against receivables 1 542 Net gains arising from disposal of associates and joint ventures 26 39 Gains on disposal of subsidiaries 21 112 Gains/(Losses) on holding and disposal of other investments 600 (192) Other non-operating income and expenses (1,425) (3,631) --------------------- --------------------- Sub-total (992) (3,651) --------------------- --------------------- Tax impact of non-recurring profit/loss items 207 780 Impact of non-controlling interests (9) (40) Total (794) (2,911) --------------------- --------------------- ===================== ===================== ------------------------------------------------------------- --------------------- -- --------------------- 1.2.3 Changes in Key Accounting Data and Financial Indicators and the Reasons thereof Not applicable. 1.3 Differences between CAS and IFRS The total shareholders' equity as at September 30, 2023 under IFRS and CAS were RMB1,597,475 million and RMB1,597,726 million, respectively, with a difference of RMB251 million. The difference under the different accounting standard was primarily due to the valuation for assets other than fixed assets and oil and gas properties revalued in 1999. During the restructuring of the Company in 1999, a valuation was carried out for assets and liabilities injected by China National Petroleum Corporation (its Chinese name was changed to on December 19, 2017, abbreviated as "CNPC" before and after the change of name). The valuation results on assets other than fixed assets and oil and gas properties were not recognized in the financial statements prepared under IFRS. 4

2. Information on Shareholders 2.1 Total Number of Shareholders Holding Ordinary Shares and Shareholdings of the Top Ten Shareholders ----------------------------------------------------------------- Total number of shareholders 474,239 shareholders including 468,672 holders of A shares and 5,567 registered holders holding ordinary shares as at of H shares. the end of the reporting period ----------------------------------------------------------------- Shareholdings of the top ten shareholders ----------------------------------------------------------------- Name of shareholders Nature of Percentage of Number of shares Number of Shares pledged, marked or shares with Shareholdings selling shareholders (%) held restrictions subject to lock-ups ----------------------------------------------------------------- Condition of Number of shares shares ----------------------------------------------------------------- CNPC State-owned 82.46 150,923,565,570 0 0 legal person (1) ----------------------------------------------------------------- HKSCC Nominees Limited(2) Overseas 11.42 20,906,404,656 (3) 0 0 legal person ----------------------------------------------------------------- China Petrochemical Corporation State-owned 1.00 1,830,210,000 0 0 legal person ----------------------------------------------------------------- Hong Kong Securities Clearing Overseas 0.67 1,218,643,059 0 0 Company Limited(4) legal person ----------------------------------------------------------------- China Securities Finance State-owned 0.56 1,020,165,128 0 0 Corporation Limited legal person ----------------------------------------------------------------- China Metallurgical Group State-owned 0.31 560,000,000 0 0 Corporation legal person ----------------------------------------------------------------- Central Huijin Asset Management State-owned 0.11 201,695,000 0 0 Ltd. legal person ----------------------------------------------------------------- Bosera Fund - Ansteel Group Corporation -Bosera Fund Xin'an State-owned No.1 Single Asset Management legal person 0.09 172,052,500 0 0 Plan ----------------------------------------------------------------- China Reform Investment Co., State-owned 0.07 124,680,199 0 0 Ltd. legal person ----------------------------------------------------------------- Bank of Communication Co., Ltd. State-owned 0.06 110,623,301 0 0 - E Fund SSE 50 Index Enhanced legal person Securities Investment Fund ----------------------------------------------------------------- Shareholdings of the top ten shareholders of shares without selling restrictions ----------------------------------------------------------------- Name of shareholders Number of shares held Type of shares ----------------------------------------------------------------- CNPC 150,923,565,570 A shares ----------------------------------------------------------------- HKSCC Nominees Limited 20,906,404,656 H shares ----------------------------------------------------------------- China Petrochemical Corporation 1,830,210,000 A shares ----------------------------------------------------------------- Hong Kong Securities Clearing Company Limited 1,218,643,059 A shares ----------------------------------------------------------------- China Securities Finance Corporation Limited 1,020,165,128 A shares ----------------------------------------------------------------- China Metallurgical Group Corporation 560,000,000 A shares ----------------------------------------------------------------- Central Huijin Asset Management Ltd. 201,695,000 A shares ----------------------------------------------------------------- Bosera Fund - Ansteel Group Corporation - Bosera Fund Xin'an No.1 A shares Single Asset Management Plan 172,052,500 ----------------------------------------------------------------- China Reform Investment Co., Ltd. 124,680,199 A shares ----------------------------------------------------------------- Bank of Communication Co., Ltd. - E Fund SSE 50 Index Enhanced Securities A shares Investment Fund 110,623,301 ----------------------------------------------------------------- Statement on the connection or activities acting in concert among the above-mentioned shareholders: Except for HKSCC Nominees Limited and Hong Kong Securities Clearing Company Limited that are wholly-owned subsidiaries of Hong Kong Exchanges and Clearing Limited, the Company is not aware of any connection among or between the other top ten shareholders or that they are persons acting in concert as provided for in the "Measures for the Administration of Acquisitions by Listed Companies". ----------------------------------------------------------------- (1) Such figure excludes the H shares indirectly held by CNPC through Fairy King Investments Limited, an overseas wholly-owned subsidiary of CNPC. 5
(2) HKSCC Nominees Limited is a wholly-owned subsidiary of Hong Kong Exchanges and Clearing Limited and acts as the nominee on behalf of other corporate or individual shareholders to hold the H shares of the Company. (3) 291,518,000 H shares were indirectly held by CNPC through Fairy King Investments Limited, an overseas wholly-owned subsidiary of CNPC, representing 0.16% of the total issued shares of the Company. These shares were held in the name of HKSCC Nominees Limited. (4) Hong Kong Securities Clearing Company Limited is a wholly-owned subsidiary of Hong Kong Exchanges and Clearing Limited and acts as the nominee on behalf of investors of The Stock Exchange of Hong Kong Limited to hold the A shares of the Company listed on Shanghai Stock Exchange. 2.2 Number of Shareholders Holding Preferred Shares and Shareholdings of Top Ten Shareholders Holding Preferred Shares of the Company Not applicable. 3. Business Review In the first three quarters of 2023, while the world economy maintained slow recovery, the PRC economy continued to recover steadily. The gross domestic product ("GDP") increased by 5.2% as compared with the same period of last year. The supply and demand of international crude oil is generally sufficient. The effect of comprehensive impact of supply and demand fundamentals, monetary policies and geopolitical incidents had caused the international crude oil price fluctuated at medium and high price level. The average spot price of North Sea Brent crude oil was US$82.07 per barrel, representing a decrease of 22.2% as compared with US$105.51 per barrel for the same period of last year. The average spot price of the West Texas Intermediate crude oil was US$77.36 per barrel, representing a decrease of 21.4% as compared with US$98.39 per barrel for the same period of last year. The consumption in the domestic refined products market has realized recovery growth and the demand for domestic natural gas market has maintained rapid growth. Seizing the opportunity of the recovery of the domestic macro-economic trend and the oil and gas market demand, the Group strictly implemented the new development philosophy and high-quality development requirements, coordinated production and operation, safety and environmental protection and reform and innovation. The Group vigorously strengthened the exploration and development of domestic oil and gas, increased its reserves and output, accelerated the structural adjustment and transformation and upgrading of refining and chemicals business, actively implemented its marketing and sales activities, continuously strengthened the improvement in trading profitability and further promoted the special action of improving quality and profitability. Both oil and gas industry chains operated safely, steadily and under control, main costs and expenses were under control and the operating results were the best compared with the same period in past years even under the condition of decrease in the oil and gas prices. In the first three quarters of 2023, the average realized price for crude oil of the Group was US$75.28 per barrel, representing a decrease of 20.9% as compared with US$95.19 per barrel for the same period of last year; the average selling price of the domestic natural gas was US$8.81 per kilo cubic feet, representing a decrease of 4.8% as compared with US$9.25 per kilo cubic feet for the same period of last year. For the first three quarters of 2023, the Group achieved a revenue of RMB2,282.135 billion under IFRS, representing a decrease of 7.1% as compared with RMB2,455.401 billion for the same period of last year; the profit for the period attributable to owners of the Company amounted to RMB131.651 billion, representing an increase of 9.8% as compared with RMB119.931 billion for the same period of last year; the net cash flows from operating activities and the free cash flow increased by 8.8% and 7.2% respectively as compared with the same period of last year. As such, the Group has a healthy financial position. In respect of domestic business under oil, gas and new energy segment, the Group strengthened the exploration and development of oil and gas, vigorously increased reserves and production. As such, the crude oil production remained steadily with some increment and the natural gas production maintained 6

relatively rapid growth. The Group progressed with the infrastructure of the new energy bases and advanced the integrated development of oil, gas and new energy. In the first three quarters of 2023, the domestic crude oil output from the Group amounted to 583.8 million barrels, representing an increase of 1.2% as compared with 576.9 million barrels for the same period of last year; the marketable natural gas output from the Group amounted to 3,513.7 billion cubic feet, representing an increase of 6.6% as compared with 3,295.9 billion cubic feet for the same period of last year; the oil and natural gas equivalent output amounted to 1,169.4 million barrels, representing an increase of 3.8% as compared with 1,126.4 million barrels for the same period of last year. In terms of its overseas business, seizing the "Belt and Road Initiative" development opportunity, the Group continued optimizing the oil and gas exploration business layout and asset structure, constantly improving the asset quality of overseas oil and gas. In the first three quarters of 2023, the overseas crude oil output from the Group amounted to 122.2 million barrels, representing an increase of 22.1% as compared with 100.1 million barrels for the same period of last year; the marketable natural gas output of the Group amounted to 142.9 billion cubic feet, representing a decrease of 4.0% as compared with 148.9 billion cubic feet for the same period of last year; the oil and natural gas equivalent output amounted to 146.0 million barrels, representing an increase of 16.8% as compared with 125.0 million barrels for the same period of last year; the overall crude oil output from the Group amounted to 706.0 million barrels, representing an increase of 4.3% as compared with 677.0 million barrels for the same period of last year; the overall marketable natural gas output of the Group amounted to 3,656.6 billion cubic feet, representing an increase of 6.1% as compared with 3,444.8 billion cubic feet for the same period of last year; the oil and natural gas equivalent output amounted to 1,315.4 million barrels, representing an increase of 5.1% as compared with 1,251.4 million barrels for the same period of last year. The Group persisted in profitable exploration and development and effectively controlled costs and expenses. The unit oil and gas lifting costs for the first three quarters of 2023 were US$11.25 per barrel, representing a decrease of 4.1% as compared with US$11.73 per barrel for the same period of last year. For the first three quarters of 2023, the oil, gas and new energy segment achieved a revenue of RMB647,769 million, representing a decrease of 6.0% as compared with RMB688,759 million for the same period of last year, as a result of the comprehensive effect of the decrease in the crude oil prices and the increase in the sales volumes, and profit from operations of RMB132,696 million, representing a decrease of 4.5% as compared with RMB138,933 million for the same period of last year. 7

Key Figures for the Oil, Gas and New Energy Segment ------------------------------------- --------------------- -------------------------------- ------------- Operating Figures Unit For the nine months ended Changes (%) September 30, ------------------------------------- --------------------- -------------------------------- ------------- ------------------------------------- --------------------- ---------------- --------------- ------------- 2023 2022 ------------------------------------- --------------------- ---------------- --------------- ------------- Crude oil output Million barrels 706.0 677.0 4.3 ------------------------------------- --------------------- ---------------- --------------- ------------- of which: Domestic Million barrels 583.8 576.9 1.2 ------------------------------------- --------------------- ---------------- --------------- ------------- Overseas Million barrels 122.2 100.1 22.1 ------------------------------------- --------------------- ---------------- --------------- ------------- Marketable natural gas output Billion cubic feet 3,656.6 3,444.8 6.1 ------------------------------------- --------------------- ---------------- --------------- ------------- of which: Domestic Billion cubic feet 3,513.7 3,295.9 6.6 ------------------------------------- --------------------- ---------------- --------------- ------------- Overseas Billion cubic feet 142.9 148.9 (4.0) ------------------------------------- --------------------- ---------------- --------------- ------------- Oil and natural gas equivalent output Million barrels 1,315.4 1,251.4 5.1 ------------------------------------- --------------------- ---------------- --------------- ------------- of which: Domestic Million barrels 1,169.4 1,126.4 3.8 ------------------------------------- --------------------- ---------------- --------------- ------------- Overseas Million barrels 146.0 125.0 16.8 ------------------------------------- --------------------- ---------------- --------------- ------------- Note: Figures have been converted at the rate of 1 ton of crude oil = 7.389 barrels and 1 cubic meter of natural gas = 35.315 cubic feet. In respect of refining, chemicals and new materials segment, the Group optimized production arrangement and maintained the safe, stable and high-load operation of the production equipment. The Group, by adhering to the market-oriented approach, continuously optimized business layout, kept adjusting and improving product structure, strived to increase production of high value-added and characteristic refined products. The Group promoted the "basic+high-end" chemical strategy and vigorously developed characteristic advantageous chemical products. The Group vigorously developed new materials business and continued to increase the production and sales of chemical and new materials products. The Group accelerated structure adjustment and transformation and upgrade and actively promoted the construction of key projects such as the transformation and upgrading of Jilin Petrochemical Branch and Guangxi Petrochemical Branch. For the first three quarters of 2023, the Group processed a total amount of 1,043.6 million barrels of crude oil, representing an increase of 16.5% as compared with 895.7 million barrels for the same period of last year. The Group produced 92.451 million tons of gasoline, kerosene and diesel, representing an increase of 19.4% as compared with 77.456 million tons for the same period of last year. The outputs of chemical commodity products reached 26.105 million tons, representing an increase of 11.2% as compared with 23.486 million tons for the same period of last year. For the first three quarters of 2023, the refining, chemicals and new materials segment achieved a revenue of RMB902.756 billion, representing an increase of 2.6% as compared with RMB879.521 billion for the same period of last year, and profit from operations of RMB27.812 billion, representing an increase of 5.5% as compared with RMB26.366 billion for the same period of last year, among which, the profit from operations in the refining business amounted to RMB27.681 billion, representing an increase of 4.1% as compared with RMB26.587 billion for the same period of last year, and the profit from operations in the chemicals business amounted to RMB131 million, representing an increase of RMB352 million as compared with the operating loss of RMB221 million for the same period of last year. 8

Key Figures for the Refining, Chemicals and New Materials Segment ---------------------------------------- ---------------- ----------------------------- -------------------- Operating Figures Unit For the nine months ended Changes September 30, (%) ---------------------------------------- ---------------- ----------------------------- -------------------- ---------------------------------------- ---------------- -------------- -------------- -------------------- 2023 2022 ---------------------------------------- ---------------- -------------- -------------- -------------------- Processed crude oil Million barrels 1,043.6 895.7 16.5 ---------------------------------------- ---------------- -------------- -------------- -------------------- Gasoline, kerosene and diesel output '000 tons 92,451 77,456 19.4 ---------------------------------------- ---------------- -------------- -------------- -------------------- of which: Gasoline '000 tons 37,749 32,768 15.2 ---------------------------------------- ---------------- -------------- -------------- -------------------- Kerosene '000 tons 11,002 6,173 78.2 ---------------------------------------- ---------------- -------------- -------------- -------------------- Diesel '000 tons 43,700 38,515 13.5 ---------------------------------------- ---------------- -------------- -------------- -------------------- Output of key chemical products ---------------------------------------- ---------------- -------------- -------------- -------------------- Ethylene '000 tons 5,826 5,498 6.0 ---------------------------------------- ---------------- -------------- -------------- -------------------- Synthetic resin '000 tons 9,158 8,623 6.2 ---------------------------------------- ---------------- -------------- -------------- -------------------- Synthetic fiber materials and polymers '000 tons 809 837 (3.3) ---------------------------------------- ---------------- -------------- -------------- -------------------- Synthetic rubber '000 tons 703 795 (11.6) ---------------------------------------- ---------------- -------------- -------------- -------------------- Urea '000 tons 1,590 1,995 (20.3) ---------------------------------------- ---------------- -------------- -------------- -------------------- Note: Figures have been converted at the rate of 1 ton of crude oil = 7.389 barrels. In respect of the marketing segment, the Group seized the opportunity of domestic macroeconomic recovery and demand recovery in the domestic refined oil market, increased profitable market development efforts, enhanced the quality of marketing networks, optimized resource allocation, improved customer service quality and strived to expand the sales of refined oil. The Group actively promoted the layout in electric vehicle charging field, acquired Potevio New Energy Co., Ltd and continuously improved electric vehicle charging network. The Group, by adhering to the different operation philosophy in the "two markets" (domestic market and international market), continuously improved trade marketing capabilities and cross market operation capabilities and helped enhance the overall value of the industrial chain. In the first three quarters of 2023, the Group sold 125.624 million tons of gasoline, kerosene and diesel, representing an increase of 13.4% as compared with 110.751 million tons for the same period of last year, among which, 93.079 million tons of gasoline, kerosene and diesel were sold domestically, representing an increase of 17.2% as compared with 79.401 million tons for the same period of last year. For the first three quarters of 2023, the marketing segment achieved a revenue of RMB1,938.454 billion, representing a decrease of 8.1% as compared with RMB2,109.425 billion for the same period of last year, mainly due to a decrease in international trade revenue, and profit from operations of RMB17.277 billion, representing an increase of RMB10.035 billion as compared with RMB7.242 billion for the same period of last year. 9
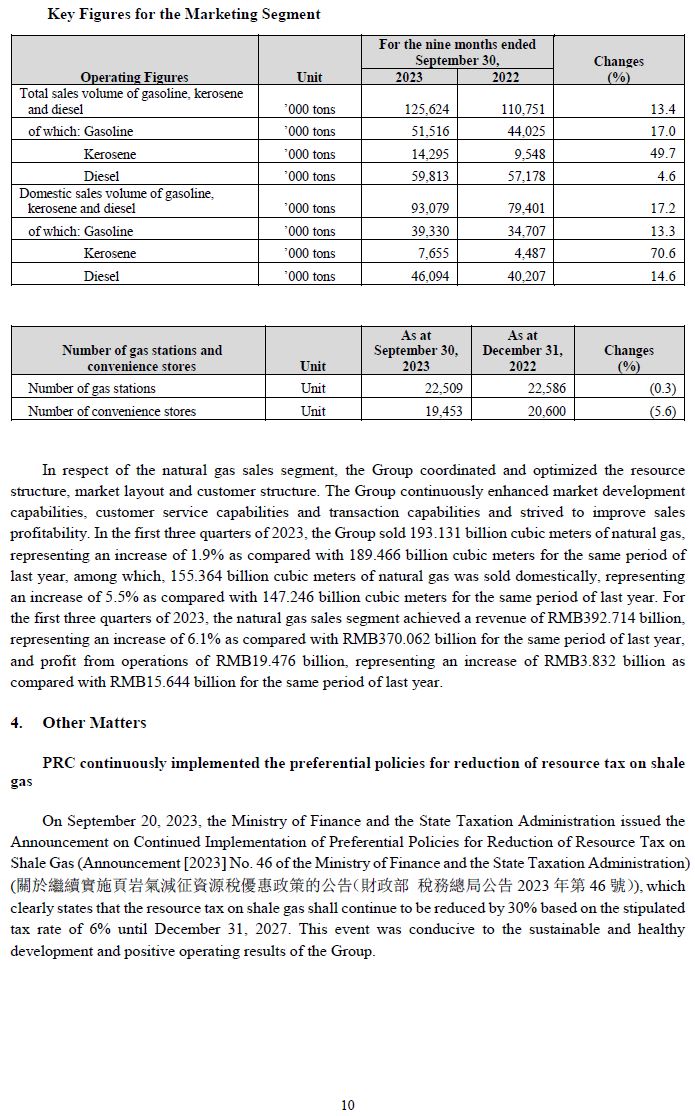
Key Figures for the Marketing Segment ----------------------------------------- --------------- ----------------------------- -------------------- Operating Figures Unit For the nine months ended Changes September 30, (%) ----------------------------------------- --------------- ----------------------------- -------------------- ----------------------------------------- --------------- -------------- -------------- -------------------- 2023 2022 ----------------------------------------- --------------- -------------- -------------- -------------------- Total sales volume of gasoline, kerosene '000 tons 125,624 110,751 13.4 and diesel ----------------------------------------- --------------- -------------- -------------- -------------------- of which: Gasoline '000 tons 51,516 44,025 17.0 ----------------------------------------- --------------- -------------- -------------- -------------------- Kerosene '000 tons 14,295 9,548 49.7 ----------------------------------------- --------------- -------------- -------------- -------------------- Diesel '000 tons 59,813 57,178 4.6 ----------------------------------------- --------------- -------------- -------------- -------------------- Domestic sales volume of gasoline, kerosene and diesel '000 tons 93,079 79,401 17.2 ----------------------------------------- --------------- -------------- -------------- -------------------- of which: Gasoline '000 tons 39,330 34,707 13.3 ----------------------------------------- --------------- -------------- -------------- -------------------- Kerosene '000 tons 7,655 4,487 70.6 ----------------------------------------- --------------- -------------- -------------- -------------------- Diesel '000 tons 46,094 40,207 14.6 ----------------------------------------- --------------- -------------- -------------- -------------------- ------------------------------------------ -------------- ---------------- ---------------- ---------------- Number of gas stations and convenience Unit As at September As at December Changes stores 30, 2023 31, 2022 (%) ------------------------------------------ -------------- ---------------- ---------------- ---------------- Number of gas stations Unit 22,509 22,586 (0.3) ------------------------------------------ -------------- ---------------- ---------------- ---------------- Number of convenience stores Unit 19,453 20,600 (5.6) ------------------------------------------ -------------- ---------------- ---------------- ---------------- In respect of the natural gas sales segment, the Group coordinated and optimized the resource structure, market layout and customer structure. The Group continuously enhanced market development capabilities, customer service capabilities and transaction capabilities and strived to improve sales profitability. In the first three quarters of 2023, the Group sold 193.131 billion cubic meters of natural gas, representing an increase of 1.9% as compared with 189.466 billion cubic meters for the same period of last year, among which, 155.364 billion cubic meters of natural gas was sold domestically, representing an increase of 5.5% as compared with 147.246 billion cubic meters for the same period of last year. For the first three quarters of 2023, the natural gas sales segment achieved a revenue of RMB392.714 billion, representing an increase of 6.1% as compared with RMB370.062 billion for the same period of last year, and profit from operations of RMB19.476 billion, representing an increase of RMB3.832 billion as compared with RMB15.644 billion for the same period of last year. 4. Other Matters PRC continuously implemented the preferential policies for reduction of resource tax on shale gas On September 20, 2023, the Ministry of Finance and the State Taxation Administration issued the Announcement on Continued Implementation of Preferential Policies for Reduction of Resource Tax on Shale Gas (Announcement [2023] No. 46 of the Ministry of Finance and the State Taxation Administration) ( 2023 46), which clearly states that the resource tax on shale gas shall continue to be reduced by 30% based on the stipulated tax rate of 6% until December 31, 2027. This event was conducive to the sustainable and healthy development and positive operating results of the Group. 10

5. Quarterly Financial Statements 5.1 Financial statements for the third quarter of 2023 prepared in accordance with CAS 1?(R)Consolidated Balance Sheet ----------------------------------------------- ---- -------------------------- -- ------------------------- ASSETS September 30, 2023 December 31, 2022 -------------------------- ------------------------- RMB million RMB million ----------------------------------------------- ---- -------------------------- -- ------------------------- Current assets Cash at bank and on hand 276,590 225,049 Financial assets at fair value through profit or loss 2,558 3,876 Derivative financial assets 12,498 21,133 Accounts receivable 105,739 72,028 Receivables financing 10,039 4,376 Advances to suppliers 29,397 13,920 Other receivables 43,907 45,849 Inventories 186,706 167,751 Other current assets 57,367 59,885 -------------------------- ------------------------- Total current assets 724,801 613,867 -------------------------- ------------------------- Non-current assets Investments in other equity instruments 846 950 Long-term equity investments 278,924 269,671 Fixed assets 452,312 463,027 Oil and gas properties 814,601 832,610 Construction in progress 201,904 196,876 Right-of-use assets 126,415 132,735 Intangible assets 92,573 92,960 Goodwill 7,527 7,317 Long-term prepaid expenses 12,646 10,388 Deferred tax assets 18,092 16,293 Other non-current assets 51,444 33,651 -------------------------- ------------------------- Total non-current assets 2,057,284 2,056,478 -------------------------- ------------------------- TOTAL ASSETS 2,782,085 2,670,345 ========================== ========================= ----------------------------------------------- ---- -------------------------- -- ------------------------- --------------------------------- ----------------------------- ---------------------------------- Chairman Director and President Chief Financial Officer Dai Houliang Huang Yongzhang Wang Hua 11

1. Consolidated Balance Sheet (Continued) ----------------------------------------------- ---- -------------------------- -- ------------------------- LIABILITIES AND SHAREHOLDERS' EQUITY September 30, 2023 December 31, 2022 -------------------------- ------------------------- RMB million RMB million ----------------------------------------------- ---- -------------------------- -- ------------------------- Current liabilities Short-term borrowings 41,759 38,375 Financial liabilities at fair value through profit or loss - 1,698 Derivative financial liabilities 8,333 11,146 Notes payable 20,473 15,630 Accounts payable 277,121 289,117 Contracts liabilities 86,334 77,337 Employee compensation payable 22,562 9,385 Taxes payable 49,310 53,514 Other payables 105,623 41,542 Current portion of non-current liabilities 129,389 70,561 Other current liabilities 13,022 15,958 -------------------------- ------------------------- Total current liabilities 753,926 624,263 -------------------------- ------------------------- Non-current liabilities Long-term borrowings 117,257 169,630 Debentures payable 17,080 52,848 Lease liabilities 114,158 118,200 Provisions 147,533 142,081 Deferred tax liabilities 25,583 21,313 Other non-current liabilities 8,822 7,594 -------------------------- ------------------------- Total non-current liabilities 430,433 511,666 -------------------------- ------------------------- Total liabilities 1,184,359 1,135,929 -------------------------- ------------------------- Shareholders' equity Share capital 183,021 183,021 Capital surplus 122,781 123,612 Special reserve 11,255 8,490 Other comprehensive income (20,983) (19,062) Surplus reserves 224,570 224,570 Undistributed profits 898,195 845,258 -------------------------- ------------------------- Total equity attributable to equity holders 1,418,839 1,365,889 of the Company -------------------------- ------------------------- Non-controlling interests 178,887 168,527 -------------------------- ------------------------- Total shareholders' equity 1,597,726 1,534,416 -------------------------- ------------------------- TOTAL LIABILITIES AND SHAREHOLDERS' EQUITY 2,782,085 2,670,345 ========================== ========================= ----------------------------------------------- ---- -------------------------- -- ------------------------- -------------------------------- ----------------------------- --------------------------------- Chairman Director and President Chief Financial Officer Dai Houliang Huang Yongzhang Wang Hua 12
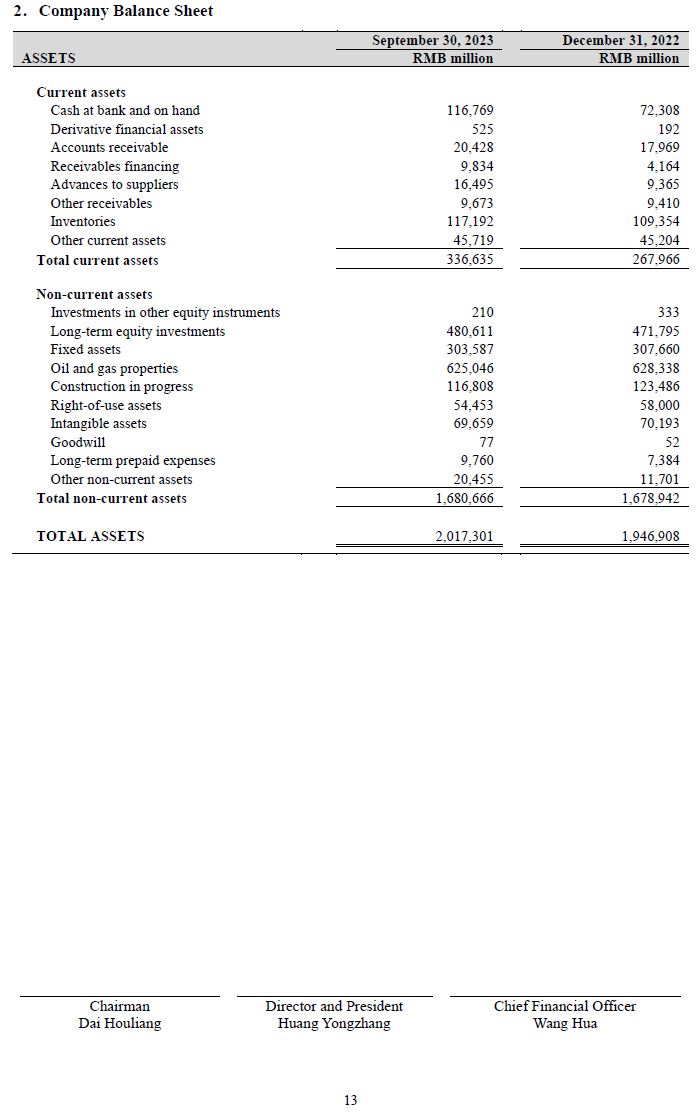
2. Company Balance Sheet ----------------------------------------------- ---- -------------------------- -- ------------------------- ASSETS September 30, 2023 December 31, 2022 -------------------------- ------------------------- RMB million RMB million ----------------------------------------------- ---- -------------------------- -- ------------------------- Current assets Cash at bank and on hand 116,769 72,308 Derivative financial assets 525 192 Accounts receivable 20,428 17,969 Receivables financing 9,834 4,164 Advances to suppliers 16,495 9,365 Other receivables 9,673 9,410 Inventories 117,192 109,354 Other current assets 45,719 45,204 -------------------------- ------------------------- Total current assets 336,635 267,966 -------------------------- ------------------------- Non-current assets Investments in other equity instruments 210 333 Long-term equity investments 480,611 471,795 Fixed assets 303,587 307,660 Oil and gas properties 625,046 628,338 Construction in progress 116,808 123,486 Right-of-use assets 54,453 58,000 Intangible assets 69,659 70,193 Goodwill 77 52 Long-term prepaid expenses 9,760 7,384 Other non-current assets 20,455 11,701 -------------------------- ------------------------- Total non-current assets 1,680,666 1,678,942 -------------------------- ------------------------- TOTAL ASSETS 2,017,301 1,946,908 ========================== ========================= ----------------------------------------------- ---- -------------------------- -- ------------------------- -------------------------------- ----------------------------- ---------------------------------- Chairman Director and President Chief Financial Officer Dai Houliang Huang Yongzhang Wang Hua 13

2. Company Balance Sheet (Continued) ----------------------------------------------- ---- ------------------------- -- -------------------------- LIABILITIES AND SHAREHOLDERS' EQUITY September 30, 2023 December 31, 2022 ------------------------- -------------------------- RMB million RMB million ----------------------------------------------- ---- ------------------------- -- -------------------------- Current liabilities Short-term borrowings 19,081 17,255 Derivative financial liabilities 326 - Notes payable 19,863 15,213 Accounts payable 95,377 121,220 Contracts liabilities 63,675 55,861 Employee compensation payable 18,220 6,817 Taxes payable 29,981 34,512 Other payables 182,203 99,302 Current portion of non-current liabilities 104,882 53,157 Other current liabilities 6,380 10,572 ------------------------- -------------------------- Total current liabilities 539,988 413,909 ------------------------- -------------------------- Non-current liabilities Long-term borrowings 38,400 90,743 Debentures payable 13,500 49,380 Lease liabilities 42,440 44,700 Provisions 108,400 104,553 Deferred tax liabilities 2,157 328 Other non-current liabilities 4,113 4,302 ------------------------- -------------------------- Total non-current liabilities 209,010 294,006 ------------------------- -------------------------- Total liabilities 748,998 707,915 ------------------------- -------------------------- Shareholders' equity Share capital 183,021 183,021 Capital surplus 122,898 123,486 Special reserve 6,955 4,620 Other comprehensive income 1,112 720 Surplus reserves 213,478 213,478 Undistributed profits 740,839 713,668 ------------------------- -------------------------- Total shareholders' equity 1,268,303 1,238,993 ------------------------- -------------------------- TOTAL LIABILITIES AND SHAREHOLDERS' EQUITY 2,017,301 1,946,908 ========================= ========================== ----------------------------------------------- ---- ------------------------- -- -------------------------- Chairman Director and President Chief Financial Officer Dai Houliang Huang Yongzhang Wang Hua 14

3-1. Consolidated Income Statement ------------------------------------------------------------- -- ----------------------------------------- Three months ended September 30 Items (July-September) ----------------------------------------- -------------------- ------------------ 2023 2022 -------------------- ------------------ RMB million RMB million ------------------------------------------------------------- -- -------------------- -------------------- Operating income 802,264 840,780 Less: Cost of sales (622,454) (673,348) Taxes and surcharges (72,226) (73,243) Selling expenses (18,140) (16,964) General and administrative expenses (14,653) (13,117) Research and development expenses (4,337) (4,816) Finance expenses (4,816) (5,902) Including: Interest expenses (5,997) (5,551) Interest income 1,685 1,068 Add: Other income 3,776 3,724 Investment income (2,371) (6,072) Including: Income from investment in associates and joint ventures 5,832 4,737 Gains from changes in fair value 1,854 6,869 Credit impairment (losses)/reversal (22) 63 Asset impairment losses (14) (12) Gains on asset disposal 68 141 -------------------- ------------------ Operating profit 68,929 58,103 -------------------- ------------------ Add: Non-operating income 534 672 Less: Non-operating expenses (2,243) (3,759) -------------------- ------------------ ------------------ Profit before taxation 67,220 55,016 -------------------- ------------------ Less: Taxation (15,448) (12,676) -------------------- ------------------ ------------------ Net profit 51,772 42,340 -------------------- ------------------ Classified by continuity of operations: Net profit from continuous operation 51,772 42,340 Net profit from discontinued operation - - Classified by ownership: Shareholders of the Company 46,375 38,302 Non-controlling interests 5,397 4,038 Earnings per share Basic earnings per share (RMB Yuan) 0.25 0.21 Diluted earnings per share (RMB Yuan) 0.25 0.21 -------------------- ------------------ Other comprehensive income, net of tax (3,940) 11,467 Other comprehensive income (net of tax) attributable to equity holders of the Company (2,909) 6,639 (1) Items that will not be reclassified to profit or loss: Changes in fair value of investments in other equity instruments (10) (69) (2) Items that may be reclassified to profit or loss: Other comprehensive income recognized under equity method (238) 491 (Losses)/gains on cash flow hedges (397) 1,782 Translation differences arising from translation of foreign currency financial statements (2,264) 4,435 Other comprehensive income (net of tax) attributable to non-controlling interests (1,031) 4,828 -------------------- -------------------- ------------------ Total comprehensive income 47,832 53,807 ==================== ================== Attributable to: Equity holders of the Company 43,466 44,941 Non-controlling interests 4,366 8,866 ==================== ================== ------------------------------------------------------------- -- -------------------- -------------------- --------------------------------- ----------------------------- ---------------------------------- Chairman Director and President Chief Financial Officer Dai Houliang Huang Yongzhang Wang Hua 15

3-2. Consolidated Income Statement ---------------------------------------------------------------- -- ---------------------------------------- Items Nine months ended September 30 ---------------------------------------- ----------------- -- ------------------- 2023 2022 ----------------- ------------------- RMB million RMB million ---------------------------------------------------------------- -- ----------------- -- ------------------- Operating income 2,282,135 2,455,401 Less: Cost of sales (1,786,921) (1,936,795) Taxes and surcharges (202,082) (213,843) Selling expenses (50,141) (49,736) General and administrative expenses (40,774) (37,461) Research and development expenses (13,988) (13,958) Finance expenses (14,004) (15,086) Including: Interest expenses (18,181) (15,195) Interest income 5,282 2,443 Add: Other income 12,147 10,130 Investment income 4,325 (10,452) Including: Income from investment in associates and joint ventures 15,499 12,841 Gains/(Losses) from changes in fair value 3,513 (1,563) Credit impairment reversal/(losses) 391 (440) Asset impairment losses (1,475) (579) Gains on asset disposal 216 490 ----------------- ------------------- Operating profit 193,342 186,108 ----------------- ------------------- Add: Non-operating income 1,586 1,733 Less: Non-operating expenses (5,955) (14,493) ----------------- ------------------- Profit before taxation 188,973 173,348 ----------------- ------------------- Less: Taxation (42,618) (40,058) ----------------- ------------------- Net profit 146,355 133,290 ----------------- ------------------- Classified by continuity of operations: Net profit from continuous operation 146,355 133,290 Net profit from discontinued operation - - Classified by ownership: Shareholders of the Company 131,651 119,926 Non-controlling interests 14,704 13,364 Earnings per share Basic earnings per share (RMB Yuan) 0.72 0.66 Diluted earnings per share (RMB Yuan) 0.72 0.66 ----------------- ------------------- Other comprehensive income, net of tax 86 23,273 Other comprehensive income (net of tax) attributable to equity holders of the Company (1,800) 15,326 (1) Items that will not be reclassified to profit or loss: Changes in fair value of investments in other equity instruments 46 (158) (2) Items that may be reclassified to profit or loss: Other comprehensive income recognized under equity method 141 714 (Losses)/gains on cash flow hedges (3,135) 8,421 Translation differences arising from translation of foreign currency financial statements 1,148 6,349 Other comprehensive income (net of tax) attributable to non-controlling interests 1,886 7,947 ----------------- ------------------- Total comprehensive income 146,441 156,563 ================= =================== Attributable to: Equity holders of the Company 129,851 135,252 Non-controlling interests 16,590 21,311 ================= =================== ---------------------------------------------------------------- -- ----------------- -- ------------------- ----------------------------------- ----------------------------- ---------------------------------- Chairman Director and President Chief Financial Officer Dai Houliang Huang Yongzhang Wang Hua 16
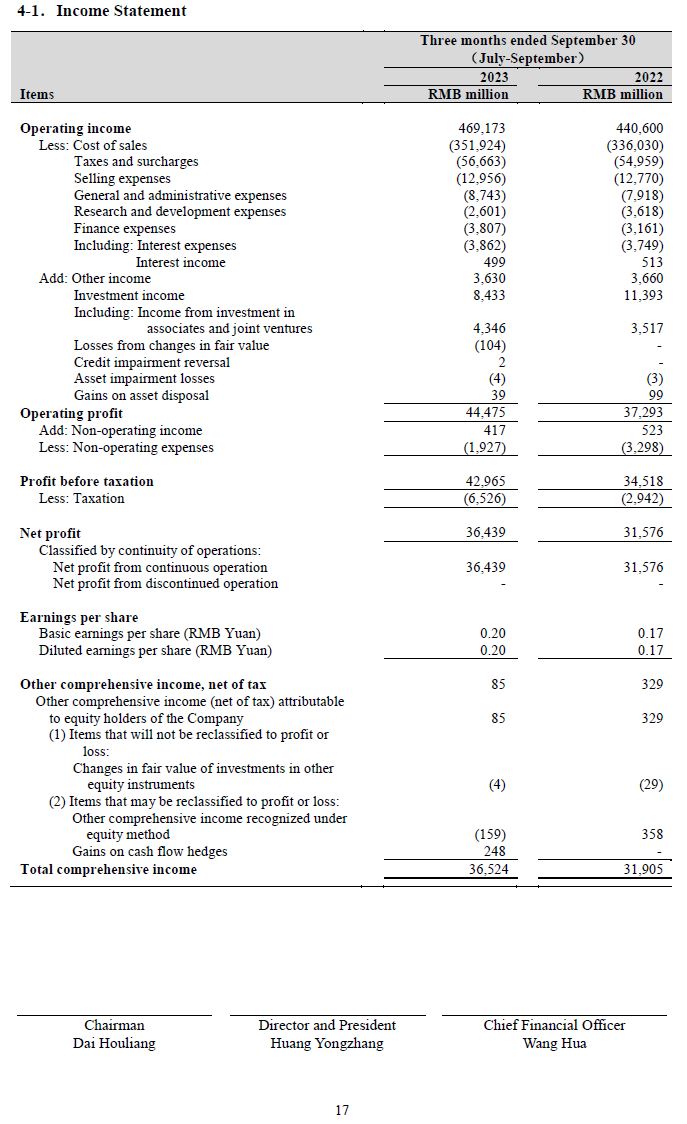
4-1. Income Statement ------------------------------------------------------- --- ------------------------------------------- Three months ended September 30 Items ?(diaeresis)July-September?(c) ------------------------------------------- ------------------- -- -------------------- 2023 2022 ------------------- -------------------- RMB million RMB million ------------------------------------------------------- --- ------------------- -- -------------------- Operating income 469,173 440,600 Less: Cost of sales (351,924) (336,030) Taxes and surcharges (56,663) (54,959) Selling expenses (12,956) (12,770) General and administrative expenses (8,743) (7,918) Research and development expenses (2,601) (3,618) Finance expenses (3,807) (3,161) Including: Interest expenses (3,862) (3,749) Interest income 499 513 Add: Other income 3,630 3,660 Investment income 8,433 11,393 Including: Income from investment in associates and joint ventures 4,346 3,517 Losses from changes in fair value (104) - Credit impairment reversal 2 - Asset impairment losses (4) (3) Gains on asset disposal 39 99 ------------------- -------------------- ------------------- Operating profit 44,475 37,293 ------------------- -------------------- ------------------- Add: Non-operating income 417 523 Less: Non-operating expenses (1,927) (3,298) ------------------- -------------------- Profit before taxation 42,965 34,518 ------------------- -------------------- Less: Taxation (6,526) (2,942) ------------------- -------------------- Net profit 36,439 31,576 ------------------- -------------------- Classified by continuity of operations: Net profit from continuous operation 36,439 31,576 Net profit from discontinued operation - - Earnings per share Basic earnings per share (RMB Yuan) 0.20 0.17 Diluted earnings per share (RMB Yuan) 0.20 0.17 ------------------- -------------------- Other comprehensive income, net of tax 85 329 Other comprehensive income (net of tax) attributable to equity holders of the Company 85 329 (1) Items that will not be reclassified to profit or loss: Changes in fair value of investments in other equity instruments (4) (29) (2) Items that may be reclassified to profit or loss: Other comprehensive income recognized under equity method (159) 358 Gains on cash flow hedges 248 - ------------------- -------------------- Total comprehensive income 36,524 31,905 =================== ==================== ------------------------------------------------------- --- ------------------- -- -------------------- -------------------------------- ----------------------------- ---------------------------------- Chairman Director and President Chief Financial Officer Dai Houliang Huang Yongzhang Wang Hua 17

4-2. Income Statement ----------------------------------------------------- --- --------------------------------------------- Items Nine months ended September 30 --------------------------------------------- --------------------- -- -------------------- 2023 2022 --------------------- -------------------- RMB million RMB million ----------------------------------------------------- --- --------------------- -- -------------------- Operating income 1,355,854 1,272,367 Less: Cost of sales (1,036,119) (953,363) Taxes and surcharges (155,330) (161,554) Selling expenses (35,104) (35,315) General and administrative expenses (24,757) (22,665) Research and development expenses (10,728) (11,292) Finance expenses (10,479) (9,855) Including: Interest expenses (11,362) (10,930) Interest income 1,359 983 Add: Other income 11,513 9,814 Investment income 30,125 34,577 Including: Income from investment in associates and joint ventures 11,072 9,624 Losses from changes in fair value (141) - Credit impairment losses (26) (45) Asset impairment losses (10) (28) Gains on asset disposal 162 356 --------------------- -------------------- Operating profit 124,960 122,997 --------------------- -------------------- Add: Non-operating income 1,096 1,425 Less: Non-operating expenses (5,351) (11,680) --------------------- -------------------- Profit before taxation 120,705 112,742 --------------------- -------------------- Less: Taxation (14,816) (12,368) --------------------- -------------------- Net profit 105,889 100,374 --------------------- -------------------- Classified by continuity of operations: Net profit from continuous operation 105,889 100,374 Net profit from discontinued operation - - Earnings per share Basic earnings per share (RMB Yuan) 0.58 0.55 Diluted earnings per share (RMB Yuan) 0.58 0.55 --------------------- -------------------- Other comprehensive income, net of tax 402 477 Other comprehensive income (net of tax) attributable to equity holders of the Company 402 477 (1) Items that will not be reclassified to profit or loss: Changes in fair value of investments in other equity instruments (86) (52) (2) Items that may be reclassified to profit or loss: Other comprehensive income recognized under equity method 302 529 Gains on cash flow hedges 186 - --------------------- -------------------- Total comprehensive income 106,291 100,851 ===================== ==================== ----------------------------------------------------- --- --------------------- -- -------------------- -------------------------------- ----------------------------- ---------------------------------- Chairman Director and President Chief Financial Officer Dai Houliang Huang Yongzhang Wang Hua 18
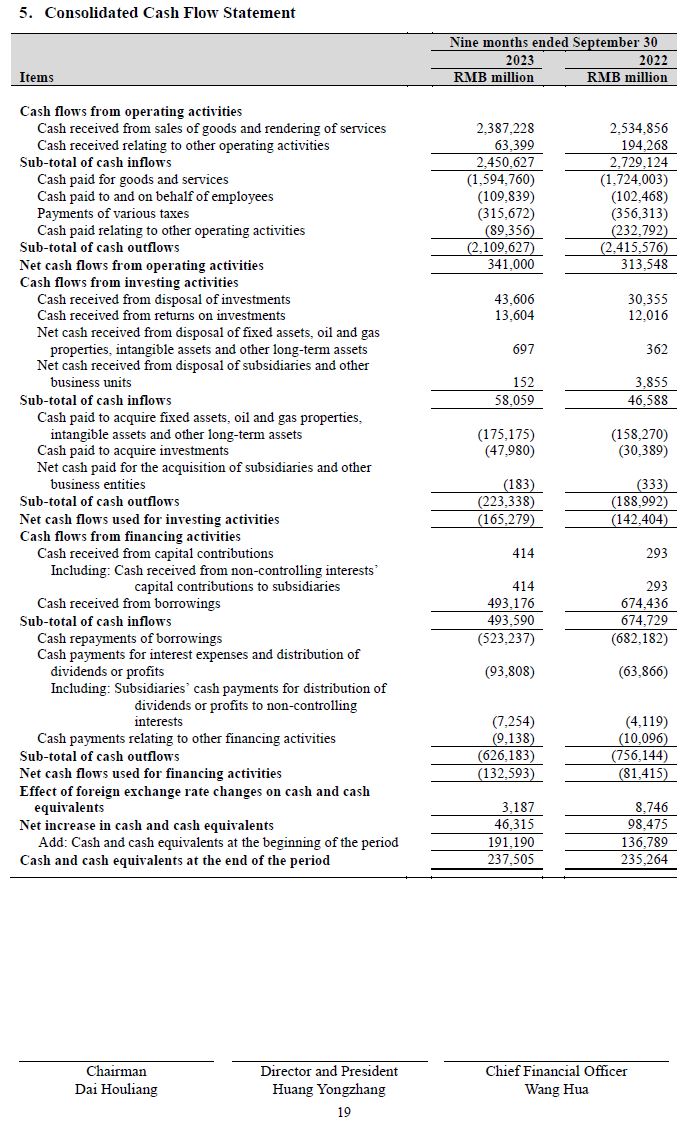
5. Consolidated Cash Flow Statement -------------------------------------------------------------- --- ------------------------------------ Items Nine months ended September 30 ------------------------------------ ---------------- -- ---------------- 2023 2022 ---------------- ---------------- ---------------- RMB million RMB million -------------------------------------------------------------- --- ---------------- -- ---------------- Cash flows from operating activities Cash received from sales of goods and rendering of services 2,387,228 2,534,856 Cash received relating to other operating activities 63,399 194,268 ---------------- ---------------- Sub-total of cash inflows 2,450,627 2,729,124 ---------------- ---------------- Cash paid for goods and services (1,594,760) (1,724,003) Cash paid to and on behalf of employees (109,839) (102,468) Payments of various taxes (315,672) (356,313) Cash paid relating to other operating activities (89,356) (232,792) ---------------- ---------------- Sub-total of cash outflows (2,109,627) (2,415,576) ---------------- ---------------- Net cash flows from operating activities 341,000 313,548 ---------------- ---------------- Cash flows from investing activities Cash received from disposal of investments 43,606 30,355 Cash received from returns on investments 13,604 12,016 Net cash received from disposal of fixed assets, oil and gas properties, intangible assets and other long-term assets 697 362 Net cash received from disposal of subsidiaries and other business units 152 3,855 ---------------- ---------------- Sub-total of cash inflows 58,059 46,588 ---------------- ---------------- Cash paid to acquire fixed assets, oil and gas properties, (175,175) (158,270) intangible assets and other long-term assets Cash paid to acquire investments (47,980) (30,389) Net cash paid for the acquisition of subsidiaries and other business entities (183) (333) ---------------- ---------------- Sub-total of cash outflows (223,338) (188,992) ---------------- ---------------- Net cash flows used for investing activities (165,279) (142,404) ---------------- ---------------- Cash flows from financing activities Cash received from capital contributions 414 293 Including: Cash received from non-controlling interests' capital contributions to subsidiaries 414 293 Cash received from borrowings 493,176 674,436 ---------------- ---------------- Sub-total of cash inflows 493,590 674,729 ---------------- ---------------- Cash repayments of borrowings (523,237) (682,182) Cash payments for interest expenses and distribution of dividends or profits (93,808) (63,866) Including: Subsidiaries' cash payments for distribution of dividends or profits to non-controlling interests (7,254) (4,119) Cash payments relating to other financing activities (9,138) (10,096) ---------------- ---------------- Sub-total of cash outflows (626,183) (756,144) ---------------- ---------------- Net cash flows used for financing activities (132,593) (81,415) ---------------- ---------------- Effect of foreign exchange rate changes on cash and cash equivalents 3,187 8,746 ---------------- ---------------- Net increase in cash and cash equivalents 46,315 98,475 ---------------- ---------------- Add: Cash and cash equivalents at the beginning of the period 191,190 136,789 ---------------- ---------------- Cash and cash equivalents at the end of the period 237,505 235,264 ================ ================ -------------------------------- ----------------------------- ---------------------------------- Chairman Director and President Chief Financial Officer Dai Houliang Huang Yongzhang Wang Hua 19

6. Company Cash Flow Statement ------------------------------------------------------------ -- --------------------------------------- Items Nine months ended September 30 --------------------------------------- ----------------- -- ------------------ 2023 2022 ----------------- ------------------ ----------------- RMB million RMB million ------------------------------------------------------------ -- ----------------- -- ------------------ Cash flows from operating activities Cash received from sales of goods and rendering of services 1,470,899 1,415,065 Cash received relating to other operating activities 12,316 11,125 ----------------- ------------------ Sub-total of cash inflows 1,483,215 1,426,190 ----------------- ------------------ Cash paid for goods and services (926,144) (850,640) Cash paid to and on behalf of employees (79,445) (74,093) Payments of various taxes (223,308) (253,751) Cash paid relating to other operating activities (17,549) (29,975) ----------------- ------------------ Sub-total of cash outflows (1,246,446) (1,208,459) ----------------- ------------------ Net cash flows from operating activities 236,769 217,731 ----------------- ------------------ Cash flows from investing activities Cash received from disposal of investments 7,624 2,827 Cash received from returns on investments 34,423 54,801 Net cash received from disposal of fixed assets, oil and gas properties, intangible assets and other long-term assets 514 221 Net cash received from disposal of subsidiaries and other business units - 392 ----------------- ------------------ Sub-total of cash inflows 42,561 58,241 ----------------- ------------------ Cash paid to acquire fixed assets, oil and gas (101,483) (102,291) properties, intangible assets and other long-term assets Cash paid to acquire investments (9,651) (5,814) ----------------- ------------------ Sub-total of cash outflows (111,134) (108,105) ----------------- ------------------ Net cash flows used for investing activities (68,573) (49,864) ----------------- ------------------ Cash flows from financing activities Cash received from borrowings 52,453 99,208 ----------------- ------------------ Sub-total of cash inflows 52,453 99,208 ----------------- ------------------ Cash repayments of borrowings (87,305) (101,514) Cash payments for interest expenses and distribution of dividends or profits (82,688) (58,720) Cash payments relating to other financing activities (4,695) (1,847) ----------------- ------------------ Sub-total of cash outflows (174,688) (162,081) ----------------- ------------------ Net cash flows used for financing activities (122,235) (62,873) ----------------- ------------------ Net increase in cash and cash equivalents 45,961 104,994 ----------------- ------------------ Add: Cash and cash equivalents at the beginning of the period 68,808 31,955 ----------------- ------------------ Cash and cash equivalents at the end of the period 114,769 136,949 ================= ================== ------------------------------------------------------------ -- ----------------- -- ------------------ Chairman Director and President Chief Financial Officer Dai Houliang Huang Yongzhang Wang Hua 20

5.2 Financial statements for the third quarter of 2023 prepared in accordance with IFRS 1-1. Consolidated Statement of Comprehensive Income ----------------------------------------------------------------- --- ----------------------------------- Three months ended September 30 (July-September) ----------------------------------- ----------------- -- -------------- 2023 2022 ----------------- -------------- --------------- -------------- RMB million RMB million -------------------------------------------------------------------- -- --------------- -- -------------- REVENUE 802,264 840,780 --------------- -------------- -------------- OPERATING EXPENSES Purchases, services and other (540,907) (596,888) Employee compensation costs (43,903) (39,629) Exploration expenses, including exploratory dry holes (3,135) (5,994) Depreciation, depletion and amortization (54,911) (50,596) Selling, general and administrative expenses (16,683) (15,120) Taxes other than income taxes (72,539) (73,584) Other expenses net (4,567) (3,127) --------------- -------------- TOTAL OPERATING EXPENSES (736,645) (784,938) --------------- -------------- PROFIT FROM OPERATIONS 65,619 55,842 --------------- -------------- -------------- FINANCE COSTS Exchange gain 3,043 10,156 Exchange loss (2,962) (11,234) Interest income 1,685 1,068 Interest expense (5,997) (5,551) --------------- -------------- TOTAL NET FINANCE COSTS (4,231) (5,561) --------------- -------------- -------------- SHARE OF PROFIT OF ASSOCIATES AND JOINT VENTURES 5,832 4,737 --------------- -------------- PROFIT BEFORE INCOME TAX EXPENSE 67,220 55,018 INCOME TAX EXPENSE (15,444) (12,676) --------------- -------------- PROFIT FOR THE PERIOD 51,776 42,342 --------------- -------------- OTHER COMPREHENSIVE INCOME (1) Items that will not be reclassified to profit or loss: Fair value changes in equity investment measured at fair value through other comprehensive income (63) (134) Currency translation differences (978) 4,893 (2) Items that are or may be reclassified subsequently to profit or loss: Currency translation differences (2,264) 4,435 (Losses)/gains on cash flow hedges (397) 1,782 Share of the other comprehensive income of associates and joint ventures accounted for using the equity method (238) 491 --------------- -------------- OTHER COMPREHENSIVE INCOME, NET OF TAX (3,940) 11,467 --------------- -------------- TOTAL COMPREHENSIVE INCOME FOR THE PERIOD 47,836 53,809 =============== ============== PROFIT FOR THE PERIOD ATTRIBUTABLE TO: Owners of the Company 46,379 38,304 Non-controlling interests 5,397 4,038 --------------- -------------- 51,776 42,342 =============== ============== --------------- -------------- TOTAL COMPREHENSIVE INCOME FOR THE PERIOD ATTRIBUTABLE TO: Owners of the Company 43,470 44,943 Non-controlling interests 4,366 8,866 --------------- -------------- 47,836 53,809 =============== ============== BASIC AND DILUTED EARNINGS PER SHARE ATTRIBUTABLE TO OWNERS OF THE 0.25 0.21 COMPANY (RMB YUAN) =============== ============== -------------------------------------------------------------------- -- --------------- -- -------------- 21

1-2. Consolidated Statement of Comprehensive Income -------------------------------------------------------------- -- --------------------------------------- Nine months ended September 30 --------------------------------------- ----------------- --- ----------------- 2023 2022 ----------------- ----------------- RMB million RMB million -------------------------------------------------------------- -- ----------------- --- ----------------- REVENUE 2,282,135 2,455,401 ----------------- ----------------- ----------------- OPERATING EXPENSES Purchases, services and other (1,545,730) (1,708,419) Employee compensation costs (121,701) (114,556) Exploration expenses, including exploratory dry holes (12,233) (18,833) Depreciation, depletion and amortization (167,928) (153,459) Selling, general and administrative expenses (45,330) (43,529) Taxes other than income taxes (202,759) (214,815) Other expenses net (218) (26,933) ----------------- ----------------- TOTAL OPERATING EXPENSES (2,095,899) (2,280,544) ----------------- ----------------- PROFIT FROM OPERATIONS 186,236 174,857 ----------------- ----------------- ----------------- FINANCE COSTS Exchange gain 17,142 19,076 Exchange loss (17,003) (20,669) Interest income 5,282 2,443 Interest expense (18,181) (15,195) ----------------- ----------------- TOTAL NET FINANCE COSTS (12,760) (14,345) ----------------- ----------------- ----------------- SHARE OF PROFIT OF ASSOCIATES AND JOINT VENTURES 15,499 12,841 ----------------- ----------------- PROFIT BEFORE INCOME TAX EXPENSE 188,975 173,353 INCOME TAX EXPENSE (42,620) (40,058) ----------------- ----------------- PROFIT FOR THE PERIOD 146,355 133,295 ----------------- ----------------- OTHER COMPREHENSIVE INCOME (1) Items that will not be reclassified to profit or loss: Fair value changes in equity investment measured at fair value through other comprehensive income 16 (302) Currency translation differences 1,916 8,091 (2) Items that are or may be reclassified subsequently to profit or loss: Currency translation differences 1,148 6,349 (Losses)/gains on cash flow hedges (3,135) 8,421 Share of the other comprehensive income of associates and joint ventures accounted for using the equity method 141 714 ----------------- ----------------- OTHER COMPREHENSIVE INCOME, NET OF TAX 86 23,273 ----------------- ----------------- TOTAL COMPREHENSIVE INCOME FOR THE PERIOD 146,441 156,568 ================= ================= PROFIT FOR THE PERIOD ATTRIBUTABLE TO: Owners of the Company 131,651 119,931 Non-controlling interests 14,704 13,364 ----------------- ----------------- 146,355 133,295 ================= ================= ----------------- ----------------- TOTAL COMPREHENSIVE INCOME FOR THE PERIOD ATTRIBUTABLE TO: Owners of the Company 129,851 135,257 Non-controlling interests 16,590 21,311 ----------------- ----------------- 146,441 156,568 ================= ================= BASIC AND DILUTED EARNINGS PER SHARE ATTRIBUTABLE TO OWNERS 0.72 0.66 OF THE COMPANY (RMB YUAN) ================= ================= -------------------------------------------------------------- -- ----------------- --- ----------------- 22
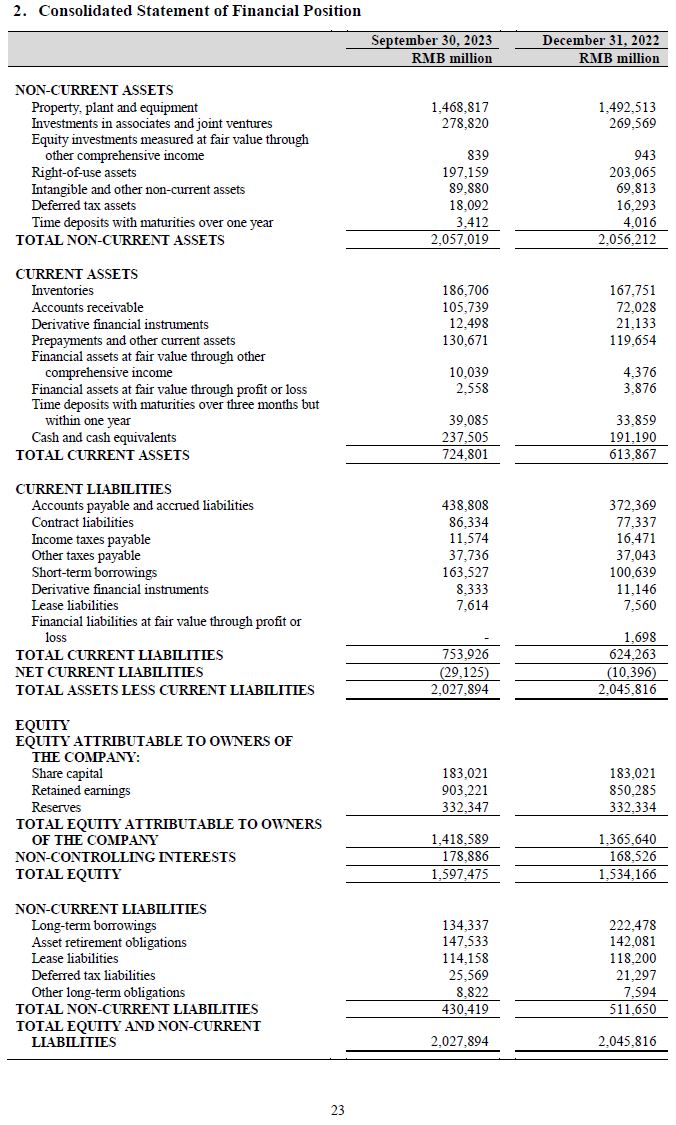
2. Consolidated Statement of Financial Position --------------------------------------------------- ------------------------- ------------------------- September 30, 2023 December 31, 2022 ----------------------- ----------------------- RMB million RMB million --------------------------------------------------- ------------------------- ------------------------- NON-CURRENT ASSETS Property, plant and equipment 1,468,817 1,492,513 Investments in associates and joint ventures 278,820 269,569 Equity investments measured at fair value through other comprehensive income 839 943 Right-of-use assets 197,159 203,065 Intangible and other non-current assets 89,880 69,813 Deferred tax assets 18,092 16,293 Time deposits with maturities over one year 3,412 4,016 ----------------------- ----------------------- TOTAL NON-CURRENT ASSETS 2,057,019 2,056,212 ----------------------- ----------------------- CURRENT ASSETS Inventories 186,706 167,751 Accounts receivable 105,739 72,028 Derivative financial instruments 12,498 21,133 Prepayments and other current assets 130,671 119,654 Financial assets at fair value through other comprehensive income 10,039 4,376 Financial assets at fair value through profit or loss 2,558 3,876 Time deposits with maturities over three months but within one year 39,085 33,859 Cash and cash equivalents 237,505 191,190 ----------------------- ----------------------- TOTAL CURRENT ASSETS 724,801 613,867 ----------------------- ----------------------- CURRENT LIABILITIES Accounts payable and accrued liabilities 438,808 372,369 Contract liabilities 86,334 77,337 Income taxes payable 11,574 16,471 Other taxes payable 37,736 37,043 Short-term borrowings 163,527 100,639 Derivative financial instruments 8,333 11,146 Lease liabilities 7,614 7,560 Financial liabilities at fair value through profit or loss - 1,698 ----------------------- ----------------------- TOTAL CURRENT LIABILITIES 753,926 624,263 ----------------------- ----------------------- NET CURRENT LIABILITIES (29,125) (10,396) ----------------------- ----------------------- TOTAL ASSETS LESS CURRENT LIABILITIES 2,027,894 2,045,816 ======================= ======================= EQUITY EQUITY ATTRIBUTABLE TO OWNERS OF THE COMPANY: Share capital 183,021 183,021 Retained earnings 903,221 850,285 Reserves 332,347 332,334 ----------------------- ----------------------- TOTAL EQUITY ATTRIBUTABLE TO OWNERS OF THE 1,418,589 1,365,640 COMPANY ----------------------- ----------------------- NON-CONTROLLING INTERESTS 178,886 168,526 ----------------------- ----------------------- TOTAL EQUITY 1,597,475 1,534,166 ----------------------- ----------------------- NON-CURRENT LIABILITIES Long-term borrowings 134,337 222,478 Asset retirement obligations 147,533 142,081 Lease liabilities 114,158 118,200 Deferred tax liabilities 25,569 21,297 Other long-term obligations 8,822 7,594 ----------------------- ----------------------- TOTAL NON-CURRENT LIABILITIES 430,419 511,650 ----------------------- ----------------------- TOTAL EQUITY AND NON-CURRENT LIABILITIES 2,027,894 2,045,816 ======================= ======================= --------------------------------------------------- ------------------------- ------------------------- 23
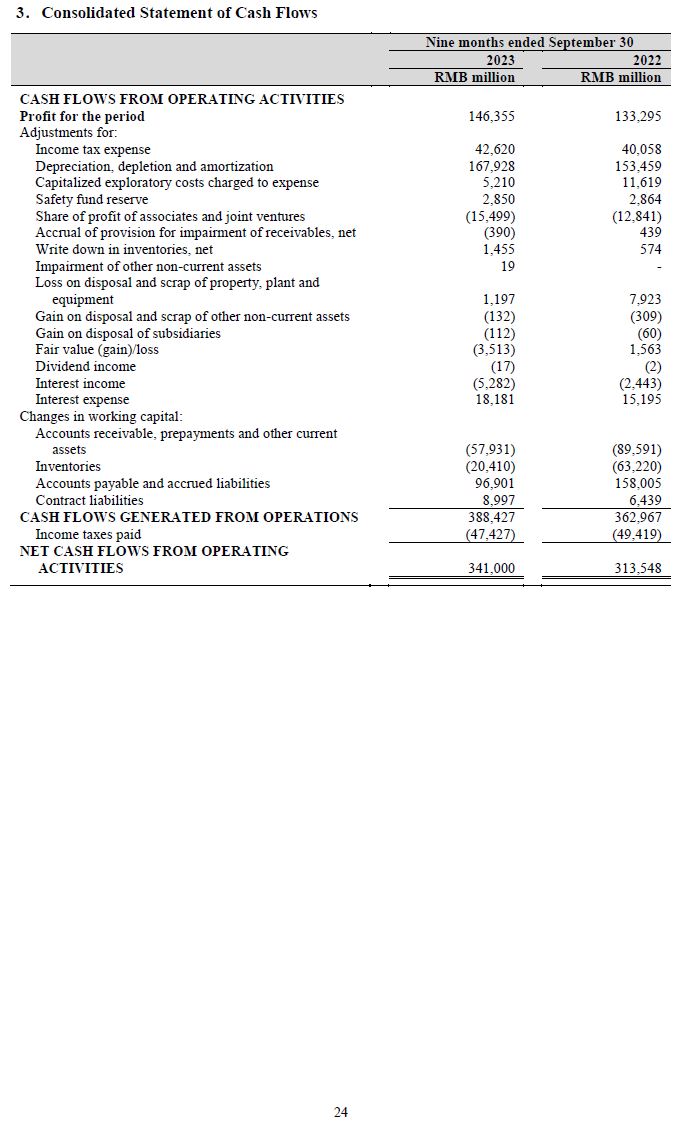
3. Consolidated Statement of Cash Flows --------------------------------------------------------- -- ------------------------------------------ Nine months ended September 30 ------------------------------------------ ------------------- -- ------------------- 2023 2022 ------------------- ------------------- RMB million RMB million --------------------------------------------------------- -- ------------------- -- ------------------- CASH FLOWS FROM OPERATING ACTIVITIES Profit for the period 146,355 133,295 Adjustments for: Income tax expense 42,620 40,058 Depreciation, depletion and amortization 167,928 153,459 Capitalized exploratory costs charged to expense 5,210 11,619 Safety fund reserve 2,850 2,864 Share of profit of associates and joint ventures (15,499) (12,841) Accrual of provision for impairment of receivables, net (390) 439 Write down in inventories, net 1,455 574 Impairment of other non-current assets 19 - Loss on disposal and scrap of property, plant and equipment 1,197 7,923 Gain on disposal and scrap of other non-current assets (132) (309) Gain on disposal of subsidiaries (112) (60) Fair value (gain)/loss (3,513) 1,563 Dividend income (17) (2) Interest income (5,282) (2,443) Interest expense 18,181 15,195 Changes in working capital: Accounts receivable, prepayments and other current assets (57,931) (89,591) Inventories (20,410) (63,220) Accounts payable and accrued liabilities 96,901 158,005 Contract liabilities 8,997 6,439 ------------------- ------------------- ------------------- CASH FLOWS GENERATED FROM OPERATIONS 388,427 362,967 Income taxes paid (47,427) (49,419) ------------------- ------------------- NET CASH FLOWS FROM OPERATING ACTIVITIES 341,000 313,548 =================== =================== --------------------------------------------------------- -- ------------------- -- ------------------- 24

3. Consolidated Statement of Cash Flows (Continued) --------------------------------------------------------- --------------------------------------------- Nine months ended September 30 ------------------------------------------- 2023 2022 -------------------- ------------------- RMB million RMB million --------------------------------------------------------- ---------------------- -- ------------------- -------------------- ------------------- CASH FLOWS FROM INVESTING ACTIVITIES Capital expenditures (174,092) (157,868) Acquisition of investments in associates and joint ventures (352) (1,103) Acquisition of intangible assets and other non-current assets (1,083) (402) Acquisition of subsidiaries (183) (333) Acquisition of financial assets at fair value through profit or loss (8) - Proceeds from disposal of property, plant and equipment 239 89 Proceeds from disposal of other non-current assets 631 291 Proceeds from disposal of investments and investments in associates 152 3,855 Proceeds from disposal of financial assets at fair value through profit or loss 435 - Interest received 5,755 1,765 Dividends received 7,849 10,251 (Increase)/Decrease in time deposits with maturities over three months (4,622) 1,051 -------------------- ------------------- NET CASH FLOWS USED FOR INVESTING ACTIVITIES (165,279) (142,404) -------------------- ------------------- CASH FLOWS FROM FINANCING ACTIVITIES Repayments of short-term borrowings (511,117) (594,481) Repayments of long-term borrowings (12,120) (87,701) Repayments of lease liabilities (9,138) (10,096) Interest paid (12,312) (9,337) Dividends paid to non-controlling interests (7,254) (4,119) Dividends paid to owners of the Company (74,242) (50,410) Increase in short-term borrowings 468,611 605,048 Increase in long-term borrowings 24,565 69,388 Cash contribution from non-controlling interests 414 293 -------------------- ------------------- NET CASH FLOWS USED FOR FINANCING ACTIVITIES (132,593) (81,415) -------------------- ------------------- TRANSLATION OF FOREIGN CURRENCY 3,187 8,746 -------------------- ------------------- Increase in cash and cash equivalents 46,315 98,475 Cash and cash equivalents at the beginning of the period 191,190 136,789 -------------------- ------------------- Cash and cash equivalents at the end of the period 237,505 235,264 ==================== =================== --------------------------------------------------------- ---------------------- -- ------------------- 25

4. Segment Information ----------------------------------------------------- -- ---------------------------------------------- Nine months ended September 30 ---------------------------------------------- 2023 2022 ---------------------- -------------------- RMB million RMB million ----------------------------------------------------- -- ---------------------- -- -------------------- ---------------------- -------------------- Revenue Oil, Gas and New Energy Intersegment sales 542,827 578,823 Revenue from external customers 104,942 109,936 ---------------------- -------------------- 647,769 688,759 Refining, Chemicals and New Materials Intersegment sales 669,582 624,806 Revenue from external customers 233,174 254,715 ---------------------- -------------------- 902,756 879,521 Marketing Intersegment sales 370,197 374,681 Revenue from external customers 1,568,257 1,734,744 ---------------------- -------------------- 1,938,454 2,109,425 Natural Gas Sales Intersegment sales 18,956 15,741 Revenue from external customers 373,758 354,321 ---------------------- -------------------- 392,714 370,062 Head Office and Other Intersegment sales 231 188 Revenue from external customers 2,004 1,685 ---------------------- -------------------- 2,235 1,873 Total revenue from external customers 2,282,135 2,455,401 ---------------------- -------------------- Profit/(loss) from operations Oil, Gas and New Energy 132,696 138,933 Refining, Chemicals and New Materials 27,812 26,366 Marketing 17,277 7,242 Natural Gas Sales 19,476 15,644 Head Office and Other (11,025) (13,328) ---------------------- -------------------- 186,236 174,857 ====================== ==================== ----------------------------------------------------- -- ---------------------- -- -------------------- 5.3 Auditors' Opinion Type and Auditors' Report Not applicable. 26

By Order of the Board of Directors PetroChina Company Limited Dai Houliang Chairman Beijing, the PRC October 30, 2023 As at the date of this announcement, the Board comprises Mr. Dai Houliang as Chairman; Mr. Hou Qijun as Vice Chairman and non-executive Director; Mr. Duan Liangwei and Mr. Xie Jun as non-executive Directors; Mr. Huang Yongzhang and Mr. Ren Lixin as executive Directors; and Mr. Cai Jinyong, Mr. Jiang, Simon X., Mr. Zhang Laibin, Ms. Hung Lo Shan Lusan and Mr. Ho Kevin King Lun as independent non-executive Directors. This announcement is published in English and Chinese. In the event of any inconsistency between the two versions, the Chinese version shall prevail. 27